
.thumb.jpg.4ea64b4b794946141c4d4408144d566e.jpg)
The model portfolio also expended a bit of cash to reset the long call position, so the strategy could participate more if and when the market continues to rebound.
Even with this good performance, we are always looking to improve overall performance. Improved performance can occur through a reduction in risk, better absolute performance over time, or a combination of the two.
I’ve created three different portfolios for demonstrative purposes. Portfolio 1 is 100% long SPY. Portfolio 2 is 25% each of SPY, IWM (small caps), QQQ (technology), and EFA (international). Portfolio 3 roughly curve fit the best blend of them (thanks to portfolio visualizer):
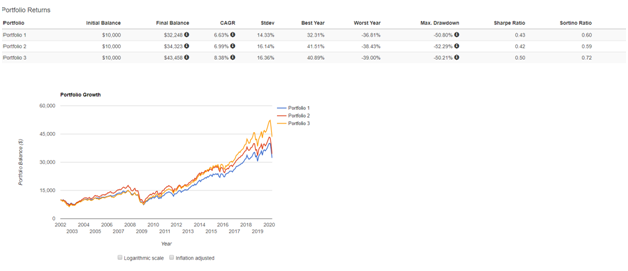
As can be seen, virtually any blend of diversified assets has outperformed simply holding one asset class over the last 20 years. If we curve fit, we can greatly increase performance – by almost 2% per year. Historically, going further back in time, this pattern holds even more true. A diversified blend of assets typically reduces risk and increases performance, over significant periods of time.
Of course, you’ll be able to find a 1-5 year period (or maybe even longer), where a single asset class outperforms a diversified basket – but good luck picking that asset class moving forward. Is it time for international stocks to rebound more than the U.S. despite lagging for a decade? Are small caps going to outperform large caps as they traditionally do? What about technology – will it continue to outperform other large caps? Maybe you have those answers, but I don’t. However, as a long term investor, I know that diversification works over time.
How does one decide what the “optimal” split is in allocation? If you look over the last 20 years, SPY has a CAGR of 5.58%, IWM 6.03%, QQQ 7.08%, and EFA 4.31%. What if we take out the recent bull run in large caps and look at the first decade of this century (2001-2010)? Things change drastically. SPY has a CARG of 3.00%, IWM 6.83%, QQQ 4.24%, and EFA 6.69%. If you expand further, you can find (thanks to Forbes):
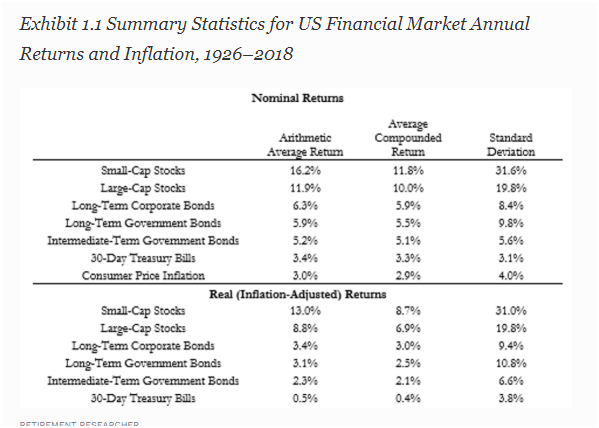
(Note: Technology was not an asset class for much of the above period).
After reviewing multiple periods of time (from one year to one hundred years), several trends are clear:
- Small caps typically outperform large caps;
- Over the last 10 years, large caps have been the best performing;
- Technology stocks have outperformed even large caps significantly in the last decade;
- International stocks have consistently under performed large cap, small cap, and technology, but that trend is “recent” in the last 20 years; but
- International has the lowest correlation to the listed classes.
There is no “magic” blend and each investor can create their own. Some people will be most comfortable with a straight 25/25/25/25 split, which takes any risk for picking which sector is going to perform the best off the table. Others will weigh the most recent better performers stronger. If we look at just the last 10 or 20 years, we would not allocate anything to international stocks. However, I personally like the low level of correlation and want at least some exposure internationally. I also expect a reversion to small caps outperforming, particularly in the near future. In my personal portfolio, I would choose:
- SPY 25%
- QQQ 25%
- IWM 30%
- EFA 20%
There is no “correct” blend, as it is impossible to know which class will perform the best moving forward, particularly over long periods of time. Part of the above also contemplates some of the overlap between QQQ and SPY.
Once an asset class division is decided on, all that is left to do is to implement the Leveraged Anchor strategy on each asset. This is the biggest challenge in setting things up, as it is capital intensive. Assuming 3 contracts is the smallest size one can use (3 long calls, 3 long puts 5% out of the money, 1 long put at the money, and one short put), then current minimum amounts necessary to open a Leveraged Anchor strategy:
- SPY: $35,000
- QQQ: $30,000
- IWM: $20,000
- EFA: $7,500
These values are going to somewhat dictate how you divide your money among the different asset classes. For instance, it is virtually impossible, without very large sums of money, to get the splits I set out above. I could get close:
- SPY: $35,000 25.6%
- QQQ: $40,000 29.2%
- IWM: $46,667 34.14%
- EFA: $15,000 10.9%
But to implement the above, I would need almost $140,000. The minimum I would need to implement any version of a diversified Anchor is still over $90,000.
I would advise any client that is interested in Anchor, and who has over $100,000 to invest, that diversifying the strategy, should outperform, over long periods of time. In any given one- or two-year period, there will be outperformance by one class over the other. The goal of diversification is to reduce variability and risk, while increasing returns, over long periods.
In the near future, we will begin listing out Leveraged Anchor trades for the different asset classes. Members are free to stick with SPY or come up with their own diversification blend. As always, if you would like to open a managed account, and have Lorintine Capital manage a diversified Anchor portfolio for you, we would be happy to discuss the matter.
Christopher Welsh is a licensed investment advisor and president of LorintineCapital, LP. He provides investment advice to clients all over the United States and around the world. Christopher has been in financial services since 2008 and is a CERTIFIED FINANCIAL PLANNER™. Working with a CFP® professional represents the highest standard of financial planning advice. Christopher has a J.D. from the SMU Dedman School of Law, a Bachelor of Science in Computer Science, and a Bachelor of Science in Economics. Christopher is a regular contributor to the Steady Options Anchor Trades and Lorintine CapitalBlog.
Related articles:
- Anchor Trades Portfolio Launched
- Defining The Anchor Strategy
- Market Thoughts And Anchor Update
- Leveraged Anchor Is Boosting Performance
- Anchor Trades Strategy Performance
- Revisiting Anchor (Thanks To ORATS Wheel)
- Revisiting Anchor Part 2
- Leveraged Anchor Update
- Leveraged Anchor Implementation
- Leveraged Anchor: A Three Month Review
- Anchor Maximum Drawdown Analysis
- Why Doesn't Anchor Roll The Long Calls?




There are no comments to display.
Join the conversation
You can post now and register later. If you have an account, sign in now to post with your account.
Note: Your post will require moderator approval before it will be visible.