Search the Community
Showing results for tags 'performance'.
-
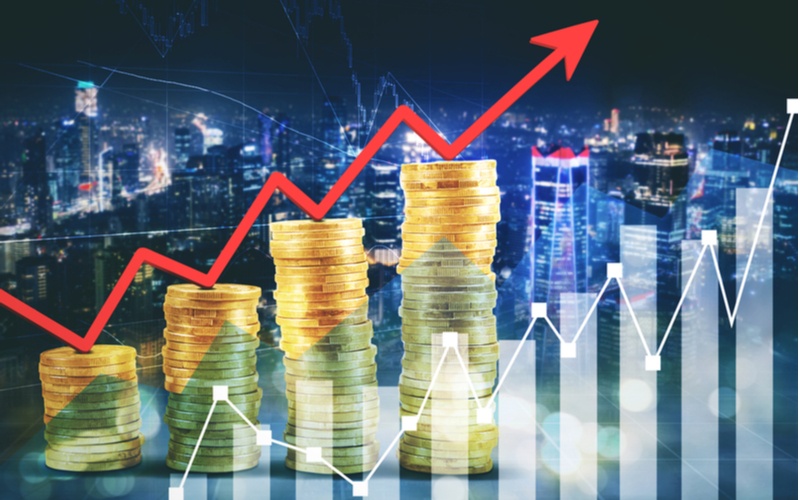 Performance Dissected Check out the Performance page to see the full results. Please note that those results are based on real fills, not hypothetical performance, and exclude commissions, so your actual results will be lower, depending on the broker and number of trades. Please read 2022 Year End Performance by Trade Type for full analysis of our 2021 performance. We have extensive discussions about brokers and commissions on the Forum (like this one) and help members to select the best broker. Please refer to How We Calculate Returns? for more details. The 90% annual return was below our long term average, but note that we didn’t use calendar trades this year due to the volatile market climate – and calendars have historically always been our highest average gain per trade. Going with mostly lower risk, short-term long straddles and tight long strangles kept us away from trades with bigger losses, but also kept us away from trades with larger gains. While the markets were down 20-30%+ (their worst year since 2008), we consider a 90% return pretty good. After 11 years in business, SteadyOptions maintains its position as the most stable and consistent options trading service, with 123.2% Compounded Annual Growth Rate. We proved again that we can make money in any market. As one of our members mentioned: "I would rate the 3% profit for March 2020 as even MORE successful than the 25% profits for Jan/Feb. If someone can make a profit in a month when there was total carnage in the markets, then that shows resilience and security in the trading strategies. It shows that even during a black swan event, the system works, and the account will not be blown." Our strategies SteadyOptions uses a mix of non-directional strategies: earnings plays, Long Straddle, Long Strangle, Calendar Spread, Bitterly, Iron Condor, etc. We constantly adding new strategies to our arsenal, based on different market conditions. SO model portfolio is not designed for speculative trades although we might do some in the speculative forum. SO is not a get-rich-quick-without-efforts kind of newsletter. I'm a big fan of the "slow and steady" approach. We aim for many singles instead of a few homeruns. My first goal is capital preservation instead of doubling your account. Think about the risk first. If you take care of the risk, the profits will come. What makes SO different? We use a total portfolio approach for performance reporting. This approach reflects the growth of the entire account, not just what was at risk. We balance the portfolio in terms of options Greeks. SteadyOptions provides a complete portfolio solution. We trade a variety of non-directional strategies balancing each other. You can allocate 60-70% of your options account to our strategies and still sleep well at night. In 2022 we use around 30% of our capital on average, with the rest in cash. 90% return that we reported was on the whole portfolio - if we reported return on invested capital (like other services do), we would be reporting over 300% return. Our performance is based on real fills. Each trade alert comes with a screenshot of our broker fills. We put our money where our mouth is. Our performance reporting is completely transparent. All trades are listed on the performance page, with the exact entry/exit dates and P/L percentage. It is not a coincidence that SteadyOptions is ranked #1 out of 723 Newsletters on Investimonials, a financial product review site. The reviewers especially mention our honesty and transparency, and also tremendous value of our trading community. We place a lot of emphasis on options education. There is a dedicated forum where every trade is discussed before the trade is placed. We discuss different strategies and potential trades. Unlike most other services that just send the trade alerts, our members understand the rationale behind the trades and not just blindly follow the alerts. SO actually helps members to become better traders. Other services In addition to SteadyOptions, we offer the following services: Anchor Trades - Stocks/ETFs hedged with options for conservative long term investors. Steady PutWrite - puts writing on equity indexes and ETF’s. Simple Spreads - simple spread strategies like diagonals and verticals. SteadyVol - Volatility based trades. We offer all services bundle at $2,495 per year. This represents up to 63% discount compared to individual services rates and you will be grandfathered at this rate as long as you keep your subscription active. Details on the subscription page. More bundles are available - click here for details. Subscribing to all services provides excellent diversification since those services have low correlation, and you also get the ONE software for free for 12 months with the yearly bundle. We also offer Managed Accounts for Anchor Trades and Steady PutWrite. Summary 2022 was another excellent year for our members. We are very pleased with our performance. SteadyOptions is now 11 years old. We’ve come a long way since we started. We are now recognized as: #1 Ranked Newsletter on Investimonials Top Rated Newsletter on Stockgumshoe Top 10 Option Trading Blogs by Options Trading IQ Top 4 Options Newsletters by Benzinga Top 40 Options Trading Blogs by Feedspot Top 15 Trading Forums by Feedspot Top 20 Trading Forums by Robust Trader Best Options Trading Blogs by Expertido Top Traders and People in Finance to Follow on Twitter Top Trading Blogs To Follow by Eztoolset Top Twitter Accounts to Follow by Options Trading IQ I see the community as the best part of our service. I believe we have the best and most engaged options trading community in the world. We now have members from over 50 counties. Our members posted over 125,000 posts in the last 9 years. Those facts show you the tremendous added value of our trading community. I want to thank each of you who’ve joined us and supported us. We continue to strive to be the best community of options traders and continuously improve and enhance our services. Let me finish with my favorite quote from Michael Covel: "Profits come in bunches. The trick when going sideways between home runs is not to lose too much in between." If you are not a member and interested to join, you can click here to join our winning team. When you join SteadyOptions, we will share with you all we know about options. We will never try to sell you any additional "proprietary systems", training, webinars etc. All our "secrets" are included in your monthly fee. Happy Trading from SO team!
 -
 Performance Dissected Check out the Performance page to see the full results. Please note that those results are based on real fills, not hypothetical performance, and exclude commissions, so your actual results will be lower, depending on the broker and number of trades. Please read 2021 Year End Performance by Trade Type for full analysis of our 2021 performance. We have extensive discussions about brokers and commissions on the Forum (like this one) and help members to select the best broker. Please refer to How We Calculate Returns? for more details. After 10 years in business, SteadyOptions maintains its position as the most stable and consistent options trading service, with 126.6% Compounded Annual Growth Rate. We proved again that we can make money in any market. As one of our members mentioned: "I would rate the 3% profit for March 2020 as even MORE successful than the 25% profits for Jan/Feb. If someone can make a profit in a month when there was total carnage in the markets, then that shows resilience and security in the trading strategies. It shows that even during a black swan event, the system works, and the account will not be blown." Our strategies SteadyOptions uses a mix of non-directional strategies: earnings plays, Straddles, Calendar Spreads, Butterflies, Iron Condors, etc. We constantly adding new strategies to our arsenal, based on different market conditions. SO model portfolio is not designed for speculative trades although we might do some in the speculative forum. SO is not a get-rich-quick-without-efforts kind of newsletter. I'm a big fan of the "slow and steady" approach. I aim for many singles instead of few homeruns. My first goal is capital preservation instead of doubling your account. Think about the risk first. If you take care of the risk, the profits will come. What's New? We added a new contributor to our official trades. We introduced few opportunistic trades using a variation of a diagonal spread. We introduced directional butterflies and verticals strategies. We also introduced a new service Simple Spreads to our offerings. What makes SO different? We use a total portfolio approach for performance reporting. This approach reflects the growth of the entire account, not just what was at risk. We balance the portfolio in terms of options Greeks. SteadyOptions provides a complete portfolio solution. We trade a variety of non-directional strategies balancing each other. You can allocate 60-70% of your options account to our strategies and still sleep well at night. Our performance is based on real fills. Each trade alert comes with screenshot of our broker fills. We put our money where our mouth is. Our performance reporting is completely transparent. All trades are listed on the performance page, with the exact entry/exit dates and P/L percentage. It is not a coincidence that SteadyOptions is ranked #1 out of 723 Newsletters on Investimonials, a financial product review site. The reviewers especially mention our honesty and transparency, and also tremendous value of our trading community. We place a lot of emphasis on options education. There is a dedicated forum where every trade is discussed before the trade is placed. We discuss different strategies and potential trades. Unlike most other services that just send the trade alerts, our members understand the rationale behind the trades and not just blindly follow the alerts. SO actually helps members to become better traders. Other services In addition to SteadyOptions, we offer the following services: Anchor Trades - Stocks/ETFs hedged with options for conservative long term investors. Anchor Trades produced 35.9% gain in 2021, beating its benchmark by 9.0%. Steady PutWrite - puts writing on equity indexes and ETF’s. Steady PutWrite produced 14.2% gain in 2021. NEW: Simple Spreads - simple spread strategies like diagonals and verticals. Simple Spreads produced 0.4% return in 2021. Steady Futures - a systematic trendfollowing strategy utilizing futures options. Steady Futures produced 21.0 gain in 2021. We offer a 5 products bundle (SteadyOptions, Steady Momentum PutWrite, Anchor Trades and Steady Futures) for $745 per quarter or $2,495 per year. This represents up to 57% discount compared to individual services rates and you will be grandfathered at this rate as long as you keep your subscription active. Details on the subscription page. More bundles are available - click here for details. Subscribing to all services provides excellent diversification since those services have low correlation, and you also get the ONE software for free for 12 months with the yearly bundle. We also offer Managed Accounts for Anchor Trades and Steady PutWrite. Summary 2021 was another excellent year for our members. We are very pleased with our performance. SteadyOptions is now 10 years old. We’ve come a long way since we started. We are now recognized as: #1 Ranked Newsletter on Investimonials Top Rated Newsletter on Stockgumshoe Top 10 Option Trading Blogs by Options Trading IQ Top 4 Options Newsletters by Benzinga Top 40 Options Trading Blogs by Feedspot Top 15 Trading Forums by Feedspot Top 20 Trading Forums by Robust Trader Best Options Trading Blogs by Expertido Top Traders and People in Finance to Follow on Twitter Top Trading Blogs To Follow by Eztoolset Top Twitter Accounts to Follow by Options Trading IQ I see the community as the best part of our service. I believe we have the best and most engaged options trading community in the world. We now have members from over 50 counties. Our members posted over 125,000 posts in the last 9 years. Those facts show you the tremendous added value of our trading community. I want to thank each of you who’ve joined us and supported us. We continue to strive to be the best community of options traders and continuously improve and enhance our services. Let me finish with my favorite quote from Michael Covel: "Profits come in bunches. The trick when going sideways between home runs is not to lose too much in between." If you are not a member and interested to join, you can click here to join our winning team. When you join SteadyOptions, we will share with you all we know about options. We will never try to sell you any additional "proprietary systems", training, webinars etc. All our "secrets" are included in your monthly fee. Happy Trading from SO team!
 -
Happy to join this cool forum! I’m fairly new to options. My account is with Interactive Brokers, and I've played around with their options trading interface on their main portal (account portal). Do I need to subscribe to their trading platform, or can I use the simpler interface? I’m also trying to sort out in my head two parts of the SteadyOptions experience: the strong advice here to get involved in my trading and monitor my positions throughout the day, and the published historical performance data, which I understand is a reflection of all of the past trade notifications. If I were to try to strictly abide by the trade notifications when they arrive in my inbox, am I correct that the challenge in “duplicating” the trade notifications has to do with possible glitches (partial fills, price movement, other execution issues) which require my attention? Or is there more to this? And once a trade is filled, do I still need to monitor it closely? I’ve got a pretty busy life and there will be times when I can’t monitor my email, or my trades. Thanks Branch
-
 Well, every trade should be put in context. Before evaluating a trade (or an options strategy), the following questions should be asked and answered: What is the holding period of the strategy? What is the maximum risk? What is the profit potential? What is the average return? What is the winning ratio? Why holding period is important? Well, making 5% in one week is not the same as making 5% in six months. In the first case we are talking about 250% annualized return. In the second case, 10%. See the difference. Maximum risk is important because it doesn't make sense to aim for 5% gain if your strategy can lose 50-100%. For example, when you are trading a directional strategy, and the stock gaps against you, the losses can be catastrophic. Since the risk is high, you should aim for higher return to compensate for the risk. However, if your maximum risk is limited, you can aim for lower return and still get excellent overall performance. Lets examine our pre-earnings straddles as an example. As a reminder, a long straddle option strategy is vega positive, gamma positive and theta negative trade. It works based on the premise that both call and put options have unlimited profit potential but limited loss. Straddles are a good strategy to pursue if you believe that a stock's price will move significantly, but unsure as to which direction. Another case is if you believe that Implied Volatility of the options will increase - for example, before a significant event like earnings. I explained the latter strategy in my Seeking Alpha article Exploiting Earnings Associated Rising Volatility. IV usually increases sharply a few days before earnings, and the increase should compensate for the negative theta. If the stock moves before earnings, the position can be sold for a profit or rolled to new strikes. This is one of my favorite strategies that we use in our SteadyOptions model portfolio. This is how the P/L chart looks like: How We Trade Straddle Option Strategy provides a full explanation of the strategy. Lets take a look at 2022 statistics for this strategy: Number of trades: 148 Number of winners: 103 Number of losers: 40 Winning ratio: 72.5% Average return per trade: 4.9% Average return per winning trade: 8.7% Average return per losing trade: -10.2% Average holding period: 7.2 days Lets do a quick math. If you can do 10 trades per month, each trade producing 5% gain on average and 10% allocation per trade, your monthly return is 5% on the whole portfolio. That's 60% non compounded annual return, with minimal risk. To answer the original question: for a strategy that has 70%+ winning ratio and loses on average 10% on losing trades, with average holding period of one week, 5% is an EXCELLENT return. In fact, I would consider it as Close to the Holy Grail as You Can Get. Related Articles: How We Trade Straddle Option Strategy Buying Premium Prior to Earnings Can We Profit From Volatility Expansion into Earnings Long Straddle: A Guaranteed Win? Why We Sell Our Straddles Before Earnings
 -
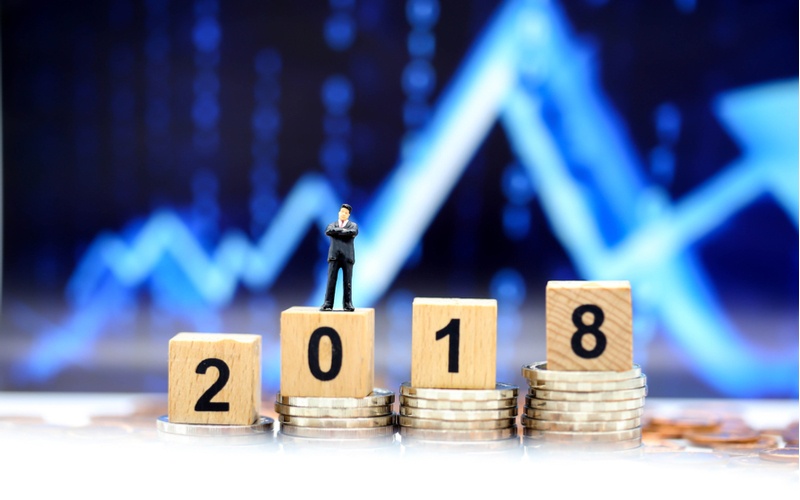
 AGGREGATE vs. ROI When you start looking at the different ways in which trading results are analysed, you’ll notice that they fall into two broad categories, Aggregate Analysis and Return on Investment analysis. Most investment services use versions of Aggregate Analysis which is a slippery slope into results that are at best misleading, at worst, deceptive. Let’s say, for example, that a service did one trade in the month. They make 10% on that trade. According to Aggregate Analysis, they would then claim that they had made 10% for the month. But did they? In another instance a service does 4 trades for the month, averaging 10%. They claim, according to Aggregate Analysis, that they made 10% for the month. Really? And probably the most common example is when they’re calculating yearly returns. Say they did 20 trades for the year and the sum of all those trades (that is, the return for each trade added together) was 100%. Their claim, according to Aggregate Analysis, was that they made 100% return for the year. How most services report returns So all Aggregate Analysis does (and this is where its name comes from) is add the results of the individual trades together. And you can understand why a service would do that – it’s not only simple but, most importantly, it shows off their performance in the best possible light. Hey, if you could do one trade and make 10% a month, why wouldn't you subscribe? Because you haven’t actually made 10%, that’s why. Not in the way that most people would think about trading or investment returns. 10% return assumes that you allocated your whole account to that single trade - which of course is insane. Let’s assume you have a bank of $10,000 and you’re risking 5% per trade because you’re trading options and options are risky. So that’s $500 maximum per trade. The trade makes 10% which is $50, so you’re out for $550. What return did you make for the month? $50 / $10,000 = 0.5% No, you did not make $1,000, as the 10% return suggested you would. You only made 0.5% because, normally, returns are calculated based on the total investment. And your total investment wasn't just the $500 you put at stake for that particular trade, it was the entire $10,000 you have in your trading account, because while it’s sitting there in your trading account it isn't doing anything else. You can’t have it invested elsewhere earning money for you – it has to be in your trading account so you can practice proper money management and risk allocation. How SteadyOptions reports returns? We will always report our returns based on the whole account. The performance of the model portfolio reflects the growth of the entire account including the cash balance. Some services consider a $500 gain on a $1,000 investment to be a 50% return when the whole account is worth $10,000. We consider this to be a 5% return — and that is the honest way of doing the calculations. We also always report performance based on the same allocation. Imagine a service making 3 trades per month and making 10% per trade. They would report 10% return. That means allocating 33% per trade. But wait - what if you need to adjust the trade? You absolutely need to keep at least 20% in cash for adjustments, so your real return is 8.0%. To add insult to injury, if they make only 2 trades in a certain month, they would still report 10% return. That means allocating 50% per trade. But how could you do that if you usually make 3 trades? Our Model portfolio is based on starting value of $10,000, compounded monthly and reset every year. We start with $10,000 each year and compound as the year progresses. Initial full position is $1,000 (10% of the portfolio) and half position is $500 (5% of the portfolio). The allocation for each individual trade is based on 10% of the current value of the performance tracking portfolio (5% for half allocation trades). This means that a 10% allocation when the portfolio is at 10K is smaller than a 10% allocation as the portfolio value increases. For example, a trade closed at the end of 2018 when the portfolio was around 20K had a 10% allocation of around $2000. This is simply following the standard for the performance reporting. Therefore, the dollar gain/loss for each trade in the performance tracking will likely be different from the dollar gain/loss of the official trade. This is because of both the 10% allocation size for the performance tracking changing as the portfolio value increases and also because option trades cannot be allocated at an exact dollar amount. For example: FB trade on 12/28/17 (last trade of 2017) produced 40% gain. If we make 40% on $500 it is $200. But we base the positions on the new portfolio value at the end of each month (23,551 at the end of November 2017) so full position is $2,355 and half position is $1,177. 40% of $1,177=$471, so the portfolio increased from 26,014 to 26,485. This is what compounding means. There might be a slight difference in reported performance and actual performance for the 10k portfolio due to the fact that we cannot buy partial contracts. For example, if we make 10% on a trade, we will always report $100 gain (10% on $1,000 trade), adjusted for compounding. For trades requiring $800 margin the actual gain on $10k portfolio is $80, and for trades requiring $1,200 margin the actual gain is $120, but we will always report $100 gain. There are a lot of other dirty tricks that some services use to push up their numbers. It might include reporting based on "maximum profit potential", calculating gains based on cash and not on margin etc. You can read my article Performance Reporting - The Myths And The Reality for full details. Still skeptical? Why not to join us and see by yourself how we are different from other services. Please refer to Frequently Asked Questions for more details about us. If you liked this article, visit our Options Trading Blog for more educational articles about options trading. Related Articles: Why Retail Investors Lose Money In The Stock Market How To Calculate ROI On Credit Spreads Are You Ready For The Learning Curve? Can you double your account every six months? Performance Reporting: The Myths and The Reality Are You EMOTIONALLY Ready To Lose? Subscribe to SteadyOptions now and experience the full power of options trading at your fingertips. Click the button below to get started! Join SteadyOptions Now!
 -
 The graph below highlights the fact that while less than 2% of assets were negative in 2017, 90% of assets are negative YTD in 2018 -- they highest percentage since... ever. 2018 was a unique year in many areas. For example, 2018 was the only positive year for VXX since inception. On Monday, February 5, the Dow Jones Industrial Average declined by 1,175 points — its largest point drop in one day ever. VIX more than doubled in a single day — for the first time ever. The VelocityShares Daily Inverse VIX Short-Term exchange-traded note (XIV), a product issued by Credit Suisse, and the ProShares Short VIX Short-Term Futures exchange-traded fund (SVXY), both plunged by 80 percent in the hours after the VIX’s spike. Those unprecedented events caused many funds to blow up their clients accounts. We covered the The Spectacular Fall Of LJM Preservation And Growth and James Cordier: Another Options Selling Firm Goes Bust, among others. Many investors also learned in 2018 that “Blue Chip” is a marketing term. Owning these stocks will not shield you from losses. For example, IBM’s share price finished 25.6% lower in 2018, and it is one of many blue chip stocks that were punished by the market in 2018. Some of the previous market darlings have been also punished hard in 2018. Facebook ended the year 25 percent down for 2018, and Apple was down 7 percent. There was virtually no place to hide in 2018. As Charlie Bilello mentions, in 2018, more than any year in recent history, the overwhelming majority of asset classes are down. In the table below of 15 asset classes ranging from stocks to bonds to REITs to Gold and Commodities, only one is higher: Cash. If you maintain a globally diversified portfolio, this has likely been the worst year for you since 2008, with a 60/40 portfolio (AOR ETF) down just over 6%. During periods like 2018, many traders started to realize that incorporating options strategies into their portfolios might be not a bad idea. Here is how our strategies performed in 2018: Steady Options: This is our flagship service, trading variety of non directional strategies like Straddles, Iron Condors, Calendar Spreads, Butterflies, etc. The service produced 129.5% gain in 2018, proving once again that those strategies can make money in any market if implemented correctly. The model portfolio produced 17.3% return in December 2018 while most major indexes were down double digits. Anchor Trades: An Anchor trades goal is to protect long portfolios and to prevent loss of capital while still generating a positive return in all market conditions. It produced 5.4% loss in 2018, slightly outperforming the S&P 500. If the correction continues, the outperformance should continue, and the hedge should start to kick in. We will be implementing more changes in 2019 to improve the strategy performance in all market conditions. Steady Condors: This is a variation of Steady Condor strategy managed by the Greeks. It produced 12.9% loss in 2018, mainly driven by two huge corrections in February and October. While it is not pleasant to lose money, it is near impossible to make money with gamma negative vega negative strategy when the indexes move 3-4 SD in a matter of days and volatility doubles. Considering the market conditions, the strategy managed to keep the overall loss under control. Creating Alpha: The service has two model portfolios, trading mostly VXX and TLT. The strategy produced 13.0% gain in 2018. Considering that it was short volatility during a year when VXX almost doubled and some short volatility fund blew up their accounts, we consider it a remarkable result. The Incredible Winning Trade In SVXY provides some insights on how we trade the strategy. When volatility stabilizes, the strategy should produce much better results. 2018 was a wake-up call for a whole new generation of investors who entered the stock market after 2009 and watched their long portfolios going up year after year. As we have seen, the markets can go down as well. And when they do, you are better to be prepared. This might be just the beginning. Related articles: SteadyOptions 2018 - Year In Review The Spectacular Fall Of LJM Preservation And Growth James Cordier: Another Options Selling Firm Goes Bust The Astonishing Story Behind XIV Debacle The Lessons From The XIV Collapse The Incredible Winning Trade In SVXY
 -
 I would like to share some of the thoughts expressed in the article and add my own perspective. Honesty and Transparency Above All Dan writes: "As we wrapped up the month of April, the sample account took another loss. Once again, due to RUT. When you take two monthly losses in a row with a high probability trading system, it stings a bit. My goal is always to accurately represent what I’m doing and not pretend to be some guru with a 100% win rate or who conveniently fails to disclose trading results. I firmly believe in honesty and transparency rather than deception or what you’re hoping to hear." SteadyOptions took three monthly losses in a row, also with a high probability trading system. Yes, it stings. But do you really believe that anyone is able to trade without losses? Whoever claims to not having any losses simply fails to accurately report his performance. Our results are fully documented, every single trade is on the performance page, winners and losers. Similar to Dan, I believe in full transparency. For a trading strategy that produced triple digit returns 5 years in a row, 3 losing months in a row is statistically expected at some point. Dan continues: "Armchair traders will say that we should change our strategy or not have been trading the strategy, but changing strategies every time we lose means we effectively have no strategy. Additionally, knowing when a strategy will work or won’t work is 100% impossible unless you’re Goldman Sachs, the Fed (arguably the same as GS), or a high frequency trading firm. Wise words. Probability Is Not Certainty One of the reasons to our performance this year was a new strategy (RIC - Reverse Iron Condor) we introduced and described in Lessons From Q1 2016 Earnings Season article. It was those 4-5 losers that contributed the most to the negative performance. We discussed why this happened in the article and in more details on the forum. This is a high probability strategy - however, probability doesn't mean certainty. Sometimes even high probability strategies produce few losers in a row. The RIC strategy bets on big post-earnings moves which happen 90% of the time for some stocks. To put things in perspective, NFLX, GOOG and LNKD produced some of the smallest post-earnings moves in history. What are the odds? Dan mentions that the start of 2016 has been challenging for many, if not most or all, non-directional options traders. We experienced it with our butterfly strategy. After booking 7 winners in a row, our last two trades became big losers due to wild market moves in February-March. Again, those are strategies that we have been using with great success, but no strategy wins 100% of the time. Those two big losers along with few big RIC losers impacted the most our 2016 performance. Rest of the strategies actually performed pretty well. How could the Fidelity Magellan fund make 29% per year from 1977-1990 while the average investor in the fund lost money? It's because investors always visualize the path to look like "your plan" and when it's not, the powerful impulse of fear and greed wins out (causing inflows around tops and outflows around bottoms). After a string of losses, what's next? SteadyOptions produced outstanding returns in the previous 4+ years. To put things in perspective, consider this: if you started investing in the stock market in 2007 based on historical returns of ~10%/year, then watched your money losing half of its value, would you quit? Some people would. Those who didn't, watched their money triple in the following 7 years. If you quit each time few losing months happen, you will just become part of DALBAR statistics. Losses are part of the game, and if you can not endure losses, you should not be trading. I would strongly advise not to think in terms of "how and when to recover". Just continue executing your trading plan if you believe it still has an edge, and the results will come. This is exactly what we intend to do. Focus on following your trading plan not the short term results of it. Robust strategies are profitable in the long term time frame. “It is critical to understand human nature if you want to succeed at investing. I’ve seen this time and time again. I’ve had investors who have been with me for years, getting great performance, and then suddenly we have a bad year or a bad couple of years, which we’ve told them about ahead of time, right, because we can always show them that nothing works all the time, and they still bail. Basing their decisions on short-term results is in fact the biggest mistake investors make.” - Jim O’Shaughnessy Start Your Free Trial Related Articles: Are You EMOTIONALLY Ready To Lose? Why Retail Investors Lose Money In The Stock Market Are You Ready For The Learning Curve? Can you double your account every six months? Performance Reporting: The Myths and The Reality Lessons From Q1 2016 Earnings Season
 -
.jpg.bac6099e6569572174ab253b90cbf12d.jpg) I was speaking to one trader the other day who had a $20,000 win with his first trade. I explained that this was almost the worst thing that could happen, because he started thinking “this is easy” and “if I can make this much when I don’t know anything, imagine what I can do when I get some more experience.” Sure enough, this trader blew up his account not long after. He was taking on too much risk without knowing how to handle it. For new traders, it is much better to start with a small account size. Even if you have $200,000 available for trading options, just start with $10,000 and get a feel for how things work. Then, when you’ve been trading for a year or so, SLOWLY build your account from there. You don’t want to jump from $10,000 to $200,000 overnight. The psychological aspect of trading a $200k account is much different to a $10k account. All of a sudden a 1% loss has gone from $100 to $2,000. So, the big question is how much do you need to get started trading options? I believe there is no real minimum. You can start trading with $200. The experience you gain will be with you for a lifetime, so the earlier you get started the better. That being said, there are certain strategies that will not be available to you with only a small amount of capital. Iron condors for example will be hard to trade with less than $5,000. Also, you need to keep in mind that commissions and fees are going to have a much larger impact on a small account. Ideally, you want to have around $5,000 to $10,000 at a minimum to start trading options.Call Course HOW TO TRADE OPTIONS FULL-TIME To become a full-time options trading requires a big commitment both financially and mentally. As the old saying goes, “It’s the hardest way there is to make easy money”. Trading is hard, there will be good times and bad times. Will you be able to handle the emotional upheaval the bad times can cause? The first step to figuring out if you can go full-time, is to figure out how much you need to live off. If you want to make it as a trader, you need to be prepared to live pretty frugally. We’ve all seen the images of hot shot traders driving Ferraris, but that’s not the reality for 99% of traders out there. Most full-time traders I know live very frugally. First things first, you should audit your spending behaviour and see if there is anywhere you can cut back without sacrificing your lifestyle. The next step is to build a track record over a few years and figure out what sort of return you can expect on a consistent basis. It would be good to have this track record through a variety of different market conditions. There are a lot of “bull market geniuses” out there right now, but how will they fare during the next bear market? Let’s say you’re pretty confident that you can achieve 15% per year. If you can live off $50,000, then you need a capital balance of $333,333.33. If your results indicate you can only achieve a 10% return then you need $500,000 but if you can achieve a 20% return then you only need $250,000. You can see there is a massive variation in the amount of capital needed depending on your returns. The best bet is to build that track record and figure out what sort of return YOU can achieve. Every trader is different after all. Also note, that I haven’t met many traders consistently earning over 20% per year (despite what all those internet ads tell you), and I’ve met A LOT of traders in the last 15 years. Your Options Trading DEALING WITH LOSING MONTHS Losing months are never fun for any trader, but they are a double whammy for full-time traders. Not only has your account balance gone down, you’ve also had to withdraw funds to live off. So your account has taken a double hit, and now you need an above average return next month. Can you handle that kind of stress? Having a minimum account size that you’re aiming for is a great idea, but it might be worth waiting until your balance is a little higher than you think you need in order to safely handle those losing months. Some traders will have 12 months’ worth of expenses set aside (outside their trading account) before making the jump to full-time. Trading is a tough game, and if you’ve got the added pressure of needing to make a certain return to put food on the table only adds to that stress. Having some emergency funds put aside can help you focus on the business of trading. ADDITIONAL EXPENSES One thing a lot of people don’t consider is the additional expenses that can be incurred as a trader. Does your current employer cover your health insurance? Do they pay for your smartphone? Do they provide you with a fast computer? A gym membership? All these things and more will be your responsibility going forward. If your computer breaks and you don’t know how to fix it, you need to pay a computer guy to fix it for you. Previously your employer would take care of all of this. Same goes for your phone etc. Be prepared for some additional expenses when you work for yourself. CONCLUSION Hopefully I haven’t stressed you out too much, but the reality is, you need a significant amount of capital before even thinking about becoming a full-time trader. Those of you who have $50,000 and think you can go full-time, I’m sorry but it’s just not going to happen. Unless you’re a single guy who can live the backpacker lifestyle in Thailand. But, trading is one of the most rewarding jobs there is. No boss, work from home, travel, the list goes on. Stick at it, take it step by step and slowly build your account, and you will get there. Gavin McMaster has a Masters in Applied Finance and Investment. He specializes in income trading using options, is very conservative in his style and believes patience in waiting for the best setups is the key to successful trading. He likes to focus on short volatility strategies. Gavin has written 5 books on options trading, 3 of which were bestsellers. He launched Options Trading IQ in 2010 to teach people how to trade options and eliminate all the Bullsh*t that’s out there. You can follow Gavin on Twitter.
I was speaking to one trader the other day who had a $20,000 win with his first trade. I explained that this was almost the worst thing that could happen, because he started thinking “this is easy” and “if I can make this much when I don’t know anything, imagine what I can do when I get some more experience.” Sure enough, this trader blew up his account not long after. He was taking on too much risk without knowing how to handle it. For new traders, it is much better to start with a small account size. Even if you have $200,000 available for trading options, just start with $10,000 and get a feel for how things work. Then, when you’ve been trading for a year or so, SLOWLY build your account from there. You don’t want to jump from $10,000 to $200,000 overnight. The psychological aspect of trading a $200k account is much different to a $10k account. All of a sudden a 1% loss has gone from $100 to $2,000. So, the big question is how much do you need to get started trading options? I believe there is no real minimum. You can start trading with $200. The experience you gain will be with you for a lifetime, so the earlier you get started the better. That being said, there are certain strategies that will not be available to you with only a small amount of capital. Iron condors for example will be hard to trade with less than $5,000. Also, you need to keep in mind that commissions and fees are going to have a much larger impact on a small account. Ideally, you want to have around $5,000 to $10,000 at a minimum to start trading options.Call Course HOW TO TRADE OPTIONS FULL-TIME To become a full-time options trading requires a big commitment both financially and mentally. As the old saying goes, “It’s the hardest way there is to make easy money”. Trading is hard, there will be good times and bad times. Will you be able to handle the emotional upheaval the bad times can cause? The first step to figuring out if you can go full-time, is to figure out how much you need to live off. If you want to make it as a trader, you need to be prepared to live pretty frugally. We’ve all seen the images of hot shot traders driving Ferraris, but that’s not the reality for 99% of traders out there. Most full-time traders I know live very frugally. First things first, you should audit your spending behaviour and see if there is anywhere you can cut back without sacrificing your lifestyle. The next step is to build a track record over a few years and figure out what sort of return you can expect on a consistent basis. It would be good to have this track record through a variety of different market conditions. There are a lot of “bull market geniuses” out there right now, but how will they fare during the next bear market? Let’s say you’re pretty confident that you can achieve 15% per year. If you can live off $50,000, then you need a capital balance of $333,333.33. If your results indicate you can only achieve a 10% return then you need $500,000 but if you can achieve a 20% return then you only need $250,000. You can see there is a massive variation in the amount of capital needed depending on your returns. The best bet is to build that track record and figure out what sort of return YOU can achieve. Every trader is different after all. Also note, that I haven’t met many traders consistently earning over 20% per year (despite what all those internet ads tell you), and I’ve met A LOT of traders in the last 15 years. Your Options Trading DEALING WITH LOSING MONTHS Losing months are never fun for any trader, but they are a double whammy for full-time traders. Not only has your account balance gone down, you’ve also had to withdraw funds to live off. So your account has taken a double hit, and now you need an above average return next month. Can you handle that kind of stress? Having a minimum account size that you’re aiming for is a great idea, but it might be worth waiting until your balance is a little higher than you think you need in order to safely handle those losing months. Some traders will have 12 months’ worth of expenses set aside (outside their trading account) before making the jump to full-time. Trading is a tough game, and if you’ve got the added pressure of needing to make a certain return to put food on the table only adds to that stress. Having some emergency funds put aside can help you focus on the business of trading. ADDITIONAL EXPENSES One thing a lot of people don’t consider is the additional expenses that can be incurred as a trader. Does your current employer cover your health insurance? Do they pay for your smartphone? Do they provide you with a fast computer? A gym membership? All these things and more will be your responsibility going forward. If your computer breaks and you don’t know how to fix it, you need to pay a computer guy to fix it for you. Previously your employer would take care of all of this. Same goes for your phone etc. Be prepared for some additional expenses when you work for yourself. CONCLUSION Hopefully I haven’t stressed you out too much, but the reality is, you need a significant amount of capital before even thinking about becoming a full-time trader. Those of you who have $50,000 and think you can go full-time, I’m sorry but it’s just not going to happen. Unless you’re a single guy who can live the backpacker lifestyle in Thailand. But, trading is one of the most rewarding jobs there is. No boss, work from home, travel, the list goes on. Stick at it, take it step by step and slowly build your account, and you will get there. Gavin McMaster has a Masters in Applied Finance and Investment. He specializes in income trading using options, is very conservative in his style and believes patience in waiting for the best setups is the key to successful trading. He likes to focus on short volatility strategies. Gavin has written 5 books on options trading, 3 of which were bestsellers. He launched Options Trading IQ in 2010 to teach people how to trade options and eliminate all the Bullsh*t that’s out there. You can follow Gavin on Twitter. -
 The assumption is that with careful stock selection, this strategy has a very high probability of success. I performed extensive backtesting on number of stocks, and the results were very promising. Stocks like AMZN and LNKD showed average gains of 30-35%. However, I also mentioned that this strategy has higher risk than other strategies that we use since earnings are unpredictable. High Probability High Risk is the right definition of this strategy. Not a good start.. Our first trade was NFLX. The stock has been selected based on its historical moves. It moved 13.7% on average in the last 8 cycles. The options predicted 17% move. The RIC trade was structured in a way that it required only 8% post-earnings move. What are the odds that the stock will move only 0.13% post-earnings? Slim to none if you asked anyone before earnings. Yet this is exactly what happened. We had a chance to close the trade at small loss or with some luck, even a small gain. But with 3 days left to expiration, we decided to wait. The stock reversed, resulting a 46.9% loss. Not a good start. The next one was AMZN. This one actually worked not bad. It did not move as much as expected, but still moved enough to produce a 21.2% gain. The real disaster came with the next two trades, GOOG and TSLA. The stocks moved much less than expected, reversed after the initial move and the trades have lost 70.6% and 100% respectively. With better risk management, all three losers could be closed for a small loss or even a small gain. I posted a full post mortem here (members only forum). Some members with higher risk tolerance decided to hold longer and were able to book 30-40%+ gains on AMZN and GOOG. In some cases the difference between significant loss and decent gain was a pure luck. What went wrong? This strategy is based on probabilities. If a stock moves xxx% in the last 8 cycles, there is a high probability that it will follow the same pattern the next cycle. However, probability is not certainty. There is always a chance that this cycle will be different. What are the chances that ALL 4 stocks will not follow the last cycles pattern? Not high, but this is exactly what happened. This is why you always need to have plan B. You always need to know in advance what to do if the trade does not behave as expected. It's called an exit plan to cut the loss. Instead of trying to cut the loss (and give up some potential gains), we continued holding, "hoping" that the stock will eventually make a move consistent with its historical patterns. It just did not happen. It all comes to what kind of trader you want to be. Is your goal to limit the losses or to maximize the gains? You cannot have it both ways. Higher gains come with higher risk and inevitably will produce some big losers. My first priority has always been limiting the losses. This time I tried to go for higher gains instead of limiting the losses, and it fired back big time. To be fair, all four trades could easily produce 30-40% gains with some more luck and more favorable market conditions. Main lessons Look for a good setup. Even if a stock is a good candidate historically, the options might be too expensive this time, decreasing your chances. Get out quickly once it becomes clear that the stock did not produce the expected move and the trade is borderline. Most of the time it should be possible to limit the loss to 10-20%. This rule might miss some gains, but at least we won't have catastrophic losses like we had this cycle. Close the short options of the losing side early, especially if there is still couple days till expiration. This way if the stock reverses, the losing side will benefit more. The probabilities will eventually play out, but while they don't, do everything you can to stay in the game. Limiting losses is all that matters. Always follow the rules. Generally speaking, if you consider this (or any other) strategy too risky, reduce your allocation or don't trade it. In a broader context, I always recommend that new members start with paper trading, then start small and increase the allocation gradually. Prove yourself that you can make money with 10k account for few months, then increase it to 20k etc. Don't jump right away from 10k to 50k or 100k. What's next? I feel the pain as much as my members do since I trade the exact same trades in my personal account. This was a very expensive lesson for all of us. However, I believe each lesson should benefit us and make us better traders. After a losing streak, your first impulse might be to overtrade in attempt to recover the losses. HUGE MISTAKE. The market doesn't know that you have lost money. And it doesn't care. If you tell yourself "now I really need some nice winners to cover for the losses", it's a safe path to more losses. What separates good traders from bad is how you react to your losses. "There's a difference between knowing the path... and walking the path." - Morpheus. To paraphrase Morpheus sentence, "there's a difference between knowing that there will be losers... and actually experiencing them". In a probability game, it is guaranteed that we will eventually experience a string of losses. The right thing to do is continue to execute our trading plan that has worked so well for us in the last 4+ years. Summary It gets tough when we experience losses or poor performances and that's where most traders quit because in the first place they never accepted emotionally that they are playing a probability game. As soon as a few losing trades and/or a drawdown of any kind occurs they hit the eject button and continue in their search for the Holy Grail strategy that always wins. Jumping from one trading system to another will only lead to more frustration. Only when you will accept emotionally that you are playing a probability game, you will be able to take your trading to the next level. We present a variety of strategies to our members. Some are more risky than others. Members have different risk tolerance and should take the risk levels of different trades into consideration before trading. Before entering each one of those trades, I made a full disclosure that those are relatively risky trades, so members have all the information to make an educated decision. To put things in perspective, the current string of losers is our biggest losing streak since inception. I encourage current and prospective members to look at the big picture. The big picture is that SteadyOptions produced over 770% non-compounded ROI since inception. The big picture is our history of 800+ trades and not only the last 10 trades. One bad month does not erase 4+ years of exceptional gains. Losses are part of the game, and if you can not endure losses, you should not be trading. Your maximum drawdown is ahead of you, not behind you. We will continue executing our trading plan, and those who have the discipline and patience to stay the course will be greatly rewarded. Start Your Free Trial Related Articles: Are You EMOTIONALLY Ready To Lose? Why Retail Investors Lose Money In The Stock Market Are You Ready For The Learning Curve? Can you double your account every six months? Big Drawdowns Are Part Of The Game
 -
.jpg.960795b2f762930d90fb9521185ba21c.jpg) Performance Dissected Check out the Performance page to see the full results. Please note that those results are based on real fills, not hypothetical performance, and exclude commissions, so your actual results will be lower. Commissions reduce the monthly returns by approximately 1-2% per month, depending on the broker and number of trades. As with every trading system which uses multi leg trades, commissions will have a significant impact on performance, so it is very important to use a cheap broker. We have extensive discussions about brokers and commissions on the Forum (like this one) and help members to select the best broker. Commissions reduce the monthly returns by approximately 2% per month, depending on the broker. Please refer to How We Calculate Returns? for more details. 2017 was probably our most consistent and steady year. Our strategies SteadyOptions uses a mix of non-directional strategies: earnings plays, Iron Condors, Calendar spreads etc. We constantly adding new strategies to our arsenal, based on different market conditions. SO model portfolio is not designed for speculative trades although we might do some in the speculative forum. SO is not a get-rich-quick-without-efforts kind of newsletter. I'm a big fan of the "slow and steady" approach. I aim for many singles instead of few homeruns. My first goal is capital preservation instead of doubling your account. Think about the risk first. If you take care of the risk, the profits will come. Looking at specific strategies, pre-earnings calendars were our best performing strategy, producing 13.8% average return with 84% winning ratio. We will continue trading what works the best and adapt to the market conditions. What's New? We continue expanding the scope of our trades beyond the earnings trades, Iron Condors and calendars. We are now trading SPY, TLT, VIX, VXX and other ETFs to diversify the portfolio. We will continue refining those strategies to get even better results. This gives members a lot of choice and flexibility. We launched a PureVolatility portfolio that trades exclusively VIX based products. It is currently included as bonus in SteadyOptions subscription. We have implemented some improvements to the straddle strategy that reduces risk and enhances returns. We introduced a Mentoring Program where experienced members help newer members to get up to speed. The mentors provide guidance and answer questions on the forum. We introduced an "Unofficial Trades" forum where veteran members share their trading ideas that don't make it into the official portfolio for various reasons. There are dozens unofficial trading ideas every month. We started using the CMLviz Trade Machine to find and backtest some of our trades. This is an excellent tool that already produced few nice winners for us. What makes SO different? First, we use a total portfolio approach for performance reporting. This approach reflects the growth of the entire account, not just what was at risk. We balance the portfolio in terms of options Greeks. SteadyOptions provides a complete portfolio solution. We trade a variety of non-directional strategies balancing each other. You can allocate 60-70% of your options account to our strategies and still sleep well at night. Second, our performance is based on real fills. Each trade alert comes with screenshot of my broker fills. Many services base their performance on the "maximum profit potential" which is very misleading. Nobody can sell at the top and do it consistently. We put our money where our mouth is. Our performance reporting is completely transparent. All trades are listed on the performance page, with the exact entry/exit dates and P/L percentage. It is not a coincidence that SteadyOptions is ranked #1 out of 704 Newsletters on Investimonials, a financial product review site. Read all our reviews here. The reviewers especially mention our honesty and transparency, and also tremendous value of our trading community. We place a lot of emphasis on options education. There is a dedicated forum where every trade is discussed before the trade is placed. We discuss different strategies and potential trades. Unlike most other services that just send the trade alerts, our members understand the rationale behind the trades and not just blindly follow the alerts. SO actually helps members to become better traders. Other services In addition to SteadyOptions, we offer the following services: Anchor Trades - Stocks/ETFs hedged with options for conservative long term investors. Steady Condors - Hedged monthly income trades managed by the Greeks. LC Diversified Portfolio - broadly diversified, absolute return, multi-strategy portfolio. All services produced double digit returns in 2017. We now offer a 3 products bundle (SteadyOptions, Steady Condors and Anchor Trades) for $745 per quarter or $2,495 per year. This represents up to 40% discount compared to individual services rates and you will be grandfathered at this rate as long as you keep your subscription active. Details on the subscription page. Subscribing to all three services provides excellent diversification since those services have low correlation, and you also get the ONE software for free for 12 months with the yearly bundle. The LCD is our most diversified and scalable portfolio, I highly recommend that members check it out. It is offered as an added bonus of all subscription plans. We also offer Managed Accounts for Anchor Trades and LCD. Summary Overall it has been an excellent year for us. SteadyOptions is now 6 years old. We’ve come a long way since we started, but we still have a long ways to go. We are featured on Top 100 Options Blogs by commodityhq, Top 10 Option Trading Blogs by Options trading IQ, Top 40 Options Trading Blogs by feedspot and more. I see the community as the best part of our service. I believe we have the best and most engaged options trading community in the world. We now have members from over 50 counties. Our members posted over 4,400 topics and ~100,000 posts in the last 6 years. Those facts show you the tremendous added value of our trading community. I want to thank each of you who’ve joined us and supported us. We continue to strive to be the best community of options traders and continuously improve and enhance our services. Let me finish with my favorite quote from Michael Covel: "Profits come in bunches. The trick when going sideways between home runs is not to lose too much in between." Subscription is now open to new members for a limited time. If you are not a member and interested to join, you can click here to join our winning team. When you join SteadyOptions, we will share with you all we know about options. We will never try to sell you any additional "proprietary systems", training, webinars etc. All our "secrets" are included in your monthly fee. Happy Trading from SO team!
Performance Dissected Check out the Performance page to see the full results. Please note that those results are based on real fills, not hypothetical performance, and exclude commissions, so your actual results will be lower. Commissions reduce the monthly returns by approximately 1-2% per month, depending on the broker and number of trades. As with every trading system which uses multi leg trades, commissions will have a significant impact on performance, so it is very important to use a cheap broker. We have extensive discussions about brokers and commissions on the Forum (like this one) and help members to select the best broker. Commissions reduce the monthly returns by approximately 2% per month, depending on the broker. Please refer to How We Calculate Returns? for more details. 2017 was probably our most consistent and steady year. Our strategies SteadyOptions uses a mix of non-directional strategies: earnings plays, Iron Condors, Calendar spreads etc. We constantly adding new strategies to our arsenal, based on different market conditions. SO model portfolio is not designed for speculative trades although we might do some in the speculative forum. SO is not a get-rich-quick-without-efforts kind of newsletter. I'm a big fan of the "slow and steady" approach. I aim for many singles instead of few homeruns. My first goal is capital preservation instead of doubling your account. Think about the risk first. If you take care of the risk, the profits will come. Looking at specific strategies, pre-earnings calendars were our best performing strategy, producing 13.8% average return with 84% winning ratio. We will continue trading what works the best and adapt to the market conditions. What's New? We continue expanding the scope of our trades beyond the earnings trades, Iron Condors and calendars. We are now trading SPY, TLT, VIX, VXX and other ETFs to diversify the portfolio. We will continue refining those strategies to get even better results. This gives members a lot of choice and flexibility. We launched a PureVolatility portfolio that trades exclusively VIX based products. It is currently included as bonus in SteadyOptions subscription. We have implemented some improvements to the straddle strategy that reduces risk and enhances returns. We introduced a Mentoring Program where experienced members help newer members to get up to speed. The mentors provide guidance and answer questions on the forum. We introduced an "Unofficial Trades" forum where veteran members share their trading ideas that don't make it into the official portfolio for various reasons. There are dozens unofficial trading ideas every month. We started using the CMLviz Trade Machine to find and backtest some of our trades. This is an excellent tool that already produced few nice winners for us. What makes SO different? First, we use a total portfolio approach for performance reporting. This approach reflects the growth of the entire account, not just what was at risk. We balance the portfolio in terms of options Greeks. SteadyOptions provides a complete portfolio solution. We trade a variety of non-directional strategies balancing each other. You can allocate 60-70% of your options account to our strategies and still sleep well at night. Second, our performance is based on real fills. Each trade alert comes with screenshot of my broker fills. Many services base their performance on the "maximum profit potential" which is very misleading. Nobody can sell at the top and do it consistently. We put our money where our mouth is. Our performance reporting is completely transparent. All trades are listed on the performance page, with the exact entry/exit dates and P/L percentage. It is not a coincidence that SteadyOptions is ranked #1 out of 704 Newsletters on Investimonials, a financial product review site. Read all our reviews here. The reviewers especially mention our honesty and transparency, and also tremendous value of our trading community. We place a lot of emphasis on options education. There is a dedicated forum where every trade is discussed before the trade is placed. We discuss different strategies and potential trades. Unlike most other services that just send the trade alerts, our members understand the rationale behind the trades and not just blindly follow the alerts. SO actually helps members to become better traders. Other services In addition to SteadyOptions, we offer the following services: Anchor Trades - Stocks/ETFs hedged with options for conservative long term investors. Steady Condors - Hedged monthly income trades managed by the Greeks. LC Diversified Portfolio - broadly diversified, absolute return, multi-strategy portfolio. All services produced double digit returns in 2017. We now offer a 3 products bundle (SteadyOptions, Steady Condors and Anchor Trades) for $745 per quarter or $2,495 per year. This represents up to 40% discount compared to individual services rates and you will be grandfathered at this rate as long as you keep your subscription active. Details on the subscription page. Subscribing to all three services provides excellent diversification since those services have low correlation, and you also get the ONE software for free for 12 months with the yearly bundle. The LCD is our most diversified and scalable portfolio, I highly recommend that members check it out. It is offered as an added bonus of all subscription plans. We also offer Managed Accounts for Anchor Trades and LCD. Summary Overall it has been an excellent year for us. SteadyOptions is now 6 years old. We’ve come a long way since we started, but we still have a long ways to go. We are featured on Top 100 Options Blogs by commodityhq, Top 10 Option Trading Blogs by Options trading IQ, Top 40 Options Trading Blogs by feedspot and more. I see the community as the best part of our service. I believe we have the best and most engaged options trading community in the world. We now have members from over 50 counties. Our members posted over 4,400 topics and ~100,000 posts in the last 6 years. Those facts show you the tremendous added value of our trading community. I want to thank each of you who’ve joined us and supported us. We continue to strive to be the best community of options traders and continuously improve and enhance our services. Let me finish with my favorite quote from Michael Covel: "Profits come in bunches. The trick when going sideways between home runs is not to lose too much in between." Subscription is now open to new members for a limited time. If you are not a member and interested to join, you can click here to join our winning team. When you join SteadyOptions, we will share with you all we know about options. We will never try to sell you any additional "proprietary systems", training, webinars etc. All our "secrets" are included in your monthly fee. Happy Trading from SO team! -
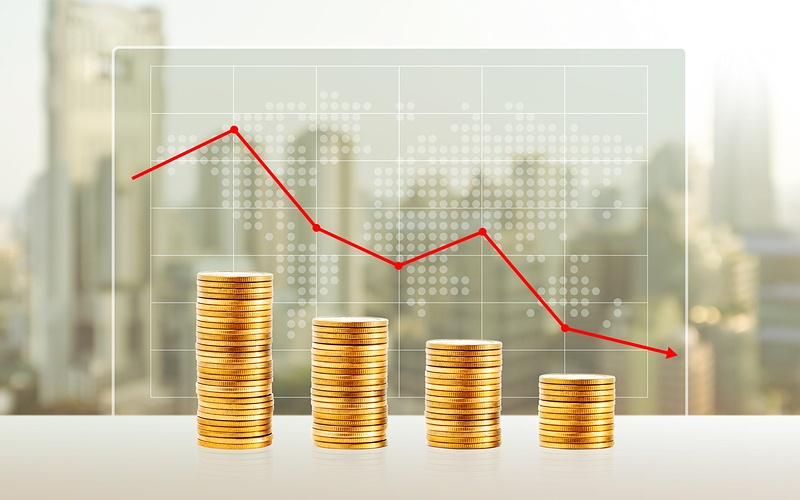 Pension Partners published an excellent study about relation between big winners and big drawdowns. Big Winners And Big Drawdowns By Charles Bilello of Pension Partners Apple, Amazon, Microsoft and Alphabet… All among the largest and most revered companies in the world. All have returned unfathomable amounts to their shareholders. All have experienced periods of tremendous adversity with large drawdowns. When thinking about big winners in the stock market, adversity and large drawdowns probably aren’t the first words that come to mind. We tend to put the final outcome (big long-term gains) on a pedestal and ignore the grit and moxie required to achieve that outcome. But moxie is the key to long-term investing success, for there is no such thing as a big long-term winner without enduring a big drawdown along the way… Apple has gained 25,217% since its IPO in 1980, an annualized return of 17%. Incredible gains, but these are just numbers, masking the immense pain one would have endured over time. Apple investors from the IPO would experience two separate 82% drawdowns, one from 1991 to 1997 and another from 2000 to 2003. Amazon has gained 38,882% from its IPO in 1997, an annualized return of over 36%. To put that in perspective, a $100,000 investment in 1997 would be worth just under $39 million today. Breathtaking gains, but they were not realized without significant adversity. In December 1999, the initial $100,000 investment would have grown to $5.4 million. By September 2001, less than 2 years later, this $5.4 million would shrink down to $304,000, a 94% drawdown. It took over 8 years, until October 2009, for Amazon to finally recover from this drawdown to move to new highs. Bill Gates is the richest man in the world, having amassed his $80 billion fortune as the founder of Microsoft. Microsoft has returned 25% a year over the past 30 years, a remarkable feat. The path to riches in Microsoft looks deceptively easy on the surface. The calendar year returns from its IPO in 1986 through 1999 were incredibly high and consistent, masking significant underlying volatility. In 1987 Microsoft advanced 123% but would suffer more than 50% decline in October during the stock market crash. It would not recoup those losses for two years, until October 1989. Its largest drawdown in history occurred over a 10 year period, a 70% decline from 1999 through 2009. Alphabet (formerly Google) has been one of the great growth stories in recent history, returning 26% per year since its IPO in 2004. It did not achieve these returns, though, in a straight line. Its largest drawdown: a 65% decline from 2007 through 2008. It should be clear from these four examples that large drawdowns are an inevitable part of achieving high returns. If you haven’t yet experienced such a gut-wrenching decline, then you probably haven’t owned something that has appreciated 10x, 20x or more. Or you simply haven’t been investing for that long. I know what you’re thinking. There has to be a better way. You want that big juicy return but without the big drawdown. Yes indeed, as does everyone else. The problem, of course, is in trying to hedge or time your exposure to big winners, you will likely miss out on a substantial portion of the gains. Or your emotions will cause you to sell at precisely the worst time (after a large drawdown). Your volatility and drawdown profile may be lower, but that tradeoff will come at a price. As I wrote earlier this year the price for hedge fund investors seeking lower volatility/drawdown in equities has not been a small one, with the HFRX Equity Hedge Index (an investable index of Long/Short equity funds) posting a negative return since 2005 while the S&P 500 has more than doubled. Many investors in these funds were seeking the Holy Grail, a high return (often 15-20% in their “mandates”) with little risk (no large drawdowns). They expected their managers to pick the Apples and Amazons of the investment world without incurring the inherent volatility that comes along with it. As we know, that is a complete and utter fantasy. All big winners have big drawdowns. Accepting this fact can go a long way toward controlling your emotions during periods of adversity and becoming a better investor.
 -
 Performance Dissected Check out the Performance page to see the full results. Please note that those results are based on real fills, not hypothetical performance, and exclude commissions, so your actual results will be lower, depending on the broker and number of trades. Please read SteadyOptions 2019 Performance Analysis for full analysis of our 2019 performance. We have extensive discussions about brokers and commissions on the Forum (like this one) and help members to select the best broker. Please refer to How We Calculate Returns? for more details. Our strategies SteadyOptions uses a mix of non-directional strategies: earnings plays, Straddles, Iron Condors, Calendar Spreads, Butterflies etc. We constantly adding new strategies to our arsenal, based on different market conditions. SO model portfolio is not designed for speculative trades although we might do some in the speculative forum. SO is not a get-rich-quick-without-efforts kind of newsletter. I'm a big fan of the "slow and steady" approach. I aim for many singles instead of few homeruns. My first goal is capital preservation instead of doubling your account. Think about the risk first. If you take care of the risk, the profits will come. What's New? We continue expanding the scope of our trades. We are now trading hedged straddles, short term straddles, ratio spreads and more. We launched Steady Momentum and Steady Futures services. We have implemented more improvements to the straddle strategy that reduces risk and enhances returns. We started using the CMLviz Trade Machine to find and backtest some of our trades. This is an excellent tool that already produced few nice winners for us. What makes SO different? We use a total portfolio approach for performance reporting. This approach reflects the growth of the entire account, not just what was at risk. We balance the portfolio in terms of options Greeks. SteadyOptions provides a complete portfolio solution. We trade a variety of non-directional strategies balancing each other. You can allocate 60-70% of your options account to our strategies and still sleep well at night. Our performance is based on real fills. Each trade alert comes with screenshot of our broker fills. We put our money where our mouth is. Our performance reporting is completely transparent. All trades are listed on the performance page, with the exact entry/exit dates and P/L percentage. It is not a coincidence that SteadyOptions is ranked #1 out of 723 Newsletters on Investimonials, a financial product review site. Read all our reviews here. The reviewers especially mention our honesty and transparency, and also tremendous value of our trading community. We place a lot of emphasis on options education. There is a dedicated forum where every trade is discussed before the trade is placed. We discuss different strategies and potential trades. Unlike most other services that just send the trade alerts, our members understand the rationale behind the trades and not just blindly follow the alerts. SO actually helps members to become better traders. Other services In addition to SteadyOptions, we offer the following services: Anchor Trades - Stocks/ETFs hedged with options for conservative long term investors. Anchor Trades produced 38.4% gain in 2019, beating its benchmark by 7.0%. Steady Momentum - puts writing on equity indexes and ETF’s. Steady Momentum produced 19.1% gain in 2019, beating our benchmark by 5.5%. PureVolatility - Volatility products like VXX and UVXY. PureVolatility produced 28.3% gain in 2019. Steady Futures - a systematic trendfollowing strategy utilizing futures options. Steady Futures produced 8.6% gain in the second half of 2019 (launched in July 2019). We offer a 5 products bundle (SteadyOptions, Steady Momentum, Anchor Trades, PureVolatility and Steady Futures) for $745 per quarter or $2,495 per year. This represents up to 50% discount compared to individual services rates and you will be grandfathered at this rate as long as you keep your subscription active. Details on the subscription page. More bundles are available - click here for details. Subscribing to all services provides excellent diversification since those services have low correlation, and you also get the ONE software for free for 12 months with the yearly bundle. We also offer Managed Accounts for Anchor Trades and Steady Momentum. Summary 2019 was another excellent year for our members. All our services delivered excellent returns. SteadyOptions is now 8 years old. We’ve come a long way since we started. We are now recognized as: #1 Ranked Newsletter on Investimonials Top 10 Option Trading Blogs by Options Trading IQ Top 40 Options Trading Blogs by Feedspot Top 15 Trading Forums by Feedspot Top 20 Trading Forums by Robust Trader Best Options Trading Blogs by Expertido Top Traders and People in Finance to Follow on Twitter Top Trading Blogs To Follow by Eztoolset Top Twitter Accounts to Follow by Options Trading IQ I see the community as the best part of our service. I believe we have the best and most engaged options trading community in the world. We now have members from over 50 counties. Our members posted over 125,000 posts in the last 8 years. Those facts show you the tremendous added value of our trading community. I want to thank each of you who’ve joined us and supported us. We continue to strive to be the best community of options traders and continuously improve and enhance our services. Let me finish with my favorite quote from Michael Covel: "Profits come in bunches. The trick when going sideways between home runs is not to lose too much in between." If you are not a member and interested to join, you can click here to join our winning team. When you join SteadyOptions, we will share with you all we know about options. We will never try to sell you any additional "proprietary systems", training, webinars etc. All our "secrets" are included in your monthly fee. Happy Trading from SO team!
 -
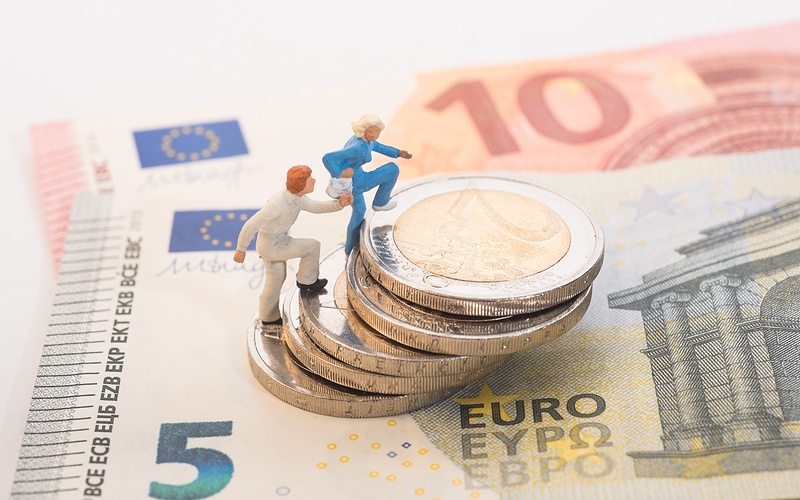 Keep in Mind, Stocks Rose 1,100-fold During This Period From Morgan’s article: The S&P 500 rose 1,100-fold over the last 70 years, including dividends. But look what happened during that period: May 1946 to May 1947. Stocks decline 28.4%. A surge of soldiers return from World War II, and factories across America return to normal operations after years of building war supplies. This disrupts the economy as the entire world figures out what to do next. Real GDP declines 13% as wartime spending tapers off. A general fear that the economy will fall back into the Great Depression worries economists and investors. June 1948 to June 1949. Stocks decline 20.6%. A world still trying to figure out what a post-war economy looks like causes a second U.S. recession with more demobilization. Inflation surges as the economy adjusts. The Korean conflict heats up. June 1950 to July 1950. Stocks fall 14%.North Korean troops attack points along South Korean border. The U.N Security Council calls the invasion “a breach of peace.” U.S. involvement in the Korean War begins. July 1957 to October 1957. Stocks fall 20.7%. There’s the Suez Canal crisis and Soviet launch of Sputnik, plus the U.S. slips into recession. January 1962 to June 1962. Stocks fall 26.4%. Stocks plunge after a decade of solid economic growth and market boom, the first “bubble” environment since 1929. In a classic 1962 interview, Warren Buffett says, “For some time, stocks have been rising at rather rapid rates, but corporate earnings have not been rising, dividends have not been increasing, and it’s not to be unexpected that a correction of some of those factors on the upside might occur on the downside.” February 1966 to October 1966. Stocks fall 22.2%. The Vietnam War and Great Society social programs push government spending up 45% in five years. Inflation gathers steam. The Federal Reserve responds by tightening interest rates. No recession occurred. November 1968 to May 1970. Stocks fall 36.1%. Inflation really starts to pick up, hitting 6.2% in 1969 up from an average of 1.6% over the previous eight years. Vietnam War escalates. Interest rates surge; 10-year Treasury rates rise from 4.7% to nearly 8%. April 1973 to October 1974. Stocks fall 48%.Inflation breaks double-digits for the first time in three decades. There’s the start of a deep recession; unemployment hits 9%. September 1976 to March 1978. Stocks fall 19.4%. The economy stagnates as high inflation meets dismal earnings growth. Adjusted for inflation, corporate profits haven’t grown for eight years. February 1980 to March 1980. Stocks fall 17.1%. Interest rates approach 20%, the highest in modern history. The economy grinds to a halt; unemployment tops 10%. There’s the Iran hostage crisis. November 1980 to August 1982. Stocks fall 27.1%. Inflation has risen 42% in the previous three years. Consumer confidence plunges, unemployment surges, and we see the largest budget deficits since World War II. Corporate profits are 25% below where they were a decade prior. August 1987 to December 1987. Stocks fall 33.5%. The crash of 87 pushes stocks down 23% in one day. No notable news that day; historians still argue about the cause. A likely contributor was a growing fad of “portfolio insurance” that automatically sold stocks on declines, causing selling to beget more selling — the precursor to the fragility of a technology-driven marketplace. July 1990 to October 1990. Stocks fall 19.9%. The Gulf War causes an oil price spike. Short recession. The unemployment rate jumps to 7.8%. July 1998 to August 1998. Stocks fall 19.3%. Russia defaults on its debt, emerging market currencies collapse, and the world’s largest hedge fund goes bankrupt, nearly taking Wall Street banks down with it. Strangely, this occurs during a period most people remember as one of the most prosperous periods to invest in history. March 2000 to October 2002. Stocks fall 49.1%. The dot-com bubble bursts, and 9/11 sends the world economy into recession. November 2002 to March 2003. Stocks fall 14.7%. The S. economy puts itself back together after its first recession in a decade. The military preps for the Iraq war. Oil prices spike. October 2007 to March 2009. Stocks fall 56.8%. The global housing bubble bursts, sending the world’s largest banks to the brink of collapse. The worst financial crisis since the Great Depression. April 2010 to July 2010. Stocks fall 16%. Europe hits a debt crisis while the U.S. economy weakens. Double-dip recession fears. April 2011 to October 2011. Stocks fall 19.4%. The U.S. government experiences a debt ceiling showdown, U.S. credit is downgraded, oil prices surge. June 2015 to August 2015. Stocks fall 11.9%. China’s economy grinds to a halt; the Fed prepares to raise interest rates. ____________________________________________________________ I like Morgan’s article, it reminds us that economic uncertainty has always been a regular part of the past along with frequent corrections (10%+ declines) and deep bear markets (20%+ declines). His intention is to help us have a long term perspective. Many times throughout the past seven decades, “this has never happened before”. Yet the US continued to show its strength and resiliency. For some, this is effective. For others, they need something more to help them follow their plan. Dual Momentum In the equities portion of our dual momentum model, we rotate among US Large, US Small, and International stocks based on twelve month relative strength momentum[2]. When all three asset classes have negative absolute momentum[3], we switch into bonds. The idea here is to earn the risk premium in stocks with less exposure to the downside volatility and bear market drawdowns that frequently have occurred in the past and will frequently occur in the future. We emphasize less in an effort to promote proper expectations. Empirical data suggests that dual momentum can be used to earn higher returns with less risk than buy and hold, but it’s not a Holy Grail. Holy Grail strategies tend to fall apart in real time because they were over fit to a limited amount of past data with no economic argument to support why they work. Researchers refer to this as data-mining. With dual momentum, we believe having a proven rules-based method in place to exit equities ahead of the majority of major bear market declines can be all that is needed to help investors have the confidence to stick with their strategy for the long term. And the right strategy for every investor is the one they will stick with. This is key. Since Morgan is using data since 1946, we thought it would be fun to look at showing our dual momentum equities model during this same period (note: international is excluded in this example due to lack of data prior to 1970 although we use it in our actual trading model). Here are a few things to take notice of on both the chart and in the statistics. On the chart, it’s important to notice that our dual momentum approach did NOT outperform an equal weighted buy and hold portfolio in the first thirty years, but slightly lagged or matched buy and hold for most of the period. Thirty years is the investment time horizon for many investors, not seventy. If only relative strength momentum would have been used during this period, outperformance would have occurred. Absolute momentum, or trend following momentum, will take you out of the market at times when doing nothing would have ended up being the better short term outcome. We call these whipsaws, and they are expected as a short term price to pay for risk management that can allow us to sidestep the majority of painful bear market drawdowns. Over the long term, relative strength and absolute momentum tend to contribute fairly equally to excess returns. If the future ends up looking more like this specific period of the past, we still would prefer dual momentum’s slight underperformance as a small cost to pay for the psychological comfort of knowing a plan is in place to protect capital against 50% drawdowns. The total outperformance of dual momentum in the last seven decades comes in the more recent four decades where three separate bear markets of 50%+ losses occurred for buy and hold investors. Two of these occurred in the last fifteen years. This is when absolute momentum does its job of taking us out of equities in the early stages of bear markets. Even during the first thirty year period, dual momentum still produced lower volatility and maximum drawdown[4], and a higher Sharpe Ratio. The period of 1946-1972 produced an annualized return of 12.1% for buy and hold and 11.78% for dual momentum, while over the entire duration dual momentum produced both higher returns and less risk. We make clear to our clients that beating the market isn’t a financial goal, and it would be intellectually dishonest for us to suggest we can guarantee anything about the future. What we can guarantee is that we have vigorously researched a robust investing plan supported by decades of historical data and third party validation. When combined with disciplined execution and realistic expectations, we believe the probabilities are highly in favor of a successful long term investing experience. Investigate carefully Choose wisely Follow faithfully Fama/French (2008): Momentum is “the center stage anomaly of recent years…an anomaly that is above suspicion…the premier market anomaly.” [1] The Credit Suisse Global Investment Return Yearbook shows how both US and World ex-US (in USD) equity risk premiums have far exceeded those of bonds and bills since 1900 forming the portfolio theory basis for focusing on equities in our dual momentum model. [2] Relative strength momentum compares total returns of one asset class to another over an applicable lookback period. The asset class that has risen the most is held for the next month. [3] Absolute momentum is defined as having a total return less than the risk free rate (such as US T-bills) over the applicable lookback period. [4] Maximum drawdown measures total peak to trough loss suffered prior to reaching new equity highs. Maximum drawdown is much more important to most investors than the more frequently mentioned measure of risk known as standard deviation or annualized volatility. Past performance doesn’t guarantee future results. The concepts of dual momentum were pioneered by the research of Gary Antonacci. We recommend using his best-selling book and blog as an additional resource for studying momentum. This is a hypothetical model intended to show the efficacy of dual momentum, and is not intended to represent specific investment advice. Data is gross of any applicable taxes and transaction costs, and investors should always consult with their tax advisor before investing. All investments carry risk, may lose value, and are not FDIC insured. We provide the hyperlink to Morgan Housel’s article as a convenience and do not endorse nor guarantee the accuracy of any information he has presented. Feel free to contact us if you’d like to discuss your specific situation further. We welcome every opportunity to discuss how we could add value to your financial life. Related Articles: Buy The Winners: The Power Of Momentum Momentum – The Premier Market Anomaly
 -
 The below chart illustrates the wide range of one-year outcomes. Investors should attempt to truly internalize the emotions they are likely to feel with this type of very normal and expected volatility associated with equity investing. Euphoria when volatility results in above average premiums and despair when volatility results in substantially negative premiums. There has historically been about one third of all years where the equity premium was negative (the equity market underperformed T-bills), and sometimes by substantial amounts where an investor would have experienced significant short-term capital losses taking several years to recover. Even at a 10-year time horizon, the historical frequency of a market portfolio of US stocks outperforming riskless T-bills has not been guaranteed, with approximately 15% of periods resulting in a negative equity premium. 15% of historical 10-year periods would have resulted in a time of reflection where you realized you took risk for an entire decade without receiving a reward relative to leaving your capital in the safety of T-bills, which are a proxy for cash/money market. Over time an investment in the total US equity market is expected to provide investors with a return that is many multiples of an investment in risk-free T-bills, otherwise investors would not take on the risk. Diversifying globally further increases these odds, but it’s never a guarantee so investors should come to peace with this uncertainty in order to make better informed investment decisions. Choice #1: Resist the lessons available within the historical data and endlessly pursue the hope of finding someone or something that can remove the risk of the equity market without also at the same time removing the return. Choice #2: Come to peace with the historical data, knowing the odds of earning the expected equity premium improve as your time horizon increases, and build a financial plan that accounts for the probabilities. I believe the second choice is the more likely path towards a long-term successful investment experience as the historical evidence against active portfolio management is overwhelming to the point to where it's imprudent to even try. This is a market-based approach where an investor focuses on what they can control, such as minimizing costs & taxes and thinking through proper asset allocation between stocks, bonds, and cash suitable for their situation. At the same time an informed investor knows how volatile the equity premium can be and is less likely to panic sell when it’s negative for a long period of time. Surprise is often the mother of panic, so it’s best to become a student of history so that you’re not surprised when the risk shows up. Harry Truman said "The only thing new in the world is the history you don’t know.” In an excellent piece available upon request titled “The Happiness Equation”, Brad Steiman of Dimensional Fund Advisors writes “Ancient wisdom teaches acceptance, as resistance often fuels anxiety. Instead of resisting periods of underperformance, which might cause you to abandon a well-designed investment plan, try to lean into the outcome. Embrace it by considering that if positive premiums were absolutely certain, even over periods of 10 years or longer, you shouldn’t expect those premiums to materialize going forward. Why is this? Because in a well-functioning capital market, competition would drive down expected returns to the levels of other low-risk investments, such as short-term T-Bills. Risk and return are related.” Would acceptance or resistance better describe your current portfolio and emotional state as an investor? If it’s resistance, what are you going to do to get closer to a state of acceptance to increase your odds of a successful investment experience? Jesse Blom is a licensed investment advisor and Vice President of Lorintine Capital, LP. He provides investment advice to clients all over the United States and around the world. Jesse has been in financial services since 2008 and is a CERTIFIED FINANCIAL PLANNER™ professional. Working with a CFP® professional represents the highest standard of financial planning advice. Jesse has a Bachelor of Science in Finance from Oral Roberts University. Related articles: Coming To Peace With Market Volatility: Part II Should You Care About The Sharpe Ratio? Thinking in terms of decades The benefits of diversification The Importance of Time Horizon When Investing How I Invest My Own Money Realistic Expectations: Using History as A Guide Risk Depends On Your Time Horizon
 -
 2012 and 2013 were in line with our long term profit target of 2-3% per month, but 2014 was a very difficult year for most condor traders. We know many services that actually blew out their clients accounts, but Steady Condors at least was able to limit the losses to reasonable amount, which allowed us to recover from the drawdown within the next 6 months. 2015 was obviously very good, producing 56.5% compounded yearly return. 2014 is the main reason why we are below the long term average. Statistically this not unexpected considering it is only 4 years of data. But Jesse provided a much better explanation: This has been on the FAQ page for quite a long time: How much can I expect to make with your service? Our objective is to make a living, not a killing. We like the story of the tortoise and the hare. Income trading is NOT an ATM machine, regardless of what other option based services are marketing to you. It’s hard and it takes discipline, experience, and a well thought out written plan on how to manage risk. We believe markets aren't perfectly efficient, but they are a lot harder to beat over the long term than most people realize. Our long term goal is to make an average of 15-25% annually on the whole account after trading costs (commissions and slippage). Options inherently provide leverage and substantial risk of loss when not used properly, and iron condors are no exception. Many people mistakenly confuse the high probability of success (per trade) that iron condors offer with safety. Return data is useless without also analyzing risk. I expect SC to have a long-term Sharpe Ratio up to 1 (depending on future risk-free rate which is currently almost zero). Recognizing that this is a topic most people have never been educated on, let me explain. This will help you understand how to more properly analyze returns of different strategies that have different leverage and therefore different risk. A huge mistake that I see retail investors make over an over is only looking at returns. The Sharpe Ratio isn't perfect either, but it's certainly better than only reviewing returns and can give you a way to throw a giant red challenge flag on anyone claiming extraordinary returns. Sharpe Ratio: Annualized return - risk free rate / annualized volatility All you need is a track record of monthly returns to calculate a strategy's Sharpe Ratio. For your reference, 1 is exceptional, and you'll be hard pressed to find hardly any audited track records of any type that have maintained a Sharpe of 1 over a long period of time (10+ years). Yet people are desperate to believe in fairy tales and hope that they've found magic. If a newsletter is honest with you and tells you to "get real", many retail investors will just move on to the next one who will tell them whatever they want to hear in order to gain subscriptions. We'll tell you to get real here. And if you ever feel like we aren't, throw the challenge flag at us. It's why we have forums in order to have discussions. Steady Condors has had a Sharpe Ratio of about 1.3 since 2012 which is above long-term expectations. This is based on 19.8% CAGR (Compound Annual Growth Rate) and 14.6% annual volatility. With the expectations that Steady Condors will produce annualized volatility of around 20% over the long term, this would also land expected returns around 20%. Beware of anything that suggests a massive Sharpe ratio such as 3+ over a long period of time. That would basically qualify them for market wizard status that virtually nobody has achieved for the long-term. Oftentimes you'll find this in a credit spread newsletter where the big loss just hasn't happened yet (it will), or the entire track record is hypothetical, which likely includes overfitting and/or excludes realistic transaction costs. Short volatility strategies like selling options with no risk management can sometimes go for a few years without being tested. Do yourself a favor next time you're looking at a track record and analyze both risk and return, and using the Sharpe Ratio is a great start and a way to possibly save yourself a lot of money. Thank you Jesse for providing such great explanation! At Steady Options, we are committed to promoting long term success to our members which starts with education on having realistic expectations. We will continue telling people to "get real" and not what they want to hear because this is who we are. On a related note, we are one of the few services that report performance on the whole account, not P/L on margin. For example, if we keep 20% of the account in cash and make $400 on $8,000 margin, we would report it as 4% return on $10,000 account. Most services would report it as 5% return. in the long term, it makes HUGE difference. We also include commissions in our reporting, which reduces the numbers by another ~0.3%/month. Always make sure to check how the service reports returns and compare apples to apples. Let me know if you have any questions. Want to learn more? Start Your Free Trial Related Articles: Why Retail Investors Lose Money In The Stock Market Are You Ready For The Learning Curve? How to Calculate ROI in Options Trading Performance Reporting: The Myths and The Reality Are You EMOTIONALLY Ready To Lose?
 -
.jpg.930eff35b902da8c796b0c699f5af85e.jpg) I can guess that many people in this industry are getting this question. Today I got an email from Matthew Klein, CEO of Collective2.com, where he provides some excellent and perfectly logical explanation. Here are some major points. “Why would a good trader share his strategy?” That’s the question, then, isn’t it? If you create a good trading strategy, why let other people use it for a modest amount of money, rather than keeping it all to yourself? Actually, there are several reasons. Leverage and risk The same question can be asked of virtually the entire financial industry. Why do top-tier hedge funds accept investor money? If the guys at Two Sigma are so smart (and they are), why don’t they just trade their own money from an unmarked building in Soho? Why go through the hassle of raising capital from investors? Or more broadly, why have mutual funds? Why run a bond fund? If Bill Gross is such a genius (and he is), why does he bother accepting investor money, and suffering the indignity of annoying questions, or unfortunate P.R.? Why not trade his own private capital from his house in Laguna Beach, and when people ask him what he does for a living, he can just say, “I’m a beach bum. I don’t do anything.” The answer is: leverage (people want more of it) and risk (people want less of it). Even Masters of the Universe don’t have infinite cash sitting around. After all, many Hedge Fund Titans live in New York City: there are co-ops to buy, kids to private-school, restaurants to patronize. If you are a managing director at a top-tier hedge fund, and you have a million dollars in the bank, ready to invest, which would you prefer: to earn 20% on your money? Or 30%? Letting other people invest alongside you, and making money on their money, is a form of leverage. (For those not fluent in finance: leverage means using borrowed money to make more money.) Leverage isn’t always a good thing, of course (you can lose more, too) — but if you have high confidence in your trading ability, using leverage can be a wise decision. If you are a competent trader, and you have $100,000 sitting in your brokerage account, ready to trade, which would you prefer: to earn 20% on your money? Or 30%? Imagine you are a good trader, and you think that you can earn 20% each year on your $200,000 trading nest egg. Now imagine that selling your strategy on lets you earn an extra $5,000 each month in subscription fees from your followers. That’s the equivalent of another 30% on your capital. Sure, there’s no guarantee you will earn that, but if you build a good track record on, you can earn that much, and more. So, just like a Hedge Fund Titan — or just like a mutual fund manager — you can gain “leverage” on your own dollars by opening your strategy to the public. Reducing Risk Allowing outside investors to trade alongside you, and pay you a fee, also reduces your risk. Let’s be honest about that. A typical hedge fund charges “2-and-20” — which means they charge an investor a fee of 2% of the money invested with them, plus 20% of the investor’s profits. That 2% is charged no matter what — whether the fund wins or loses. It’s called a “management fee,” and in theory it’s meant to cover fixed expenses that happen every month at a hedge fund, no matter what: you know, rent, administrative assistants, legal and accounting, blow. But money is fungible, and what you pay with one set of dollars is something you don’t have to pay with another set of dollars. One way to think of that 2% management fee is as a risk-reduction cushion. If trading doesn’t work so well in one month, you still get your 2%. When you’re managing a billion dollars, that’s a nice chunk of change. Now, listen, if you stink up the place six months in a row, most investors will flee and take their 2% management fee with them. But you’ll get a bit of leeway — more so if you have a long and distinguished track record behind you. That leeway reduces your risk. That’s what you gain by offering your strategy to other people, instead of just trading it alone. Building your career So far, I’ve discussed the financial reasons why a legitimate, talented trading-strategy creator would sell his system. But there’s another reason, which is not related to money, but, rather, to career development. Finance is a hard industry to break into. We’ve all read about the glamorous life of hedge fund managers, but how exactly does one go about getting a job at a hedge fund? You don’t fill out an application online, and — truthfully — unless you go to a top-five American university, you won’t see the face of a recruiter at your annual career fair. I’ve already written about how stupid hedge-fund hiring practices are. But indignation won’t change the world. The fact is, it’s ridiculously hard to get a job at a hedge fund, and in finance in general, and probably always will be. But there’s one thing “finance people” respect, and that’s money. Prove you can make it for them, and it doesn’t matter one bit whether you went to Harvard or Pomona State. Money talks. Running a public track record, with other people’s money at stake, is a different beast than sitting alone in your room, wanking your own tiny brokerage account. The pressure makes some people crack. On the other hand, some people love performing in public — whether the performance is musical, or written… or financial. Some people share their strategies with the public for reasons other than money: they are building their career, buffing their resume, trying to break into the business. SteadyOptions Not all those reasons are applicable to SteadyOptions, but some are. But even if you don't buy any of those reasons, the only question you have to ask yourself: is the subscription service helpful to you? Does it help you to become a better trader? Does it help you to make money? If the answer to those questions is yes, this is the only thing that should matter to you. Why am I doing this is secondary. Happy trading!
I can guess that many people in this industry are getting this question. Today I got an email from Matthew Klein, CEO of Collective2.com, where he provides some excellent and perfectly logical explanation. Here are some major points. “Why would a good trader share his strategy?” That’s the question, then, isn’t it? If you create a good trading strategy, why let other people use it for a modest amount of money, rather than keeping it all to yourself? Actually, there are several reasons. Leverage and risk The same question can be asked of virtually the entire financial industry. Why do top-tier hedge funds accept investor money? If the guys at Two Sigma are so smart (and they are), why don’t they just trade their own money from an unmarked building in Soho? Why go through the hassle of raising capital from investors? Or more broadly, why have mutual funds? Why run a bond fund? If Bill Gross is such a genius (and he is), why does he bother accepting investor money, and suffering the indignity of annoying questions, or unfortunate P.R.? Why not trade his own private capital from his house in Laguna Beach, and when people ask him what he does for a living, he can just say, “I’m a beach bum. I don’t do anything.” The answer is: leverage (people want more of it) and risk (people want less of it). Even Masters of the Universe don’t have infinite cash sitting around. After all, many Hedge Fund Titans live in New York City: there are co-ops to buy, kids to private-school, restaurants to patronize. If you are a managing director at a top-tier hedge fund, and you have a million dollars in the bank, ready to invest, which would you prefer: to earn 20% on your money? Or 30%? Letting other people invest alongside you, and making money on their money, is a form of leverage. (For those not fluent in finance: leverage means using borrowed money to make more money.) Leverage isn’t always a good thing, of course (you can lose more, too) — but if you have high confidence in your trading ability, using leverage can be a wise decision. If you are a competent trader, and you have $100,000 sitting in your brokerage account, ready to trade, which would you prefer: to earn 20% on your money? Or 30%? Imagine you are a good trader, and you think that you can earn 20% each year on your $200,000 trading nest egg. Now imagine that selling your strategy on lets you earn an extra $5,000 each month in subscription fees from your followers. That’s the equivalent of another 30% on your capital. Sure, there’s no guarantee you will earn that, but if you build a good track record on, you can earn that much, and more. So, just like a Hedge Fund Titan — or just like a mutual fund manager — you can gain “leverage” on your own dollars by opening your strategy to the public. Reducing Risk Allowing outside investors to trade alongside you, and pay you a fee, also reduces your risk. Let’s be honest about that. A typical hedge fund charges “2-and-20” — which means they charge an investor a fee of 2% of the money invested with them, plus 20% of the investor’s profits. That 2% is charged no matter what — whether the fund wins or loses. It’s called a “management fee,” and in theory it’s meant to cover fixed expenses that happen every month at a hedge fund, no matter what: you know, rent, administrative assistants, legal and accounting, blow. But money is fungible, and what you pay with one set of dollars is something you don’t have to pay with another set of dollars. One way to think of that 2% management fee is as a risk-reduction cushion. If trading doesn’t work so well in one month, you still get your 2%. When you’re managing a billion dollars, that’s a nice chunk of change. Now, listen, if you stink up the place six months in a row, most investors will flee and take their 2% management fee with them. But you’ll get a bit of leeway — more so if you have a long and distinguished track record behind you. That leeway reduces your risk. That’s what you gain by offering your strategy to other people, instead of just trading it alone. Building your career So far, I’ve discussed the financial reasons why a legitimate, talented trading-strategy creator would sell his system. But there’s another reason, which is not related to money, but, rather, to career development. Finance is a hard industry to break into. We’ve all read about the glamorous life of hedge fund managers, but how exactly does one go about getting a job at a hedge fund? You don’t fill out an application online, and — truthfully — unless you go to a top-five American university, you won’t see the face of a recruiter at your annual career fair. I’ve already written about how stupid hedge-fund hiring practices are. But indignation won’t change the world. The fact is, it’s ridiculously hard to get a job at a hedge fund, and in finance in general, and probably always will be. But there’s one thing “finance people” respect, and that’s money. Prove you can make it for them, and it doesn’t matter one bit whether you went to Harvard or Pomona State. Money talks. Running a public track record, with other people’s money at stake, is a different beast than sitting alone in your room, wanking your own tiny brokerage account. The pressure makes some people crack. On the other hand, some people love performing in public — whether the performance is musical, or written… or financial. Some people share their strategies with the public for reasons other than money: they are building their career, buffing their resume, trying to break into the business. SteadyOptions Not all those reasons are applicable to SteadyOptions, but some are. But even if you don't buy any of those reasons, the only question you have to ask yourself: is the subscription service helpful to you? Does it help you to become a better trader? Does it help you to make money? If the answer to those questions is yes, this is the only thing that should matter to you. Why am I doing this is secondary. Happy trading! -
 Last week I came across the following Tweet: 1,300% return in one day?? This is how the trade looks in ONE software at the time of the opening: ONE shows a maximum return of only ~7%. What is going on here? This trade is long one call and short 2 calls. Which means one of the calls is naked and requires huge margin requirement. If you are not a member yet, you can join our forum discussions for answers to all your options questions. When the trade was closed on Apr.17, this is how it looked: Explanation for "1,300% gain"? This calculation ignores the margin requirement on the short options. When a trade requires a margin (like credit spreads or naked options), the return cannot be calculated on cash outcome - it has to account for margin requirement. As a side note, it was a good trade. No downside risk, and upside risk starts at 2,900 (over 100 points move in one day). But the gain was nowhere near 1,300%. Related articles: How To Calculate ROI On Credit Spreads How To Calculate ROI In Options Trading
 -

Coming to Peace With Market Volatility: Part II
Jesse posted a article in SteadyOptions Trading Blog
 The bad news is that the annualized volatility of the market premium has been almost twice as large as the premium itself at 15%, and therefore has had a wide range of approximately -40% to +50%. Many are not fully aware of the implications volatility has on the probability of a positive outcome over meaningful periods of time. For example, below are the historical frequencies at which the US equity market premium has been positive since 1927: As investors, our goal should be to maximize the odds that our investments meet our long-term financial goals. In order to achieve this objective, we could attempt to time the market premium (get out/in of the equity market when we think it will underperform/outperform T-Bills), but this is so difficult to do consistently that it may be imprudent to try. Alternatively, we can diversify within the equity market by giving greater than market cap weight to stocks with certain characteristics, or factors, that academic research has found to have higher expected returns and diversification benefits. This includes the higher historical average returns of Small Cap stocks vs. Large Cap stocks, Value stocks vs. Growth stocks, and stocks with high relative Profitability vs. stocks with low relative Profitability. Below are the historical frequencies of outperformance since 1926 for each factor. Note that due to data limitations, profitability is measured since 1963. All data is from Dimensional Fund Advisors. There are many ways investors can use this information. For the purpose of this article I’m focused on how we can use it to build a portfolio with a higher frequency of beating T-Bills than a market portfolio, as well as the frequency of a “factor tilted” portfolio beating a market portfolio. In the below chart, the factor tilted portfolio that gives slightly greater than market weighting to Small Cap, Value, and high relative Profitability stocks is referred to as “Adjusted Market”. There are mutual funds and ETF’s available that investors could purchase that would provide similar expected returns to what is displayed in this chart. Not only would this factor tilted adjusted US equity portfolio historically have higher than market returns (average premium over T-Bills of 9.95% annually since 1950 vs. 8.37%), the data shows it would have also provided a slightly more consistent premium over 5- and 10-year rolling periods. Conclusion Our goal as investors should be to build portfolios that can most reliably meet the required rate of return that it will take to reach our long-term financial goals. In order to know this, a financial plan with clearly described goals is required. We should focus on only taking risks that cannot be easily diversified away, and therefore the market provides compensation for bearing. These risks include the factors mentioned in this article, including the risks of the Market as a whole and of Small Cap and Value stocks. Investors may consider adding greater than market cap weighting to these known sources of expected return for their equity portfolios.This can easily be done today at low costs with certain mutual funds and ETF’s. By simply “tilting” a portfolio to these risk factors, diversification is still maintained across roughly 3,000 stocks that make up the total market. Similar to an investors decision of how much to hold in stocks vs. bonds, an investor must consider how much they include factors in their equity allocation. Jesse Blom is a licensed investment advisor and Vice President of Lorintine Capital, LP. He provides investment advice to clients all over the United States and around the world. Jesse has been in financial services since 2008 and is a CERTIFIED FINANCIAL PLANNER™ professional. Working with a CFP® professional represents the highest standard of financial planning advice. Jesse has a Bachelor of Science in Finance from Oral Roberts University. Jesse manages the Steady Momentum service, and regularly incorporates options into client portfolios. Related articles Coming To Peace With Market Volatility Should You Care About The Sharpe Ratio? Thinking in terms of decades The benefits of diversification The Importance of Time Horizon When Investing How I Invest My Own Money Realistic Expectations: Using History as A Guide Risk Depends On Your Time Horizon
 -
.jpg.628a69c952837c61f0226b03158ed35c.jpg) So, let’s have a deeper look into those options trading experience levels and what they really are. Level 1- The Beginner This stage starts when you realize there is a way to make money while staying at home. At this stage you are probably neither aware of the dangers of trading nor of where to start looking to understand trading. In this stage you are full of enthusiasm and want to conquer the world. In this stage, you are starting to realise that more money can be made through leverage and you underestimate all of the dangers that trading on margin carries. This is the stage that probably 20-30% of “traders” are quitting. Level 2- The Student The second level of trading is the learning period. In this period, you are trying to lay your hands on literally everything that is trading related. This is anything from trading articles, free e-books, hard-copy books to paid courses. You are starting to realize what an immense field trading is and how difficult to grasp it is. In this level of trading you realize that you need to choose the right trading strategy. This should be a strategy that preferably fits your personality. You start asking yourself questions like: Should I be a day trader? Maybe, I will be better off as a long-term position trader or swing-trader. What would be the best strategy to fit in my daily agenda. This is the level where you are also asking yourself- can I do this part time, or I should quite my job to start trading full-time. This is also the level of trading in which you are jumping from one trading strategy to another. You are too eager to realise that one of your trading buddies has just mastered a different trading approach and you are too excited to try it out. The trader inside of you is not really paying attention to money management or risk management. You just want to make “big bucks” and preferably quick. This is also the stage that probably 30-40% of the “traders” are dropping out. Level 3- Tenbagger Trader “Tenbagger” is a term introduced by the famous investor Peter Lynch. It is usually used to describe an investment that grows ten-fold. This is the level of trading, in which a trader has finally mastered how to hold a position longer. He/she are not making the same silly mistakes that they used to before. Now is the time to really shine and start bragging in front of your colleagues and friends. Maybe time has come for you to consider quitting your boring job and working full-time as a trader. Or maybe you can send your track record to one of the prop trading houses and ask to join them. The world is your oyster and you are asking yourself how come you did not start trading earlier in your life. You are tapping yourself on the shoulder and start thinking if time has come to consider other types of investments. Maybe you can re-invest; or possibly you can find another hobby. This is the level of trading in which you are asking yourself the question if you should start your own trading blog and share your strategy. It is all great until you wake up one morning and you realize that you were exposed too heavily and received a margin call. You feel like it is the worst day in your life. You want to cry (and you probably do) and start blaming yourself how stupid you were. This is the level of trading, in which you are releasing how important risk/money management is and how underestimated in your trading strategy it was. This is also a stage in which another 20-30% will call it a day. Level 4- The Five Percenters (a.k.a. 5%ers) 15 years ago I read somewhere that only 5% of traders really make it. I am not sure whether this percentage is right or is more like 0.5%. What is really true is that only a fraction of traders do really make it to this level of trading experience. Reaching this level does not mean that you will never fall back. There is no guarantee that you will be a 5%er forever. It means though that you have learnt the ropes of trading and know how to manoeuvre in the deep waters of this ocean. Being a 5%er means that you have showed stronger character than the majority of other players and you can finally tap yourself on the shoulder. But you don’t do it. You don’t do it, because you have learnt the hard way that the more you brag about it or the more excited you become can bode only one thing- losing your 5%er status. Being a great trader is not a natural talent. It is a skill that traders develop over the years. Being a 5%er means that you not only know where to take profit; more important than that- you know where to cut a losing trade. This level of trading teaches you that to know how to live in the unknown. Trading on this level means that you can watch the screen and still be objective. Being a 5%er means that you can hold a bit longer until price finally reaches your target. On this level of trading you are not thinking about trading systems anymore. You have turned into a risk:reward calculator and a pattern-recognition machine. You are never again afraid of not taking this or that trade. At the same time, you are never too afraid to enter in a trade slightly later. You are just a master trader. CONCLUSION What is your level of trading? Are you sure trading is for you? Trading is a field that makes you or breaks you. Every day is different and you need to be flexible enough to understand that. In this article I shared some of my thoughts about trading in 4 levels. Sometimes being a beginner is closer to the 5%er than you think. Feel free to share your comments in the section below. About the author: Colibri Trader is a price action trader that is constantly looking for the apha. In the meantime, he does not forget to enjoy life, travel and even mentor other traders. This article was originally published here.
So, let’s have a deeper look into those options trading experience levels and what they really are. Level 1- The Beginner This stage starts when you realize there is a way to make money while staying at home. At this stage you are probably neither aware of the dangers of trading nor of where to start looking to understand trading. In this stage you are full of enthusiasm and want to conquer the world. In this stage, you are starting to realise that more money can be made through leverage and you underestimate all of the dangers that trading on margin carries. This is the stage that probably 20-30% of “traders” are quitting. Level 2- The Student The second level of trading is the learning period. In this period, you are trying to lay your hands on literally everything that is trading related. This is anything from trading articles, free e-books, hard-copy books to paid courses. You are starting to realize what an immense field trading is and how difficult to grasp it is. In this level of trading you realize that you need to choose the right trading strategy. This should be a strategy that preferably fits your personality. You start asking yourself questions like: Should I be a day trader? Maybe, I will be better off as a long-term position trader or swing-trader. What would be the best strategy to fit in my daily agenda. This is the level where you are also asking yourself- can I do this part time, or I should quite my job to start trading full-time. This is also the level of trading in which you are jumping from one trading strategy to another. You are too eager to realise that one of your trading buddies has just mastered a different trading approach and you are too excited to try it out. The trader inside of you is not really paying attention to money management or risk management. You just want to make “big bucks” and preferably quick. This is also the stage that probably 30-40% of the “traders” are dropping out. Level 3- Tenbagger Trader “Tenbagger” is a term introduced by the famous investor Peter Lynch. It is usually used to describe an investment that grows ten-fold. This is the level of trading, in which a trader has finally mastered how to hold a position longer. He/she are not making the same silly mistakes that they used to before. Now is the time to really shine and start bragging in front of your colleagues and friends. Maybe time has come for you to consider quitting your boring job and working full-time as a trader. Or maybe you can send your track record to one of the prop trading houses and ask to join them. The world is your oyster and you are asking yourself how come you did not start trading earlier in your life. You are tapping yourself on the shoulder and start thinking if time has come to consider other types of investments. Maybe you can re-invest; or possibly you can find another hobby. This is the level of trading in which you are asking yourself the question if you should start your own trading blog and share your strategy. It is all great until you wake up one morning and you realize that you were exposed too heavily and received a margin call. You feel like it is the worst day in your life. You want to cry (and you probably do) and start blaming yourself how stupid you were. This is the level of trading, in which you are releasing how important risk/money management is and how underestimated in your trading strategy it was. This is also a stage in which another 20-30% will call it a day. Level 4- The Five Percenters (a.k.a. 5%ers) 15 years ago I read somewhere that only 5% of traders really make it. I am not sure whether this percentage is right or is more like 0.5%. What is really true is that only a fraction of traders do really make it to this level of trading experience. Reaching this level does not mean that you will never fall back. There is no guarantee that you will be a 5%er forever. It means though that you have learnt the ropes of trading and know how to manoeuvre in the deep waters of this ocean. Being a 5%er means that you have showed stronger character than the majority of other players and you can finally tap yourself on the shoulder. But you don’t do it. You don’t do it, because you have learnt the hard way that the more you brag about it or the more excited you become can bode only one thing- losing your 5%er status. Being a great trader is not a natural talent. It is a skill that traders develop over the years. Being a 5%er means that you not only know where to take profit; more important than that- you know where to cut a losing trade. This level of trading teaches you that to know how to live in the unknown. Trading on this level means that you can watch the screen and still be objective. Being a 5%er means that you can hold a bit longer until price finally reaches your target. On this level of trading you are not thinking about trading systems anymore. You have turned into a risk:reward calculator and a pattern-recognition machine. You are never again afraid of not taking this or that trade. At the same time, you are never too afraid to enter in a trade slightly later. You are just a master trader. CONCLUSION What is your level of trading? Are you sure trading is for you? Trading is a field that makes you or breaks you. Every day is different and you need to be flexible enough to understand that. In this article I shared some of my thoughts about trading in 4 levels. Sometimes being a beginner is closer to the 5%er than you think. Feel free to share your comments in the section below. About the author: Colibri Trader is a price action trader that is constantly looking for the apha. In the meantime, he does not forget to enjoy life, travel and even mentor other traders. This article was originally published here. -
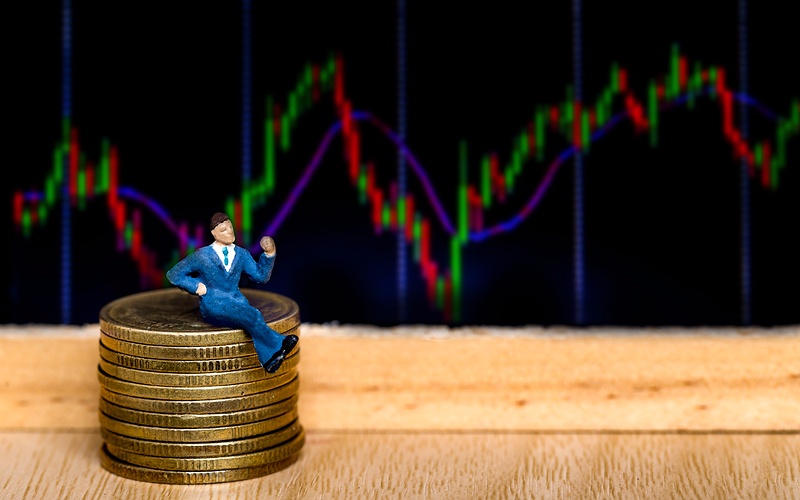 Our performance reporting is on the whole account and based on real fills. We put our money where our mouth is. Our members already know that we execute all trades that we share with members in our personal accounts. You can read here what our members think about us. But today I'm going to take one more step toward complete transparency. I'm going to provide an additional reference to the current and prospective members and share with you my personal account performance. I'm going to show you the summary of my actual 2015 account statement, directly from my broker. Here it a screenshot from my broker's 2015 statement: Just to be clear, I have several accounts trading/investing different strategies, but this account is exclusive to trades that I share with my SteadyOptions and Steady Condors members. It uses a very conservative allocation of 5-7% for SteadyOptions trades and 15-20% allocation for Steady Condors trades, leaving around 30-50% of the account in cash on average. I followed the same allocation guidelines that I share with my members and started with account value consistent with what majority of our members allocate to our services. As you can see, the account return was 80.2% in 2015. You might have the following questions after seeing my performance: Q: Why are you revealing your personal performance? A: My goal is to show you that SteadyOptions performance is not a myth or hypothetical performance. By showing you my real numbers, I want you to see what is possible to earn by trading options if you have the patience, the discipline and the perseverance. I also want to silence the doubters who claim that I don't trade with real money. Q: Will I be able to replicate this performance if I subscribe to SteadyOptions and/or Steady Condors? A: That depends. If you just started trading options, then most probably the answer is NO. It will take time. I know this is not what people want to hear, but that's the truth. If you have some experience and spend the time to learn our strategies, then I see no reason why not. In fact, some of our members do better than our official performance. Q: Is 80% per year really that good? A: You might see sales pages showing you 200%+ returns on some cheap options they bought. But what they don’t tell you is that those trades happen once in a while and are not consistent. The real question is not how much you made on few isolated trades, but how much you made on the whole account. Performance Reporting: The Myths and The Reality shows a lot of examples of performance manipulation, so be careful. Q: How much risk did you take to achieve this performance? A: Trading is a risky business in general. However, we implement advanced techniques to reduce risk. For example, the Steady Condors trades are hedged and protected much more than "standard" Iron Condor trades. In SteadyOptions portfolio we balance the trades in terms of the Greeks to reduce risk. Position sizing also plays a big role. But those techniques can only reduce risk, not eliminate it. This is why I still don't recommend allocating more than 20-30% of your net worth to options trading, especially if you have big portfolios. Q: Can you achieve similar performance with $1,000,000 portfolio? A: NO. It is a well known fact that achieving very high performance numbers becomes more difficult as your account grows, for various reasons. One of the issues is liquidity, and this is why I don't recommend allocating more than $100,000 to SteadyOptions. Q: What is the impact of commissions on performance? A: As you can see, even with cheap broker, I still paid over $16k in commissions in 2015, which reduced the performance by ~20-25% per year. Commissions is the cost of doing business, but you should do whatever is possible to reduce them. Brokers and Commissions discussion can help you to pick the right broker. 2020 update: with availability of brokers like RobinHood, Tradier etc. the impact of commissions is much less than it used to be. Q: Why your performance page presents much higher returns for SteadyOptions service compared to your personal account performance? A: Few reasons: The performance on the performance page excludes commissions. My account traded mix of SteadyOptions and Steady Condors strategies and Steady Condors performance is lower. I kept relatively large portion of the account (around 30-50%) in cash most of the time. I might use slightly different allocation. I might execute some trades in my personal account that I don't share with the members, for various reasons (liquidity, higher risk etc.) Generally speaking, my personal account performance might be different from the official performance for the reasons outlined above. Q: Do you trade other strategies besides SteadyOptions and Steady Condors? A: This specific account is exclusive to SteadyOptions and Steady Condors strategies only. I have other accounts (retirement account, corporate account etc.) where I have longer term investments, including Anchor Trades strategy. I also have some Real Estate investments. Q: I would love to join, but I have a full time job and no time to dedicate to trading. Why don't you offer auto-trading? A: SEC considers newsletters that engage in auto-trading to be investment advisers, and I am not licensed to be an investment adviser. So most newsletters that engage in auto-trading are breaking the law and are exposed to lawsuits like this one. You can read more details here. Please let me know if you have any questions. I invite you to try our services and see how we can help you to become a better trader. I'm not going to promise you the Holy Grail. What I can promise you is that if you are willing to work hard and learn the craft, the sky is the limit. Watch the video: Start Your Free Trial *** Free trial is for new members only ***
 -
 First, as one of our members wrote, how many traders would consider 40%+ returns as subpar? We are definitely in a good shape if 41.7% is considered "well below" average. Most traders would be delighted to have our worst year as their best…But lets see what happened in 2019. Each year, our contributor @Yowsterbreaks down the numbers by trade type. Here is 2019 Year End Performance by Trade Type. As you can see, our returns have been heavily impacted by few big losers back in January and May. You can read a full analysis of January 2019 performance. We had some very large losing trades: Index trades (SPX, TLT, EEM, XLV): 4 big losing trades SPX (-100%, -100%, -72.9%) and TLT (-100%) killed the performance of these trades this year. VIX-based trades: 3 losing trades which play for VIX to fall from highs, or looking for movement in either direction all failed. Broken-wing Butterfly (BWB) Trades: One big -96% losing trade exceeded the gains from all winning trades. Of the top 10 losers only one was from the calendar or straddle trades (and it was at #10). Take away those 10 biggest losers and the model portfolio gain gets to ~90% (non compounded). When you dig into the numbers you see that the overall contribution from our “bread and butter” calendar and straddle trades is on par with prior years (multiply avg gain per trade by number of trades). Since May we made some adjustments, and in the second half of 2019 the model portfolio was up 63%, which translates to annualized compounded return of 165%, in line or better with our previous years. Our core strategies continue to work very well. In fact, if we traded only straddles, calendars and ratios, the yearly return would be well into the triple digits. Going forward, the goal is to avoid those bigger losses, and we are going to reduce the number of those higher risk trades and focus mostly on straddles, hedged straddles, calendars and ratios. On a related note, I got the following message from one of the former members: "So it is fair to say that there is definitely luck involved in trading any trading strategy. I happened to select to test your system at probably the worst 6 month period you have had in 8 years. Any other 6 month period … including 3 months earlier or three month later… would have provided drastically different results." This is true, but isn't it true for any investment? Someone who entered the stock market in March 2009 would have drastically different results from someone who started in 2007 and experience the 50% drawdown. This is also true for many best performing stocks. Apple, Amazon and Google produced incredible gains since their IPOs, but also experienced few large drawdowns, ranging from 65% to 94%. Of course those stocks have also experienced many smaller pullbacks of 20-25%. If you owned one of those stocks and sold them after each pullback, you would never achieved those long term results. In a similar way, if you started SteadyOptions subscription in December 2018 and cancelled after the January drawdown, you would missed the following 63% recovery. If you cancelled after our previous drawdown in 2016, you would missed the following gains of over 400%. Drawdowns are an inevitable part of achieving high returns. If you haven’t yet experienced a significant decline, then you probably haven’t owned something that has appreciated 10x, 20x or more. Or you simply haven’t been investing for that long. All big winners have drawdowns. Accepting this fact can go a long way toward controlling your emotions during periods of adversity and becoming a better investor. To put things in perspective, SteadyOptions produced Compounded Annual Growth Rate of 120.3% since inception. You cannot produce such high gains without taking some risk. We are trying to avoid the drawdowns as much as possible, but the truth is that 20% drawdowns are normal and expected for a strategy that produces such high returns. Finally, take a look at SteadyOptions historical performance: Only 3 out of 9 years we produced "subpar" double digit returns. If the historical pattern continues, the next 2 years should be very rewarding.. Stay the course!
 -
 January 2019 performance was negatively impacted by few big losers. We present below the analysis of those losing trades. TLT butterfly trade The TLT butterfly was opened on November 9. It started with slightly delta negative bias with the expectation that TLT will continue drifting lower. For various reasons, TLT reversed higher and never looked back. Our intention was to use any pullback in TLT price to reduce the loss. TLT continued higher almost in a straight line, and when it finally stabilized at the beginning of December, the trade was already down 70%+. We decided to keep it as a lottery ticket, but TLT continued higher and the butterfly expired worthless. We believed that the TLT rise is temporary and irrational, and it should reverse. Sometimes when you strongly believe in your thesis, you have to stick to your guts. TLT thesis worked very well for us for over 1.5 years, but this time was different. We believe that in the long term, we should stick to our thesis - unless it changes during the live of the trade. This approach proved to work very well over the last 1.5 years. To put things in perspective, TLT butterfly was one of our most successful strategies in 2017-2018. We closed 15 trades, 14 winners and 1 loser, for a cumulative return of ~300%. Few of those trades were down 40-50% just to reverse and produce solid gains. If we closed every trade that was down 50%, I doubt we would achieve similar performance. In summary, we believed in our thesis, and were right much more often than wrong - just not this time. SPX and VIX butterfly trades We implement the SPX butterfly strategy during periods of high volatility. We started using it during October volatility spike, and closed 5 winners in October-November, for cumulative return of 145% (29% average return per trade). Those trades work great if the markets continue lower, and can also serve as hedges. You can read about the strategy here. The January trade was open on December 21, and February trade was opened on December 24. On December 27 we also opened VIX butterfly trade as an additional hedge, after closing the previous VIX butterfly for 36% gain. With the markets still in a free fall, we felt like this was still an appropriate hedge under the circumstances. Those trades could benefit greatly from continuous market weakness. However, in the beginning of January the markets started to move up quickly, and all three trades started losing value. We had few other trades at that time that were bullish, so we decided to keep the SPX and VIX trades as hedges. The concern was that if we close SPX and VIX trades for 30-40% loss, and the markets reverse, we might lose the gains in the other trades as well. While the markets continued higher, SPX and VIX trades continued losing value. During the same period of time, we closed few nice winners as a result of the market recovery (GS, XLV, FB, BABA, CRM, MCD and more). Unfortunately those trades did not fully offset the losses in SPX and VIX trades. When the market started to recover, we mentioned few times that we considered those trades hedges at that point (each one was half allocation). The main lesson from those trades is position sizing. Putting things in perspective We had an incredible winning streak in the last 3 years. We had only one small monthly loss since May 2016 (1.8% loss in March 2018). During the same period of time, our model portfolio produced an average monthly gain of 8.2%, including 17.3% gain in December 2018 (while most major indexes suffered double digit losses). January was our second worst month since inception, but it happened after the 17.3% gain in December, so even if you started in December, you would be down only 3%. Occasional big losers are expected when you consistently produce such high returns. Without those few big losers, we would actually have had a decent month in January. But of course there is no woulda coulda shoulda in trading.. No rewards without risks Charles Bilello of Pension Partners provided a pretty good perspective on drawdowns. There is no such thing as a big long-term winner without enduring drawdowns along the way… Here are some examples: Apple has gained 25,217% since its IPO in 1980, an annualized return of 17%. But Apple investors from the IPO would also experience two separate 82% drawdowns. Amazon has gained 38,882% from its IPO in 1997, an annualized return of over 36%. But from December 1999 to September 2001, the stock suffered a 94% drawdown. Microsoft has returned 25% a year over the past 30 years, a remarkable feat. But it also suffered two significant drawdowns, one of them as high as 70%. Alphabet (formerly Google) has returned 26% per year since its IPO in 2004. It did not achieve these returns, though, in a straight line. Its largest drawdown: a 65% decline from 2007 through 2008. It should be clear from these four examples that drawdowns are an inevitable part of achieving high returns. All big winners have drawdowns. Accepting this fact can go a long way toward controlling your emotions during periods of adversity and becoming a better investor. The Big Picture We all would like all our trades to be winners, but we know this is not possible. Losers are the cost of doing business in trading. Most people know there will be losers. But to paraphrase Morpheus, "there's a difference between knowing that there will be losers... and actually experiencing them". In a probability game, we will eventually experience a string of losses. But even knowing that losses are part of the game, most traders still react the wrong way when those losses actually happen. How we react to our losses is what separates good traders from bad. It gets tough when we experience periods of losses or poor performances and that's where many traders quit because in the first place they never accepted emotionally that they are playing a probability game. Only when we accept emotionally that we are playing a probability game, we will be able to take our trading to the next level. After a losing streak, the natural thing is trying to "get it back". This would be a big mistake. The market doesn't know that we have lost money, and frankly, it doesn't really care. Trying to get it back will cause us taking more risk, and eventually, more losses. The best thing to do is to continue executing our trading plan that worked so well for us for over 7 years. "The Stock market is a wonderful reallocation machine, moving money from those focused on today to those focused on their long-term goals; from the emotional to the dispassionate; from those who trade on gut feelings to those who use a systematic method and from the greedy to the patient." - Jim O'Shaughnessy Sun always rises after the dark. Related articles: SteadyOptions 2018 - Year In Review SteadyOptions 2017 - Year In Review Big Drawdowns Are Part Of The Game Probability Vs. Certainty Trap Are You EMOTIONALLY Ready To Lose?
 -
 Performance Dissected Check out the Performance page to see the full results. Please note that those results are based on real fills, not hypothetical performance, and exclude commissions, so your actual results will be lower. Commissions reduce the monthly returns by approximately 1-2% per month, depending on the broker and number of trades. As with every trading system which uses multi leg trades, commissions will have a significant impact on performance, so it is very important to use a cheap broker. We have extensive discussions about brokers and commissions on the Forum (like this one) and help members to select the best broker. Please refer to How We Calculate Returns? for more details. 2018 was a very different year from the previous years. Despite the increase in volatility, 77% of all SO trades were winners with an average gain of 7.07%. Our model portfolio produced 17.3% return in December 2018 while most major indexes were down double digits. We proved once again that our strategies can make money in any market, bull, bear or sideways. Our strategies SteadyOptions uses a mix of non-directional strategies: earnings plays, Straddles, Iron Condors, Calendar Spreads, Butterflies etc. We constantly adding new strategies to our arsenal, based on different market conditions. SO model portfolio is not designed for speculative trades although we might do some in the speculative forum. SO is not a get-rich-quick-without-efforts kind of newsletter. I'm a big fan of the "slow and steady" approach. I aim for many singles instead of few homeruns. My first goal is capital preservation instead of doubling your account. Think about the risk first. If you take care of the risk, the profits will come. Looking at specific strategies, reverse iron condors were our best performing strategy, producing 31.0% average return with 100% winning ratio. We started using the RIC and BWB strategies later in the year during times when VIX was high (20+). We will continue trading what works the best and adapt to the market conditions. What's New? We continue expanding the scope of our trades beyond the earnings trades, Iron Condors and calendars. We are now trading SPY, TLT, VIX, VXX, XLV and other ETFs to diversify the portfolio. When Implied Volatility spiked, we added RIC and BWB strategies to our arsenal. We will continue refining those strategies to get even better results. This gives members a lot of choice and flexibility. We launched a Creating Alpha service that trades exclusively VIX based products and TLT. It includes two separate model portfolios at very low introductory price. Our long time mentor @Yowster started contributing trades to our official model portfolio. This allowed us to expand the quantity and the quality of our trades, sometimes providing a slightly different angle and perspective. Our members now get official trades from two traders for the price of one! This means more selection and more diversity. We have implemented more improvements to the straddle strategy that reduces risk and enhances returns. As a result, the strategy produced highest average gain percentage and highest percentage of winning trades since inception. We started using the CMLviz Trade Machine to find and backtest some of our trades. This is an excellent tool that already produced few nice winners for us. What makes SO different? First, we use a total portfolio approach for performance reporting. This approach reflects the growth of the entire account, not just what was at risk. We balance the portfolio in terms of options Greeks. SteadyOptions provides a complete portfolio solution. We trade a variety of non-directional strategies balancing each other. You can allocate 60-70% of your options account to our strategies and still sleep well at night. Second, our performance is based on real fills. Each trade alert comes with screenshot of my broker fills. Many services base their performance on the "maximum profit potential" which is very misleading. Nobody can sell at the top and do it consistently. We put our money where our mouth is. Our performance reporting is completely transparent. All trades are listed on the performance page, with the exact entry/exit dates and P/L percentage. It is not a coincidence that SteadyOptions is ranked #1 out of 704 Newsletters on Investimonials, a financial product review site. Read all our reviews here. The reviewers especially mention our honesty and transparency, and also tremendous value of our trading community. We place a lot of emphasis on options education. There is a dedicated forum where every trade is discussed before the trade is placed. We discuss different strategies and potential trades. Unlike most other services that just send the trade alerts, our members understand the rationale behind the trades and not just blindly follow the alerts. SO actually helps members to become better traders. Other services In addition to SteadyOptions, we offer the following services: Anchor Trades - Stocks/ETFs hedged with options for conservative long term investors. Steady Condors - Hedged monthly income trades managed by the Greeks. Creating Alpha - Volatility products like VXX and UVXY plus TLT portfolio. LC Diversified Portfolio - broadly diversified, absolute return, multi-strategy portfolio. We now offer a 4 products bundle (SteadyOptions, Steady Condors, Anchor Trades and Creative Alpha) for $745 per quarter or $2,495 per year. This represents up to 50% discount compared to individual services rates and you will be grandfathered at this rate as long as you keep your subscription active. Details on the subscription page. Subscribing to all 4 services provides excellent diversification since those services have low correlation, and you also get the ONE software for free for 12 months with the yearly bundle. The LCD is our most diversified and scalable portfolio, I highly recommend that members check it out. It is offered as an added bonus of all subscription plans. We also offer Managed Accounts for Anchor Trades and LCD. Summary 2018 was another remarkable year. Our members enjoyed triple digit gains while US stocks posted its worst year in a decade. SteadyOptions is now 7 years old. We’ve come a long way since we started. We are featured on Top 100 Options Blogs by commodityhq, Top 10 Option Trading Blogs by Options trading IQ, Top 40 Options Trading Blogs, Top 15 Trading Forums and more. I see the community as the best part of our service. I believe we have the best and most engaged options trading community in the world. We now have members from over 50 counties. Our members posted over 110,000 posts in the last 7 years. Those facts show you the tremendous added value of our trading community. I want to thank each of you who’ve joined us and supported us. We continue to strive to be the best community of options traders and continuously improve and enhance our services. Let me finish with my favorite quote from Michael Covel: "Profits come in bunches. The trick when going sideways between home runs is not to lose too much in between." If you are not a member and interested to join, you can click here to join our winning team. When you join SteadyOptions, we will share with you all we know about options. We will never try to sell you any additional "proprietary systems", training, webinars etc. All our "secrets" are included in your monthly fee. Happy Trading from SO team!
 -
Realistic Expectations: Using History as A Guide
Jesse posted a article in SteadyOptions Trading Blog
 For example, Bernie Madoff was able to run the largest Ponzi Scheme for decades by intimately understanding human psychology. Criminals like Madoff are often highly intelligent people who know how to prey on human emotion. He knew that if he told people they were making extraordinary returns they’d get suspicious and he might get exposed for the fraud that it was. So he instead played on the emotions of investors, many of whom were savvy enough that they should have known better, by telling customers they were making above average returns without the commensurately higher risk. During the 2008 Financial Crisis, investors were so panicked that they were selling investments of all kinds, causing Bernie’s house of cards to finally collapse. So how can we use history as a guide? We first should consider the words of Spanish philosopher George Santayana – “Those who cannot remember the past are condemned to repeat it.” A basic tenant of investing is that the path to higher returns is found through taking higher risks. Anomalies that suggest higher returns without a commensurate increase in risk should be approached with a high degree of caution and skepticism. It’s also important to note that academic theory and evidence tells us that not all risks come with higher expected returns…such as selecting individual stocks. We should only take compensated risks in the form of diversified portfolios and avoid taking uncompensated risks like holding individual securities. Below are several widely known risk factors that leading academic researchers have identified to lead to commensurately higher returns: Diversified bond portfolios have higher expected returns than riskless Treasury Bills. Diversified total stock market portfolios (Market Beta) have higher expected returns than bond portfolios. Stock portfolios with increased weightings toward smaller (Size) and lower priced(Value) companies have higher expected returns than market portfolios. With this information in mind, investors can construct well diversified portfolios based on their own unique ability (time horizon), willingness (risk tolerance), and need (required return to reach goals) to take risk. But the nature of risk and return is that expected returns do not always result in realized returns. If the relationships described above always played out as expected, there would be no risk. So back to the concept of history as a guide, we can look back to see how often these relationships between risk and return did not work out. The above chart is from Larry Swedroe’s excellent article, “Value Premium RIP? Don’t You Believe It”. The chart tells us how frequently each source of expected return was not realized over 1/3/5/10 and 15 year rolling periods since 1927. For example, the US stock market underperformed riskless Treasury Bills over 30% of 1 year, 19% of 3 year, 16% of 5 year, 7% of 10 year, and 0% of 15-year periods since 1927. Investors simply aware of this data would be much better equipped to make sensible investment decisions as well as understanding proper expectations. If you had capital you could invest for 1 year, you likely wouldn’t take risk if you knew there was a 30% chance of failure. Additionally, the magnitude of failure over one year can be quite great, with the stock market not only underperforming risk-free treasury bills but also producing losses (occasionally large ones). Now contrast this with the 15-year timeframe where there has never been a period of underperformance, making the thought of holding riskless treasury bills for this long (or longer) seem equally as irrational as holding stocks for only one year. Forewarned is forearmed. As it relates to the actual equity portfolio, many investors are surprised by the historical evidence that increasing exposure to small and value stocks has outperformed a market portfolio about as often as a market portfolio outperforms treasury bills. My firm recommends the use of Dimensional Funds for the implementation of this research, and since 1970 the globally diversified and small value tilted Dimensional Equity Balanced Strategy has outperformed a market like S&P 500 portfolio in 80% of 10-year periods by an average of more than 3% per year. Note this also would have occurred with comparable risk due to the benefits of diversification. Conclusion It’s very easy and human to overcomplicate things, including investment decisions. The knowledge and historical perspective of a great financial advisor with a focus on the best interests of the client can lead to better investment experiences and greater peace of mind. A focus on the things that we can control, such as allocating capital according to time horizon, diversification, fees and expenses, taxes, and rebalancing are all ways we can stack the odds in our favor. Understanding the historical probabilities can also lead to greater patience to endure the difficult times when the known risksof investing actually show up. Enjoy the ride! Jesse Blom is a licensed investment advisor and Vice President of Lorintine Capital, LP. He provides investment advice to clients all over the United States and around the world. Jesse has been in financial services since 2008 and is a CERTIFIED FINANCIAL PLANNER™ professional. Working with a CFP® professional represents the highest standard of financial planning advice. Jesse has a Bachelor of Science in Finance from Oral Roberts University. Jesse manages the Steady Momentum service, and regularly incorporates options into client portfolios.
 -
 Below is historical data for the Dimensional Equity Balanced Strategy Index since 1970. All figures are annualized. Average 12 months: 14.74% Best 12 months: 83.06% Worst 12 months: -51.27% Don't put your emergency fund in stocks. Average 3 years: 13.98% Best 3 years: 38.27% Worst 3 years: -19.01% The average investor thinks 3 years is a long time. Average 5 years: 13.96% Best 5 years: 34.18% Worst 5 years: -5.55% The average investor thinks 5 years is a really long time. Average 10 years: 14.38% Best 10 years: 24.61% Worst 10 years: 3.13% The average investor thinks 10 years is an eternity, yet history shows us that the difference between best and worse case scenarios can be in excess of 20% per year. Average 20 years: 13.31% Best 20 years: 20.71% Worst 20 years: 8.26% Best 20 years for risk-free 1 month T-bills: 7.73% At this horizon, the worst 20 year period for the equity index is greater than the best 20 year period for T-bills. But only those with the education, patience, and discipline to endure short term volatility will earn market returns. Global equities would have produced large positive returns, on average, since 1970. But by definition, half of the time returns are below average over any particular time period. Also, in the short term, we see that returns can be substantially negative. This is why the positive average returns of equities in excess of risk free T-bills is known as a risk premium. Investors must be thoughtful about their time horizons and their willingness to take risks when investing. Historical outcomes over various time horizons are great starting points for determining how much equity risk belongs in a portfolio to suit investment objectives. Jesse Blom is a licensed investment advisor and Vice President of Lorintine Capital, LP. He provides investment advice to clients all over the United States and around the world. Jesse has been in financial services since 2008 and is a CERTIFIED FINANCIAL PLANNER™ professional. Working with a CFP® professional represents the highest standard of financial planning advice. Jesse has a Bachelor of Science in Finance from Oral Roberts University. Jesse manages the Steady Momentum service, and regularly incorporates options into client portfolios.