SteadyOptions is an options trading forum where you can find solutions from top options traders. Join Us!

We’ve all been there… researching options strategies and unable to find the answers we’re looking for. SteadyOptions has your solution.

Leveraged Anchor Implementation


This week Steady Options implemented the newest iteration of the Anchor trades – the Leveraged Anchor. This will now officially be tracked. We will also continue to track the Traditional Anchor as well. It is our belief that the Leveraged Anchor will perform better, on a risk adjusted basis than Anchor has, particularly on the upside of the trade.

For those who don’t know what Anchor or the Leveraged Anchor is – a brief background: Anchor Trades were created to address a common desire, the ability to participate in up markets without being at major risk in down markets.  There are a plethora of insurance/annuity products that seek to address this, however such products are often hampered by fees, penalties for cashing out or trading out, and caps on gains.  Anchor was created to address those concerns.  Originally the plan was to take a long position (such as in SPY or other ETFs) and one hundred percent hedge the position using one year put options.  The problem with such an approach is the hedge typically cost between 7%-12% of the total portfolio, which makes it cost prohibitive…unless we can come up with a way to “pay for the hedge.”


Anchor attempts to pay for the hedge by selling calendar put spreads on the theory that short term volatility is priced at a higher premium than long term volatility.  By way of a simple example, a one year out at the money put might cost $12.00.  Yet that same at the money put only one month out likely cost $2.00.  So if you were to hedge your portfolio every month, as opposed to yearly, it would cost twice a much.  All other things being equal, you should be able to cover the cost of a long dated put by selling short dated puts.  Of course it’s not that easy in practice as the markets don’t stay flat.  But that is the basic premise behind Anchor.


Anchor’s primary defect, which was proved over the last 5-10 years of bull markets is that it consistently lags behind the market in up markets.  This makes sense as an Anchor portfolio is only 90% long and devotes about 10% to the hedge.  That means in the best case, Anchor is going to lag the market 10%.  In reality, it typically lags a bit more.  In prolonged bull markets, this leads people to abandon the strategy (often near a market crash).  So to address the concern, we began looking at how to increase performance in bull markets, without hurting to much in down markets.  (There always is a trade off, but the plan is to make it as little as possible).


As discussed in earlier comments on the Leveraged Anchor trade, it carries several benefits that Traditional Anchor and/or simply being long the market does not:


  1. By using deep in the money call positions, as opposed to long stock positions, we are able to gain leverage without having to utilize margin interest.  Given the rising interest rate environment we are in, and the high cost of margin interest rates generally, this can lead to significant savings;
     
  2. When we enter the trade, we look for a long call that has a delta of around 90.  As the market falls, delta will shrink.  For instance, if SPY were to decline ten percent, our long calls would have declined by less than nine percent.  The closer we get to our long strike, the slower this decline;
     
  3. In the event of very large crashes, we can actually make money.
     
  4. Losses are capped.  In the above example, the maximum loss is 9.5%.  This can increase if we keep rolling the short puts throughout the downturn, but in any one “crash,” losses are limited to the ten percentage point mark (in Traditional Anchor this 9.5% max loss in one period is better, coming in at 8.5%).  If we apply a momentum filter as well, then the risk of continuingly losing on the short puts declines;
     
  5. In larger bull markets, the Leveraged Anchor outperforms both Traditional Anchor and simply being long stock as there is actual leverage being used.  Some of this will depend on just how fast the market is rising and how often the long hedge is rolled, but in large bull markets, it should still regularly outperform.  In fact, in any one period where the market grows more than 3.5% to 4.0%, the Leveraged Anchor will outperform simply being long SPY.  The Leveraged version of Anchor will always outperform Traditional Anchor in any up markets.
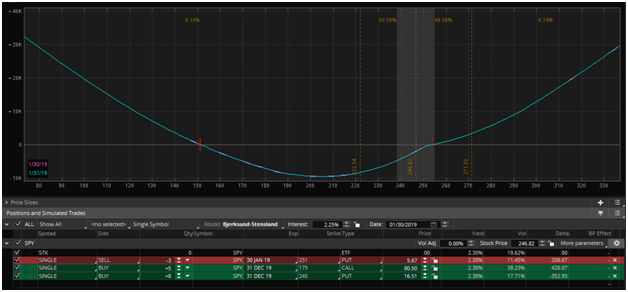
 

image.png


This is the thirty day performance of the Leveraged Anchor portfolio entered today, at different possible market prices.  Note what starts to happen as SPY continues to decline below the 200 point – the value of the portfolio actions starts increasing again.  By SPY 150 the portfolio is back into positive territory – even though the market has declined 40%.  In reality, this is unlikely to happen, but if a fifty percent or more market drop were to occur, this would be a great benefit.  (Note:  this happens with Traditional Anchor as well, just at a slower rate);


One question that must be addressed is just how much leverage to use?  Luckily this is very easy to model on a thirty day period:
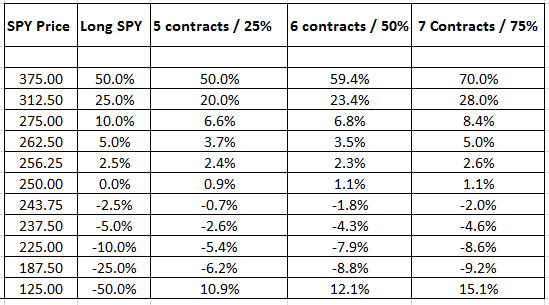
image.png


Above is a table showing the performance of SPY, then using 25% leverage, 50%, and 75% leverage after certain market moves over a thirty day period.  After reviewing the above, and similar tables over longer periods of time, we made a decision that utilizing 50% leverage was optimal.  You of course can adjust, taking on more leverage, or less, as you see fit.  Note the above table does not include any gains from BIL dividends.  That should add around 10 to 20 basis points more performance per month on the leveraged versions.


A word of caution on the above table -- it cannot simply be extracted to longer periods of time because of the short puts.  This is particularly true on the down side.  When we roll the short puts after 25-30 days, we realize a loss on those positions.  If we re-enter the short puts, as the strategy calls for, and the market keeps going down, the above stated losses could increase.

The official trade we entered was posted this week on the forum.
 

The six contracts of SPY gives us control over 600 shares, which at a current price of $249/share, provides control over $149,400 of stock – or right at 1.5x leverage. 


BIL is currently yielding right around 2.3 percent after the most recent interest rate increases.  Given that almost half of our portfolio is invested in this, that will “goose” the portfolio an extra 1.15% per year.  It also provides quite a bit of flexibility to roll the long hedge up, cover losses on the short hedges, or to rebalance the whole portfolio after larger gains.


We’re looking forward to the coming year and continuing to work with everyone at Steady Options.

Related articles:


What Is SteadyOptions?

12 Years CAGR of 127.5%

Full Trading Plan

Complete Portfolio Approach

Real-time trade sharing: entry, exit, and adjustments

Diversified Options Strategies

Exclusive Community Forum

Steady And Consistent Gains

High Quality Education

Risk Management, Portfolio Size

Performance based on real fills

Subscribe to SteadyOptions now and experience the full power of options trading!
Subscribe

Non-directional Options Strategies

10-15 trade Ideas Per Month

Targets 5-7% Monthly Net Return

Visit our Education Center

Recent Articles

Articles

  • Harnessing Monte Carlo Simulations for Options Trading: A Strategic Approach

    In the world of options trading, one of the greatest challenges is determining future price ranges with enough accuracy to structure profitable trades. One method traders can leverage to enhance these predictions is Monte Carlo simulations, a powerful statistical tool that allows for the projection of a stock or ETF's future price distribution based on historical data.

    By Romuald,

    • 1 comment
    • 5,063 views
  • Is There Such A Thing As Risk-Management Within Crypto Trading?

    Any trader looking to build reliable long-term wealth is best off avoiding cryptocurrency. At least, this is a message that the experts have been touting since crypto entered the trading sphere and, in many ways, they aren’t wrong. The volatile nature of cryptocurrencies alone places them very much in the red danger zone of high-risk investments.

    By Kim,

    • 0 comments
    • 1,392 views
  • Is There A ‘Free Lunch’ In Options?


    In olden times, alchemists would search for the philosopher’s stone, the material that would turn other materials into gold. Option traders likewise sometimes overtly, sometimes secretly hope to find something which is even sweeter than being able to play video games for money with Moincoins, that most elusive of all option positions: the risk free trade with guaranteed positive outcome.

    By TrustyJules,

    • 1 comment
    • 17,421 views
  • What Are Covered Calls And How Do They Work?

    A covered call is an options trading strategy where an investor holds a long position in an asset (most usually an equity) and sells call options on that same asset. This strategy can generate additional income from the premium received for selling the call options.

    By Kim,

    • 0 comments
    • 2,865 views
  • SPX Options vs. SPY Options: Which Should I Trade?

    Trading options on the S&P 500 is a popular way to make money on the index. There are several ways traders use this index, but two of the most popular are to trade options on SPX or SPY. One key difference between the two is that SPX options are based on the index, while SPY options are based on an exchange-traded fund (ETF) that tracks the index.

    By Mark Wolfinger,

    • 0 comments
    • 6,990 views
  • Yes, We Are Playing Not to Lose!

    There are many trading quotes from different traders/investors, but this one is one of my favorites: “In trading/investing it's not about how much you make, but how much you don't lose" - Bernard Baruch. At SteadyOptions, this has been one of our major goals in the last 12 years.

    By Kim,

    • 0 comments
    • 4,212 views
  • The Impact of Implied Volatility (IV) on Popular Options Trades

    You’ll often read that a given option trade is either vega positive (meaning that IV rising will help it and IV falling will hurt it) or vega negative (meaning IV falling will help and IV rising will hurt).   However, in fact many popular options spreads can be either vega positive or vega negative depending where where the stock price is relative to the spread strikes.  

    By Yowster,

    • 0 comments
    • 6,580 views
  • Please Follow Me Inside The Insiders

    The greatest joy in investing in options is when you are right on direction. It’s really hard to beat any return that is based on a correct options bet on the direction of a stock, which is why we spend much of our time poring over charts, historical analysis, Elliot waves, RSI and what not.

    By TrustyJules,

    • 0 comments
    • 3,816 views
  • Trading Earnings With Ratio Spread

    A 1x2 ratio spread with call options is created by selling one lower-strike call and buying two higher-strike calls. This strategy can be established for either a net credit or for a net debit, depending on the time to expiration, the percentage distance between the strike prices and the level of volatility.

    By TrustyJules,

    • 0 comments
    • 4,936 views
  • SteadyOptions 2023 - Year In Review

    2023 marks our 12th year as a public trading service. We closed 192 winners out of 282 trades (68.1% winning ratio). Our model portfolio produced 112.2% compounded gain on the whole account based on 10% allocation per trade. We had only one losing month and one essentially breakeven in 2023. 

    By Kim,

    • 0 comments
    • 9,460 views

  • Upvote 1
  Report Article

We want to hear from you!


I wanted to give an update on the Leveraged Anchor since we started trading it at the start of this year:


image.png.01105616e4090f92918349f65e11004d.png


As can be seen, we're up 12.66%, while the market is up 11.9%.


I find this result extremely pleasing, as the market moving up 12% in less than two months is by all accounts a "raging" bull market.  Typically Anchor lags significantly when that happens, but the Leveraged Anchor is staying right with it, even after we had to roll up the original long hedge from 245 to 258.


For those wondering when/if we should roll the long hedge, it will be between SPY 283.5 (5% gain from last roll) and SPY 297 (10% gain from last roll).


Given how well the leveraged version is tracking, I will probably be more inclined to roll on the lower part of the range (most likely around SPY 285).


Share this comment


Link to comment
Share on other sites

Hi Chris, how far dated are the long calls and the long puts? Also, I am assuming you are not counting the SPY dividends when you are doing the comparison. I guess it is probably neutralized by not accounting for BIL interest? Thanks.

Share this comment


Link to comment
Share on other sites

I go as far as I can on the long dated deep in the money calls.  DITM delta is pretty close to 1.


The long puts, when opened, I do as close as to 365 days out as possible.  


I'm not sure what you mean by the comparison?  We do count BIL dividends in our performance -- that's money received after all.  

Share this comment


Link to comment
Share on other sites
1 hour ago, cwelsh said:

I go as far as I can on the long dated deep in the money calls.  DITM delta is pretty close to 1.


The long puts, when opened, I do as close as to 365 days out as possible.  


I'm not sure what you mean by the comparison?  We do count BIL dividends in our performance -- that's money received after all.  

Thanks Chris. What I meant is when you compare the leveraged anchor performance against long SPY, do you include SPY dividends or just SPY price?

Share this comment


Link to comment
Share on other sites

We use the published price of SPY from google finance ... which I think is dividend adjusted, but haven't double checked that

Share this comment


Link to comment
Share on other sites

In some other place you said to hold long calls more than for a year, so it won't be considered short-term gain,

but in Jan 2019 you bought call with expiration Dec 2019, which weans you would need to roll in Dec 2019.

Should not we buy CALLs expiring more than 365 from the day we create the position?

Share this comment


Link to comment
Share on other sites


Create an account or sign in to comment

You need to be a member in order to leave a comment

Create an account

Sign up for a new account. It's easy and free!


Register a new account

Sign in

Already have an account? Sign in here.


Sign In Now

Options Trading Blogs