
This approach can be used to manage risk and leverage market movements more strategically.
Options spreads involve the purchase or sale of two or more options covering the same underlying stock or security. These options can be puts or calls (or sometimes stock too) and be of different options expiries and different strike prices. Each combination produces a different risk and profitability profile, often best visualized using a profit and loss diagram.
Options Spreads Combinations Explained
For example a trader may sell one AAPL 170 call and buy one AAPL 160 call, a type of call spread as defined below.
In all such strategies, a trader uses the chosen combinations of puts and calls to make a profit should a forecast outcome occur.
This is usually that the underlying stock moves a particular way – up in the case of the call spread above – but in more complex trades can be an expected movement in volatility, or to take advantage of the passage of time (we will see how later).
There are three main types of basic options strategies:
1. Vertical Call and Put Spreads
So called because options with the same expiry date are quoted on an options chain quote board vertically.
Hence, vertical spreads involve put and call combination where the expiry date is the same, but the strike price is different.
Examples of vertical options spreads include bull/bear call/put spreads as discussed below, and backspreads discussed separately.
Bull Call Spread Strategy
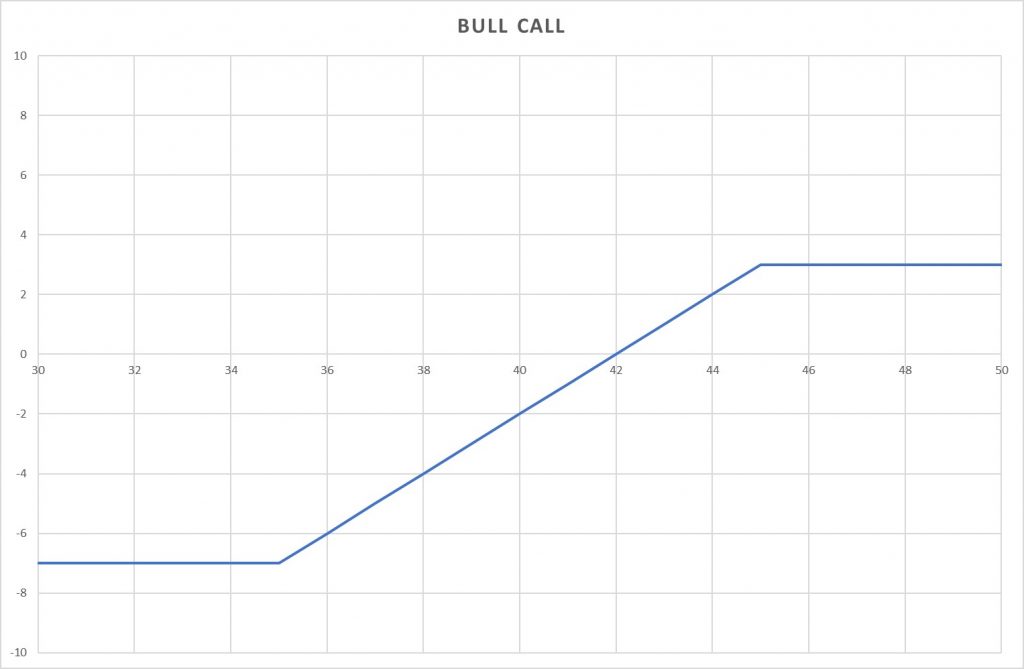
A Bull Call Spread is a simple option combination used to trade an expected increase in a stock’s price, at minimal risk.
It involves buying an option and selling a call option with a higher strike price; an example of a debit spread where there is a net outlay of funds to put on the trade.
So let’s say that IBM is at $127.
It might be possible to buy a June 125 call for $5.50 and sell a June 130 call for $3.00, a net cost of $2.50 per contract:
- Buy IBM June 125 Call 5.50
- Sell IBM June 130 Call 3.00
- Net Cost: $2.50
Should IBM rise and be above $130 at expiration the spread would be worth $5, thus doubling the invested amount.
Of course, if it is lower, the spread is worth less, with the worst case being if IBM falls below $125, whereby the spread is worthless and all money is lost.
The trade is therefore a risk adjusted ‘bet’ that IBM will rise moderately over the next three months.
We’ve covered the bull call options spreads in more detail here.
Bear Call Spread Strategy

A Bear Call Spread is a similar trade used to trade an expected fall in a stock’s price, at minimal risk. It involves selling a call option and buying another with a higher strike price.
Note that this is a credit spread: ie that we receive money for a trade and, if we are correct and the stock does fall, we get to keep this if both options expire worthless.
So, again, with IBM at $127 we might sell the $160 June call and purchase the $165 June call (ie the opposite of before).
It might be possible to sell a June 125 call for $5.50 and buy a June 130 call for $3.00, a net credit of $2.50 per contract:
- Sell IBM June 125 Call 5.50
- Buy IBM June 130 Call 3.00
- Net Credit: $2.50
If IBM falls below $125, as hoped, both options expire and we get to keep the $2.50.
However, should IBM rise and be above $130 at expiration, the spread would have to be bought back at whatever value IBM is above $130. The breakeven point for the trade is $127.50.
The trade expectation is therefore that IBM will fall moderately over the next three months.
Bull Put Spread Strategy

The put version of the bull call spread: i.e. a credit is received for ‘betting’ that stock will move in a particular direction (up, as compared to the bear call spread where the ‘bet’ was for the stock to fall). For example:
- Buy IBM June 125 Put 4.00
- Sell IBM June 130 Put 6.50
- Net Credit: $2.50
The full credit is kept if IBM is above $130 at expiration.
Of course should IBM be between 125 and 130 at expiration, the spread would expire with some value (equal to the stock price less $130). Hence if this value is more than $1.50 – ie the stock price is below $127.50 – the strategy has lost money.
This $127.50 is the break even point of this trade.
Bear Put Spread Strategy

This is the put version of the bull call spread: ie an amount is paid up front which rises in value should the stock will move in the right particular direction (‘down’, compared to ‘up’ for the bear call options spreads). For example:
- Sell IBM June 125 Put 4.00
- Buy IBM June 130 Put 6.50
- Net Cost: $2.50
Should IBM fall below $125 at expiration, the spread is worth $5 (a significant increase from the original $2.50) investment.
However, if the stock is above $127.50, the final value of the spread would be less than the $2.50 paid, and the trade would have made a loss.
We covered the bear put spread in more detail here.
2. Calendar (Horizontal) Spread Strategies
Calendar spread is so called because of options with different expiries being displayed horizontally on an options chain quote board.
They, therefore, involve buying and selling options with different expiry dates, but the same strike price (and, of course, underlying). A calendar spread is a good example or horizontal call or put spread (see more here).
3. Diagonal Spreads
Diagonal spreads are a combination of the two and are complex trades involving options of different strike prices and expiry dates. An example is a LEAP covered call spread detailed later.
Covered Call

One popular strategy that doesn’t really fall into the above categories is the covered call which involves the purchase of stock and sell of a call option. More details on the covered call are available by clicking here.
Advanced Options Combinations: Complex Put and Call Trades
Options have a lot of advantages; but in order to enjoy those advantages, the right strategy is essential. If traders understand how to use all the trading strategies, they can be successful.
We already been through some basic options combinations; now it’s time to go through some more complex strategies.
In particular, we’ll look at some strategies such as the iron condor and butterfly spread (including when to put on and the related options greeks).
Strangle Strategy

This strategy is a neutral one where an out-of-money put and out-of-money call are bought together simultaneously for the same expiration date and asset. It is also called “Long Strangle”.
When Would You Put One On?
When the trader believes that in the near short term, the underlying asset would display volatility, the strangle is apt.
When Does It Make Money?
In this Option strategy, unlimited money is made when the underlying asset makes a volatile move. It could be downwards or upwards, that doesn’t matter.
- Upper Breakeven Point = Strike Price of Long Call + Net Premium Paid
- Lower Breakeven Point = Strike Price of Long Put - Net Premium Paid
When Does It Lose Money?
The spread loses money when the price of the asset on expiration is between the Options’ strike prices.
Loss = Underlying Asset Price = Between Long Call’s Strike Price and Long Put’s Strike Price
Options Greeks
The Delta is neutral, the gamma is always positive, Theta is worst when the asset doesn’t move, and Vega is always positive.
Illustration
Assume that Apple Stock is currently trading around $98. A strangle could be a good strategy if the trader is unsure about the direction in which the stock will go.
So, the trader will buy a 97 put and a 99 call. Let us assume they have the same expiration date and value = $1.65. If the stock rallies past $102.3 (3.3+99), the put would have no value and the call would be in-the-money. If it declines, the put would be ITM and the call would have no value.
Straddle Strategy

Straddle Spread P&L Diagram
This strategy is also called Long Straddle. When a put and call are bought for the same asset, with the same expiration date and same strike price, it is called a straddle.
When Would You Put One On?
When the trader believes that in the near short term, the underlying asset will display significant volatility, a straddle strategy is used.
When Does It Make Money?
Money is made by the strategy no matter which direction the underlying asset moves towards. The move has to be pretty strong, though.
- Upper Breakeven Point = Strike Price of Long Call + Net Premium Paid
- Lower Breakeven Point = Strike Price of Long Put - Net Premium Paid
When Does It Lose Money?
If the price of the underlying asset during expiration is same as the strike price of the bought call and put, the options spread loses money.
Loss = Underlying Asset Price = Long Call/Long Put’s Strike Price
Option Greeks
The Delta is neutral, the Gamma is always positive, Theta rises during expiration, and Vega is always positive.
Illustration
Take a new example and assume that Apple stock is currently around $175. Straddle would be a good strategy if the trader thinks that a huge move would be made on either side. A call and put with the same expiration date as the stock would be bought by the trader. Assume that the 175 Call and the 175 Put cost $10 each. If the stock rallies past $195, the call would be ITM by at least $20 and profits will pour in. If the stock falls below $175, the cost of the straddle would be covered. There is a 50/50 chance of being right about the direction because the cost of the straddle is the maximum loss a trader can incur.
Butterfly
In a butterfly spread strategy, there are three different strike prices. Two calls are bought – one ITM and one OTM. Two ATM calls are sold.
When Would You Put One On?
When the trader believes that the rise or fall of the underlying stock would not be a lot by expiration, a butterfly options spread is the best.
When Does It Make Money?
When the price of the underlying stock does not change at all during expiration, this strategy achieves its maximum profit.
Profit = Underlying Asset Price = Short Calls’ Strike Price
When Does It Lose Money?
When the price of the underlying stock is less than or equal to the strike price ITM long call OR when its price is greater than or equal to the strike price of OTM long call, this options spread loses money.
- Loss = Underlying Asset Price lesser than or ITM Call Strike Price
- Loss = Underlying Asset Price greater than or ITM Call Strike Price
Option Greeks
Delta is always positive, Gamma is lowest at ATM and highest at ITM and OTM, Theta is best when it remains in the profit area, and Vega stays positive as long as the volatility is not too much.
Illustration
Assume that Apple stock is trading at $90. Assume that an 80 call is purchased at $1100, two 90 calls are written at $400 (x2), and a 100 call is purchased at $100. The maximum loss would be the net debit = $400. If the price of Apple at expiration remains the same, the 40 calls and the 50 call would have no value and the profit would be $600. If, however, the stock trades below $80, all the options would be useless. If it trades above $100, the loss from the ITM and OTM calls would be set off by the profit from the ATM calls.
Iron Condor
In this strategy, one OTM put with lower strike is sold after buying one OTM put with strike even lower, and one OTM call with higher strike is sold after buying one OTM call with a strike even higher.
When Would You Put One On?
When the trader believes that low volatility is to be expected, the Iron Condor is chosen.
When Does It Make Money?
When the price of the underlying asset is between the strike prices of the sold call and put, this strategy makes money.
Profit = Underlying Asset Price = Between Short Put Strike Price and Short Call Strike Price
When Does It Lose Money?
This options spread loses money when the price of the stock falls below purchased put’s strike price or rises above purchased call’s strike price. Loss can sometimes be greater than profit.
- Loss = Underlying Asset Price greater than Long Call Strike Price
-
Loss = Underlying Asset Price lesser than Long Put Strike Price
Option Greeks
The Delta is neutral, the Theta should stay positive, Gamma shouldn’t be too large, and negative Vega should be minimized.
Illustration
Apple Stock is trading at $45, Iron Condor would be – buying 35 Put at $50, writing 40 Put at $100, writing 50 Call at $100, and buying 55 Call at $50. The net credit ($100) is the maximum profit. If the expiration value is the same, all long and short options would be useless and maximum profit would be realized. If it falls to $35 or rises to $55, only the 40 Long Put would be useful and the maximum loss of $400 would be realized.
Conclusion
Spread trading can be a valuable component of an investing strategy. In many cases they can significantly reduce the risk compared to calls and puts strategies. It’s important for those considering options spreads (or any investing strategy) to also consider how well options fit within their portfolios. Some will want to use a combination of approaches, but they must first understand the potential risks.
About the Author: Chris Young has a mathematics degree and 18 years finance experience. Chris is British by background but has worked in the US and lately in Australia. His interest in options was first aroused by the ‘Trading Options’ section of the Financial Times (of London). He decided to bring this knowledge to a wider audience and founded epsilonoptions.com in 2012.
Subscribe to SteadyOptions now and experience the full power of options trading at your fingertips. Click the button below to get started!
Join SteadyOptions Now!


There are no comments to display.
Join the conversation
You can post now and register later. If you have an account, sign in now to post with your account.
Note: Your post will require moderator approval before it will be visible.