
A long straddle options spread is the buying side of an options straddle strategy. Buying a put and call option with the same strike price and expiration makes this a market neutral strategy with limited risk and unlimited profit potential. It seeks to capitalise on increased volatility regardless of the direction of underlying asset's price movement.
A short straddle options spread is the selling side of an options straddle strategy. It seeks to capitalise on low volatility where the price of the underlying asset is close to the straddles strike price at expiration
A long straddle is an options spread that involves the simultaneous purchase of a put option and a call option at the same strike price and expiration date. It’s a long-options, market-neutral strategy with limited risk and unlimited profit potential.
A long straddle option strategy is vega positive, gamma positive and theta negative trade. It works based on the premise that both call options and put options have unlimited profit potential but limited loss. If nothing changes and the stock price is stable, the straddle option will lose money every day due to the time decay, and the loss will accelerate as we get closer to expiration.
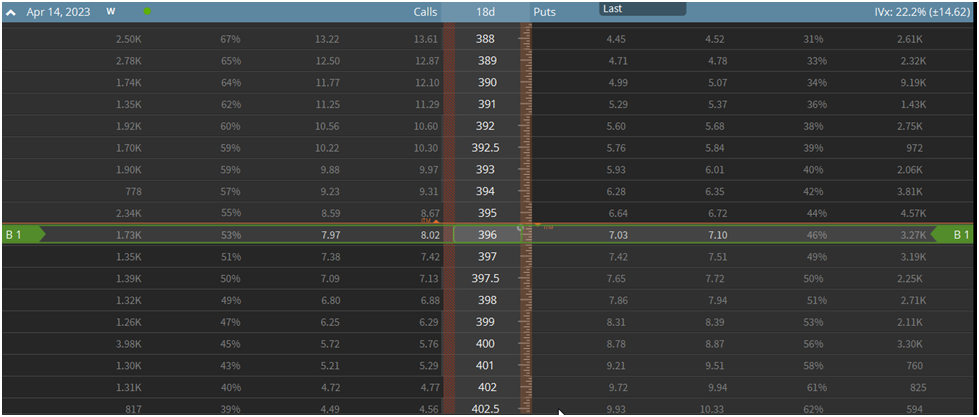
For example, if the SPDR S&P 500 ETF (SPY) trades at $396 per share, we expect a significant move in the S&P 500. Still, we're unsure of the direction of said move. We might purchase an at-the-money (ATM) straddle, which involves buying an ATM put and call options.
In this case, we’d buy the following options:
-
BUY 1 396 Put @ $8.06
-
BUY 1 396 Call @ 9.31
- Total trade cost: $17.37 (net debit)
As you can see, in buying both an at-the-money put and call options, we profit from significant price moves in either direction. However, this comes at a high cost, as you can see by the considerable premium outlay of $17.37, accounting for a bit more than 4% of the total underlying stock price. For this reason, we'd need a significant move in SPY for our position to show a profit.
.thumb.jpg.994f8ab59633ccf69676266a22946b18.jpg)
Characteristics of a Long Straddle Option
The Long Straddle is Market Neutral
A long straddle option is a market-neutral option spread, meaning it makes no attempt to predict the future price of the underlying stock price. Instead, the idea is to profit from a significant price move in the underlying stock price, regardless of whether it moves up or down.
For example, let’s say we purchase the long straddle on SPY that we referenced in the introduction to this article.
If the price of SPY soars over the month, our call option will become profitable, and we can sell it for a profit. The reverse is true for our put option. In either case, we will make money if the price move is more significant than the price of the options we purchased.
While some traders prefer to forecast the price of stocks using technical or fundamental analysis, many seasoned options traders take solace in not having to predict where the price will be next month to make money in the markets.
A market-neutral strategy like the long straddle instead forecasts the future implied volatility of a stock price. Maybe that just seems like a different type of prediction. There's good reason to believe predicting future volatility is more manageable than forecasting future price direction.
While stock prices can go seemingly anywhere, volatility pricing is much more rhythmic. There’s considerable academic evidence that volatility clusters in the short term and mean-reverts over more extended periods. In other words, there's a discernable pattern to market volatility that shrewd traders can profit from.
The Long Straddle Option is Long Volatility
Being "long-volatility" in the options market is synonymous with being a net buyer of options, or simply, "long options." The critical aspect is that the long straddle is a play on volatility rather than price, making the trade vega positive.
In the options market, an at-the-money (ATM) straddle best represents the options market's estimation of future volatility, also known as implied volatility. An easy way to escape all the jargon and technical minutia of the options world is to think of the ATM straddle as the over/under on volatility for that stock price.
Allow me to explain. Let's return to our example in the S&P 500 ETF (SPY). To remind you, here is the ATM straddle pricing for options expiring in 25 days:
SPY Long Straddle:
-
BUY 1 396 Put @ $8.06
-
BUY 1 396 Call @ 9.31
- Total trade cost: $17.37 (net debit)
With our trade cost at $17.37, SPY has to move at least $17.37 in either direction within 25 days for us to profit from this trade. Is that a lot or a little? This is where your trading skills come in.
Options traders use a variety of factors to determine if a straddle is appropriately priced, including where implied volatility is today compared to its historical range, their technical analysis view, how they think the market will react to upcoming events like Federal Reserve meetings, and so on.
Long Straddles Have Defined Risk
Because the long straddle involves buying a put and call option, the maximum risk is defined. It's simply the combined cost of the two options. This provides a significant advantage, as you can be absolutely sure of your worst-case scenario in a long straddle.
Unlike short options strategies, like the short straddle, which have unlimited and undefined maximum risk levels.
For this reason, long straddles are often some of the first options spreads that novice options traders begin to experiment with beyond simply buying single put or call options. It’s just like what they’re used to doing, except it removes the directional element.
Returning to our SPY example from before, the max we can lose in this scenario is $17.37.
The Long Straddle Has Unlimited Profit Potential
The long straddle has theoretically unlimited upside profit potential. This means that if the underlying stock makes a big move in either direction, nothing stops your profits from going on forever, except the stock price goes to zero on the downside.
The Long Straddle Suffers from Time Decay (Short Theta)
When you buy options, you’re betting against the clock. The underlying stock price must make your desired move before the expiration date, or else the options expire worthless. This concept is known as “time decay” or the more technical term, “theta decay.”
Theta is the Options Greek which measures an option position's exposure to the passage of time. The great thing about the options Greeks is you can mathematically derive them. So you know exactly how much an option position will lose per day from the passage of time if all things remain equal.
If we return to our SPY long straddle example, the position has a theta of -0.34, meaning the position will lose about $0.34 in value per day until the expiration date. Keep in mind that theta changes over the life of an option. As the expiration date nears, the value of theta declines, as there is less time value in the option.
So the daily decay will be lower in absolute terms. Still, it can often be higher in terms of the percentage of the position's value if the underlying stock price hasn't moved in your favor. The following chart from Investopedia should put things into perspective:
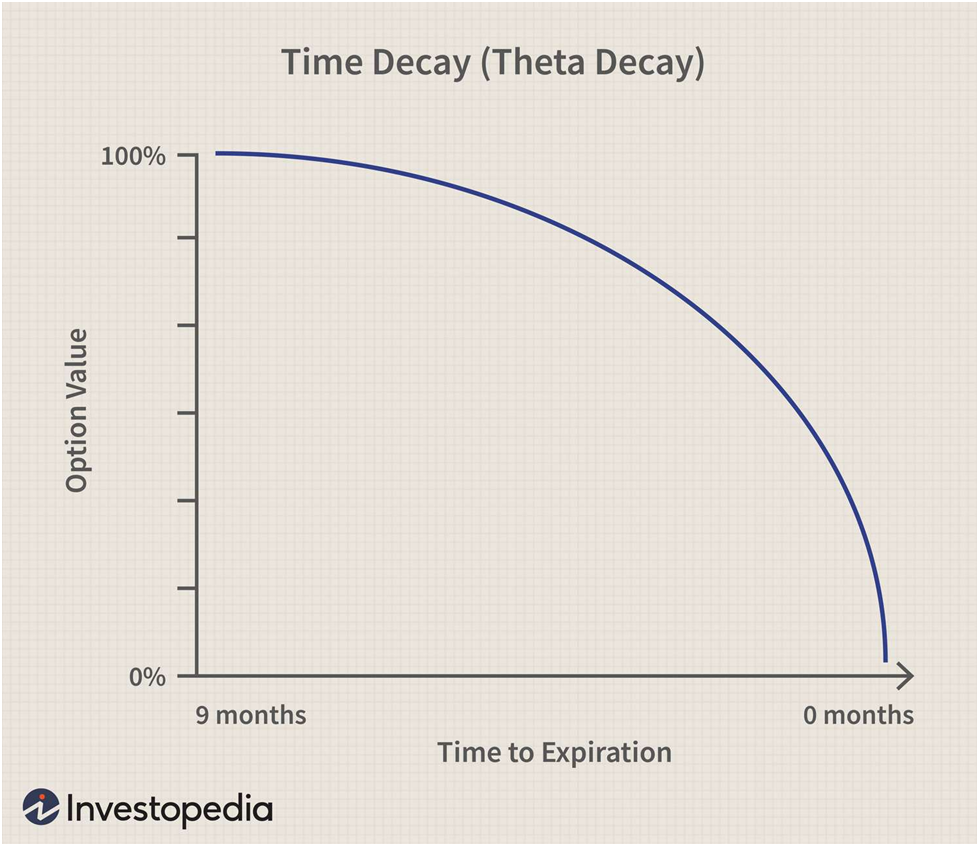
Source: Investopedia
How to Create a Long Straddle position
The long straddle is one of the simplest options spreads out there. It just consists of a long put and call options. Here’s what a long straddle might look like on an options chain:
As you can see, we're buying a put and call option at the same strike price at the same expiration date. The above example shows an at-the-money (ATM) straddle. However, you can structure a straddle to better fit your market view.
For instance, if we move the strike prices of our straddle higher, it'll become more profitable on the downside quicker and take a more significant price move for it to become profitable on the upside. The opposite of this is also true.
Long Straddle Payoff and Max Profit/Loss
Long Straddle Breakeven Prices
The long straddle is very easy to calculate breakeven, max profit, and max loss levels for. This is another reason it's an excellent spread for novices to begin to dip their toes in options spread trading.
As an example, we’ll use our SPY long straddle again and calculate the various levels for it:
SPY Long Straddle:
-
BUY 1 396 Put @ $8.06
-
BUY 1 396 Call @ 9.31
-
Theta: -0.34
- Total trade cost: $17.37 (net debit)
To calculate the upper breakeven price for a long straddle, simply add the total premium paid to the strike price. In this case, you simply add $396 + $17.37 = $413.37. Our upper breakeven price is $413.37.
The lower breakeven price for a long straddle is equally easy to calculate. You simply subtract the total premium paid from the strike price. In this case, that is $396 - $17.37 = $378.63.
To contextualize these prices, I’ll plot them on a chart of SPY:
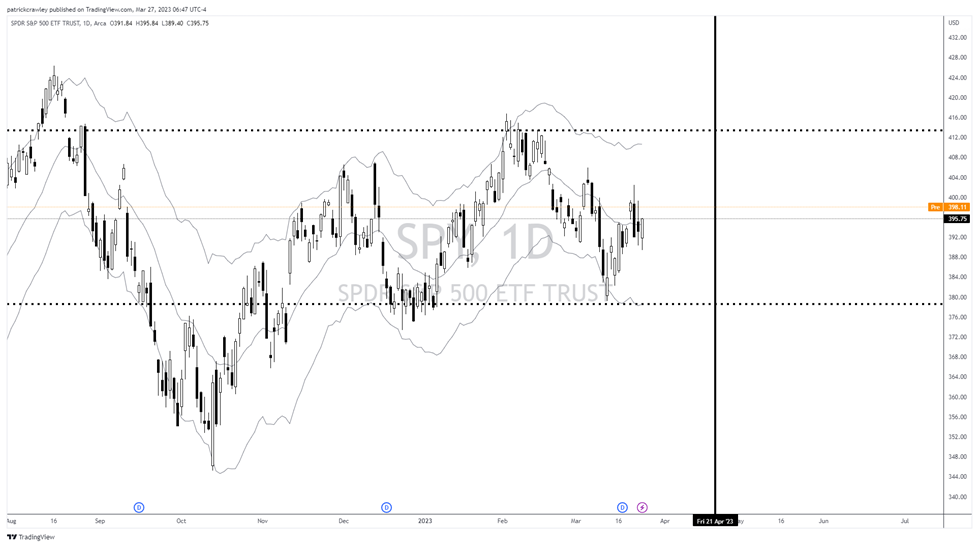
The thick dotted lines represent the upper and lower breakeven prices, while the vertical black link represents the expiration date. The price of SPY needs to exceed either of these levels for our hypothetical long straddle position to show a profit before the expiration date.
This one is easy. The maximum upside profit for a long straddle position is theoretically unlimited. There’s no limit to how high a stock price can go.
However, on the downside, your max profit is only limited by the stock price. Because a stock price can only go to zero, you can calculate the max profit by subtracting the total premium paid from the strike price. In this case, the strike price is $369, and the total premium paid for our SPY long straddle is $17.37, so the max profit from the stock declining is $378.63, which is the same as our lower breakeven price.
Long Straddle Maximum Loss/Risk
Because a long straddle involves buying two options, no formulas are required to calculate your maximum risk. The maximum risk for this position is the total premium paid. In our SPY straddle example, that is $17.37.
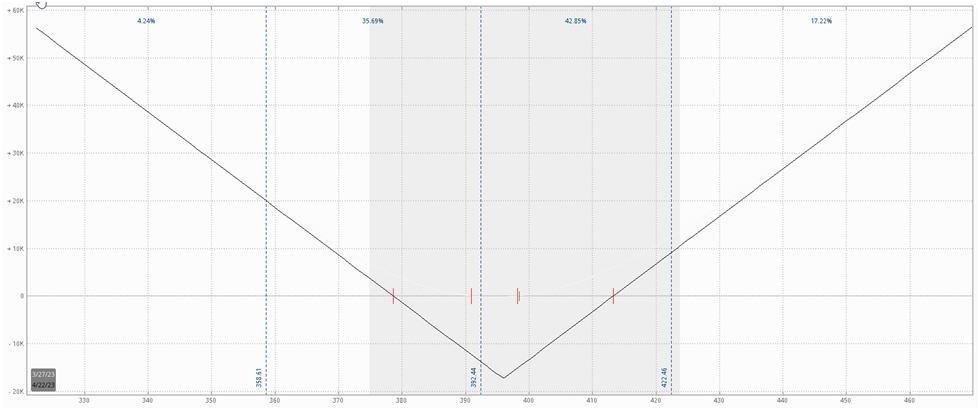
However, the absolute maximum loss in a straddle is pretty rare, as you’ll see when we show you the payoff diagram of the long straddle.
The long straddle payoff diagram is characterized by a V-shape. This is unlike the straddle’s sister spread, the Long Strangle, which is marked by a flattened U-shape.
Here is the straddle payoff diagram:
:max_bytes(150000):strip_icc()/understandingstraddles22-19b55dd41aee458287dda61e4929428a.png)
Let’s look at a real-life example of a long straddle payoff diagram, using our SPY straddle as an example.
As a reminder, here is our SPY long straddle position:
SPY Long Straddle:
-
BUY 1 396 Put @ $8.06
-
BUY 1 396 Call @ 9.31
-
Theta: -0.34
- Total trade cost: $17.37 (net debit)
Long Straddle: Market View
Why Matching Your Market View to Options Trade Structure is Crucial
One thing we're trying to nail home in this reverse straddle primer is the importance of matching your market view to the correct options spread. As an options trader, you're a carpenter, and option spreads are your tools. If you need to tighten a screw, you won't use a hammer but a screwdriver.
So before you add a new spread to your toolbox, it's crucial to understand the market view it expresses. One of the worst things you can do as an options trader is structure a trade that is out of harmony with your market outlook.
This mismatch is often on display with novice traders. Perhaps a meme stock like GameStop went from $10 to $400 in a few weeks. You're confident the price will revert to some historical mean, and you want to use options to express this view. Novice traders frequently only have outright put and call options in their toolbox. Hence, they will use the proverbial hammer to tighten a screw in this situation.
In this hypothetical, a more experienced options trader might use a bear call spread, as it expresses a bearish directional view while also providing short-volatility exposure. But this trader can be infinitely creative with his trade structuring because he understands how to use options to express his market view appropriately.
The nuances of his view might drive him to add skew to the spread, turn it into a ratio spread, and so on.
What Market Outlook Does a Long Straddle Express?
A trader using a long straddle expects a significant increase in IV and/or a significant price movement and has a neutral directional view.
Significantly, a trader who buys a straddle should have a bullish view of volatility. Buying both an at-the-money (ATM) put and call option is a considerable premium outlay, so having the view that volatility is cheap isn't enough to justify buying a straddle. You must expect a huge price move.
Furthermore, it's essential to view volatility in relative terms. While 50% IV might be very high for a stock like Philip Morris (PM), that might be historically low for a stock like Tesla (TSLA).
When To Use a Long Straddle
While there's an infinite number of scenarios where a sophisticated options trader can profitably buy a straddle, there are two basic scenarios where it makes sense to buy a straddle.
The first is when IV is at the bottom of its historical range as measured by something like IV Rank or something similar.
The second is when there’s an upcoming catalyst that you think the options market is underpricing the volatility of.
However, when it comes to event volatility, we find that it's too hard to predict. We'd rather exploit how options markets tend to price event volatility over time rather than predict how the market will react to a blockbuster data release. We'll demonstrate this point by discussing how we trade pre-earnings straddles.
Buying Pre-Earnings Straddles
Earnings releases are the most common form of straddle trading. Companies report earnings four times per year. A simple glance at a stock chart shows that these one-day data releases are often accountable for a large portion of the stock's annual price range.
The typical way options traders play earnings is to identify stocks with consistently underpriced earnings volatility. These stocks change over time, as the market eventually adapts and market makers appropriately price volatility.
However, the glaring issue with earnings straddles is IV crush. As soon as the market digests the earnings report, IV plummets as there’s no longer lingering uncertainty about a potentially terrible or blockbuster report.
Furthermore, there’s a heavy tendency for the market to significantly overprice earnings volatility.
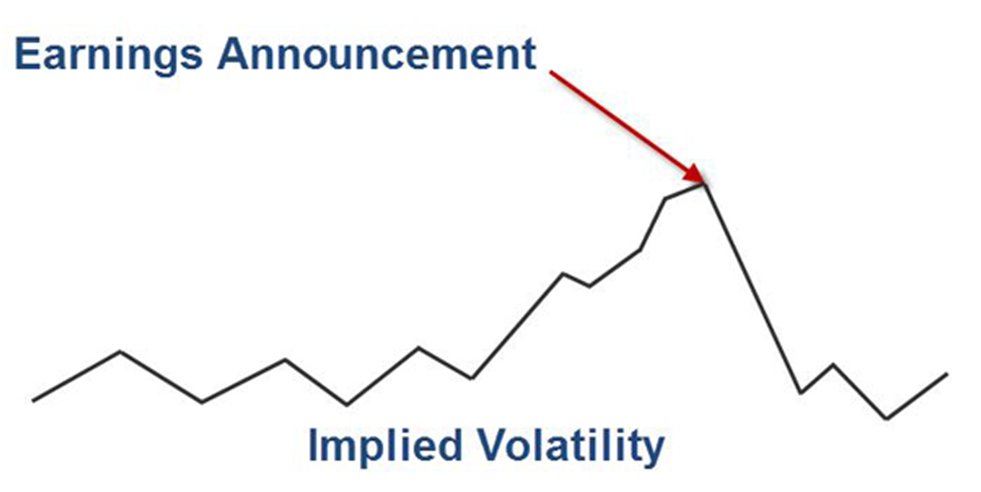
This is why we at SteadyOptions prefer to trade pre-earnings straddles. Because IV (and, in turn, option prices) tends to rise in the lead-up to earnings, we prefer to buy straddles 2-15 days before an earnings release and sell before earnings are even released. Pre-earnings straddles also significantly reduce the main risk of the straddle strategy which is negative theta.
Rather than making a bet on earnings, we're combining momentum trading and the tendency for implied volatility to rise in the lead-up to earnings. We're simply exploiting a repeatable tendency in the options market. This isn't theoretical. You can see the performance of our pre-earnings straddles on our performance page here.
We first described the strategy in our article Exploiting Earnings Associated Rising Volatility.
Using Straddles to Trade Volatility Mean Reversion
Volatility expands and contracts. If you look at a chart of volatility, you'll realize that it seems more like an EKG or sine wave than a stock chart. For instance, as a demonstration point, let's look at the long-term moving average of the S&P 500 Volatility Index (VIX).
The following is a 10-week moving average of the VIX going back to its formulation in 1990:
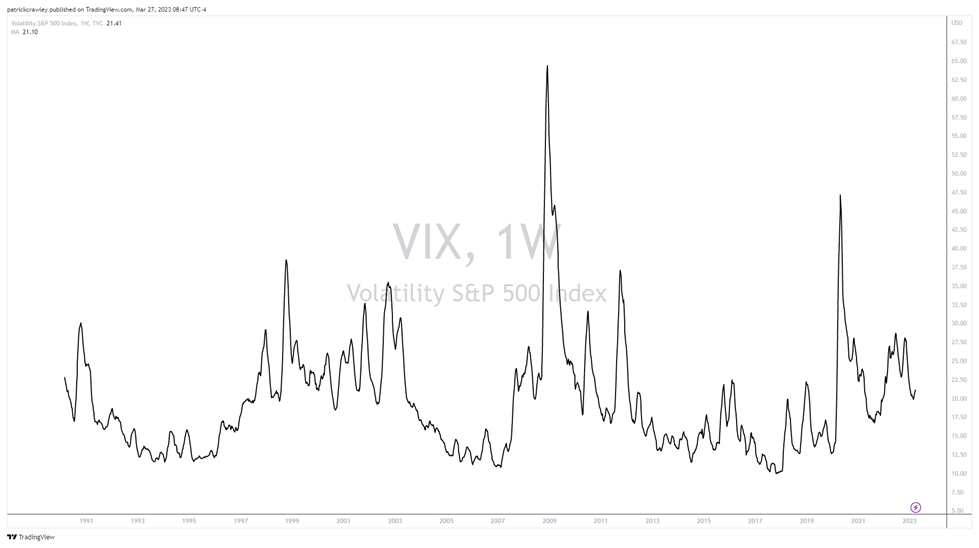
Pretty obvious mean-reverting behavior too. And as we mentioned earlier in this article, this phenomenon is supported by popular quantitative finance academic literature.
One way options traders might exploit this phenomenon is to opportunistically wait for periods where volatility is very low compared to its historical average. There are several ways to measure this, with IV Rank being one popular measure.
To enhance the gains, traders might also consider gamma scalping.
Long Straddle Options Spread Example
Here is a recent example of our straddle strategy.
DIS was scheduled to announce earnings on February 8th. We placed the following trade on February 2th:
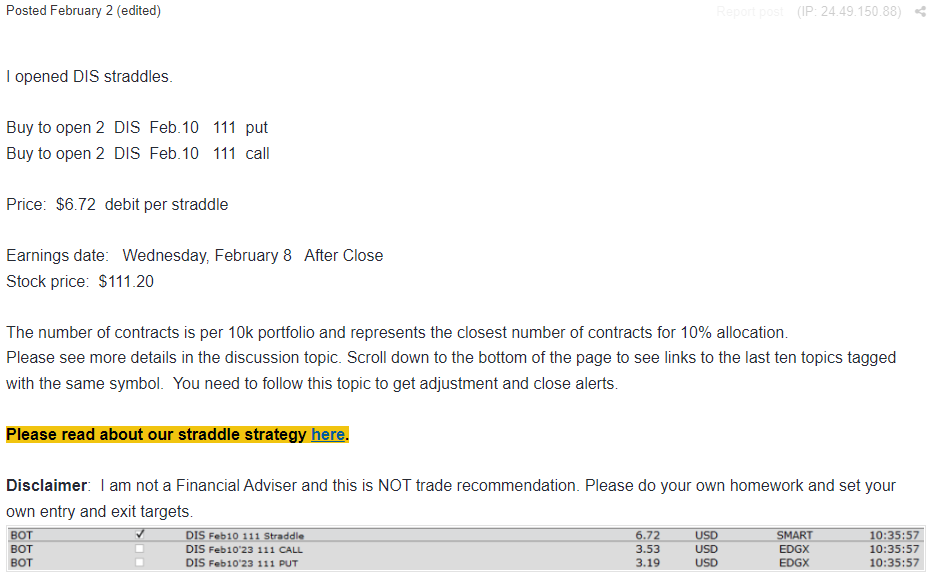
We paid $6.72 for the 111 straddle using options expiring on Feb.10 (2 days after earnings).
3 hours later we were able to close the trade at $7.40 for 10.12% gain.
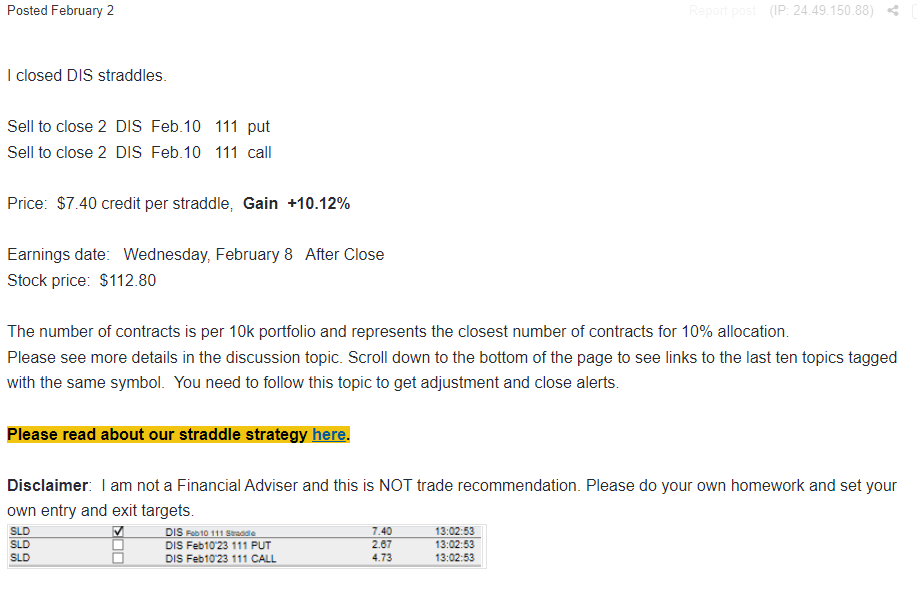
The trade benefited from the stock movement and IV increase.
Straddles Can Be A Cheap Black Swan Insurance
We like to trade pre-earnings straddles/strangles in our SteadyOptions portfolio due to very appealing risk/reward. There are three possible scenarios:
-
Scenario 1: The IV increase is not enough to offset the negative theta and the stock doesn't move. In this case the trade will probably be a small loser. However, since the theta will be at least partially offset by the rising IV, the loss is likely to be in the 7-10% range. It is very unlikely to lose more than 10-15% on those trades if held 2-5 days.
-
Scenario 2: The IV increase offsets the negative theta and the stock doesn't move. In this case, depending on the size of the IV increase, the gains are likely to be in the 5-20% range. In some rare cases, the IV increase will be dramatic enough to produce 30-40% gains.
- Scenario 3: The IV goes up followed by the stock price movement. This is where the strategy really shines. It could bring few very significant winners.
The Biggest Risk When Buying a Long Straddle
Most people buy straddles to participate in event volatility. They're betting that the options market is underpricing the risk of a significant price move in either direction.
But everyone in the market knows that this event is coming. Because the event is a source of considerable uncertainty, implied volatilities in the post-event expirations tend to rise significantly as we get closer to the event.
However, IV tends to plummet once the event is behind us and the market has digested the consequences. This is IV Crush, an effect we've already discussed in this article.
But it's a point that deserves to be driven home. Several backtests show that, on average, holding straddles through earnings (the most popular form of event volatility) is an unprofitable strategy. While there's no doubt that some traders can pick and choose their straddles wisely enough to create a profitable strategy for themselves, we prefer to play the probabilities.
Instead, we exploit the tendency for earnings volatility to get more expensive in the lead-up to the event. However, instead of holding through the earnings release, we choose to sell before it.
The strategy of buying straddles 2-15 days before earnings and selling before the event is our bread and butter strategy. It can produce 5-10% gain in a short period of time with a very limited risk and also serve as a black swan protection because the gains will be very large in case of a black swan event.
Bottom Line
The long straddle is a simple option spread. You buy a put and call at the same strike price and expiration. But simple doesn’t mean easy.
The bottom line is that the straddle is a bet on significant change. A trader buying a long straddle is betting on the stock's price making a sizeable directional price move or that the options market will significantly raise the price of volatility.
A long straddle option can be a good strategy under certain circumstances. However, be aware that if nothing happens in term of stock price movement or IV change, the straddle will bleed money as you approach expiration. It should be used carefully, but when used correctly, it can be very profitable, without guessing the direction.
Like this article? Visit our Options Education Center and Options Trading Blog for more.
Related articles
- How We Trade Straddle Option Strategy
- Straddle Vs. Strangle Options Strategy
- Exploiting Earnings Associated Rising Volatility
- Buying Premium Prior To Earnings - Does It Work?
- Can We Profit From Volatility Expansion Into Earnings?
- Long Straddle: A Guaranteed Win?
- Straddle, Strangle Or Reverse Iron Condor (RIC)?
- Why We Sell Our Straddles Before Earnings
- Selling Strangles Prior To Earnings
- Straddle Option Overview
- Long Straddle Through Earnings Backtest
- Straddles - Risks Determine When They Are Best Used
- Long And Short Straddles: Opposite Structures
- Long Strangle Option Strategy
Subscribe to SteadyOptions now and experience the full power of options trading at your fingertips. Click the button below to get started!
Join SteadyOptions Now!


There are no comments to display.
Join the conversation
You can post now and register later. If you have an account, sign in now to post with your account.
Note: Your post will require moderator approval before it will be visible.