Steady Momentum had an excellent first year of publication, producing significant gains in both of the published strategies. The most popular strategy writes (sells) out of the money puts on equity indexes and ETF’s, and returned 19.1% for the year. The additional strategy that invests in ETF’s and is therefore tradeable in cash accounts, returned 18.4% for the year. Since SteadyOptions is an options centric community and the PutWrite strategy is most popular, I’ll focus most of the analysis on it. Members interested in learning more about the ETF strategy can read this post.
I attempt to make Steady Momentum PutWrite (SMPW) a straightforward and simple strategy to follow without sacrificing anything in the way of expected returns. This allows members to replicate our model portfolio performance with minimal difficulties. The strategy is rules-based and transparent, so members can typically anticipate when a trade is approaching. An imperfect but fair benchmark for our strategy is the ETF PUTW (WisdomTree CBOE S&P 500 PutWrite Strategy Fund). PUTW tracks the CBOE S&P 500 PutWrite Index, which writes monthly at the money puts on the S&P 500 index. PUTW returned 13.55% in 2019, so we were fortunate to beat our benchmark by approximately 5.5%. This means on both an absolute and relative basis SMPW had an excellent year. Additionally, it should be noted that the strategy returns were produced with very little downside with gains in 11 out of 12 months and a maximum drawdown on a month end basis of less than 2% and a Sharpe Ratio of approximately 3.
Members should not expect SMPW to perform at this level(Sharpe Ratio 3) forever. Reviewing the long-term historical data in my various posts is a better guide of what to expect (Sharpe Ratio 0.9).From my decade + experience in advising and guiding clients and subscribers, it’s my job to manage expectations in an intellectually honest manner. When performance is excellent, like we experienced in 2019, I’m forced to remind investors that drawdowns are coming at some point. Likewise, during deep and lengthy drawdowns it’s my job to remind everyone that spring always follows winter and the best returns are often after drawdowns. I can’t predict how long this current runup will last any better than I can predict when drawdowns will end. Please study the long-term performance data closely to know what to expect in both good times and bad, and then simply stay the course for the long-term. The underlying fundamental reasons why the strategy works are both timeless and universal, such as stocks outperforming bonds, bonds outperforming cash, and put options (the equivalent of financial insurance) having a positive (negative) expected return for the seller (buyer).
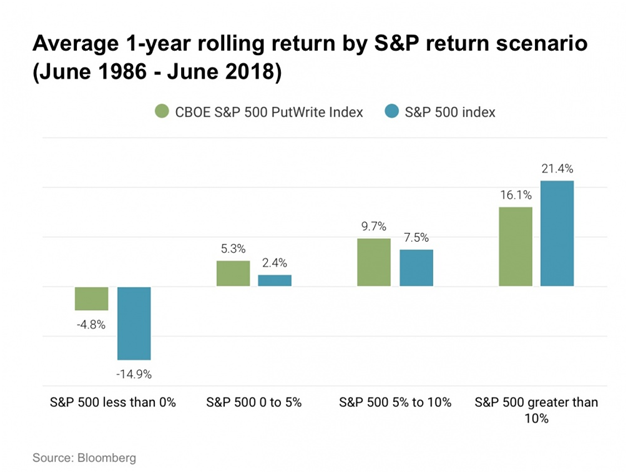
It’s these relationships that explain much of SMPW 2019 results. Writing put options has exposure to the underlying asset performance, so the substantial gains in the S&P 500 (31%), Russell 2000 (25%), and MSCI EAFE (22%) indexes contain the most explanatory power as these are the indexes we write puts on. Since put writing carries a beta to the underlying assets of approximately 0.5, it’s no surprise that the strategy captured less than 100% of the underlying returns. The chart below from this post is particularly illustrative, showing how S&P 500 put writing has performed in historical market environments.

Over time, put writing can match or exceed the returns of the underlying asset with less volatility. Additionally, SMPM has exposure to what academics call the “term premium” (the excess returns of treasury bonds vs. treasury bills) by holding cash collateral in fixed income ETF’s. High quality short and intermediate term bonds had a good year, with IEI returned 5.70% and NEAR returned 3.55%. The PUTW benchmark keeps all collateral in US treasury bills, which returned approximately 2%, so these spreads also explain several percentage points of the SMPW outperformance. SMPW also uses a modest amount of leverage (125% target notional), which was also contributory. Given the 2019 performance of both the underlying stock and bond asset classes, SMPW performed as expected.
Congratulations to all members who participated in 2019 gains, and let’s have a great 2020 together! If there’s any additional questions, please feel free to post feedback on the discussion forum or simply reply to this post.
Jesse Blom is a licensed investment advisor and Vice President of Lorintine Capital, LP. He provides investment advice to clients all over the United States and around the world. Jesse has been in financial services since 2008 and is a CERTIFIED FINANCIAL PLANNER™ professional. Working with a CFP® professional represents the highest standard of financial planning advice. Jesse has a Bachelor of Science in Finance from Oral Roberts University. Jesse manages the Steady Momentum service, and regularly incorporates options into client portfolios.
Related articles:
- Combining Momentum And Put Selling
- Combining Momentum And Put Selling (Updated)
- Steady Momentum ETF Portfolio
- Equity Index Put Writing For The Long Run
- Can You "Time" The Steady Momentum PutWrite Strategy?
- How Steady Momentum Captures Multiple Risk Premiums
- Put Selling: Strike Selection Considerations


Join the conversation
You can post now and register later. If you have an account, sign in now to post with your account.
Note: Your post will require moderator approval before it will be visible.