Search the Community
Showing results for tags 'trademachine'.
Found 15 results
-
.jpg.4dd0dce727c44ef6a3145d6746e2c2bb.jpg) That's great, because it means there is discord, and discord, especially for Apple ahead of earnings has meant a repeating pattern for the clever trader to take advantage of. One week before Apple's earnings would be January 25th, 2018. Apple's Disagreement Sometimes a bullish momentum bet works great -- and in fact, for Apple that has been a strong pattern ahead of earnings. But with a toppy market, sometimes a different approach can work as well. It turns out, over the long-run, for stocks with certain tendencies like Apple Inc, there is a clever way to trade market anxiety or market optimism before earnings announcements with options. This approach has returned 189% with 10 wins and 2 losses over the last 3-years. The Trade Before Earnings What a trader wants to do is to see the results of buying a slightly out of the money strangle one-week before earnings, and then sell that strangle just before earnings. Here is the setup: We are testing opening the position 7 calendar days before earnings and then closing the position 1 day before earnings. This is not making any earnings bet. This is not making any stock direction bet. Once we apply that simple rule to our back-test, we run it on a 40-delta strangle, which is a fancy of saying, buying both the 40-delta call and 40-delta put, for a non-directional bet on volatility. Returns If we did this long strangle in Apple Inc (NASDAQ:AAPL) over the last three-years, but only held it before earnings, using the options closest to 14 days from expiration, we get these results: AAPL Long 40 Delta Strangle % Wins: 83.3% Wins: 10 Losses: 2 % Return: 189% Tap Here to See the Back-test The mechanics of the TradeMachine™ are that it uses end of day prices for every back-test entry and exit (every trigger). We see a 189% return, testing this over the last 12 earnings dates in Apple Inc. We can also see that this strategy hasn't been a winner all the time, rather it has won 10 times and lost 2 times, for a 83.3% win-rate on an one-week trade. Setting Expectations While this strategy has an overall return of 189%, the trade details keep us in bounds with expectations: ➡ The average percent return per trade was 16.9% over 7-days. ➡ The average percent return per winning trade was 21.8% over 7-days. ➡ The average percent return per losing trade was -7.6% over 7-days. We like the comfort of a trade that, when it loses, it isn't a disaster -- at least not historically. Option Trading in the Last Year We can also look at the last year of earnings releases and examine the results: AAPL Long 40 Delta Strangle % Wins: 100% Wins: 4 Losses: 0 % Return: 98.2% Tap Here to See the Back-test In the latest year this pre-earnings option trade has 4 wins and lost 0 times and returned 98.2%. ➡ Over just the last year, the average percent return per trade was 22.3% over 7-days. WHAT HAPPENED We don't always have to look at bullish back-tests in a bull market -- sometimes a straight down the middle volatility pattern pops up. This is it -- this is how people profit from the option market -- finding trading opportunities that avoid earnings risk and work equally well during a bull or bear market. To see how to do this for any stock we welcome you to watch this quick demonstration video: Tap Here to See the Tools at Work Risk Disclosure You should read the Characteristics and Risks of Standardized Options. Past performance is not an indication of future results.
That's great, because it means there is discord, and discord, especially for Apple ahead of earnings has meant a repeating pattern for the clever trader to take advantage of. One week before Apple's earnings would be January 25th, 2018. Apple's Disagreement Sometimes a bullish momentum bet works great -- and in fact, for Apple that has been a strong pattern ahead of earnings. But with a toppy market, sometimes a different approach can work as well. It turns out, over the long-run, for stocks with certain tendencies like Apple Inc, there is a clever way to trade market anxiety or market optimism before earnings announcements with options. This approach has returned 189% with 10 wins and 2 losses over the last 3-years. The Trade Before Earnings What a trader wants to do is to see the results of buying a slightly out of the money strangle one-week before earnings, and then sell that strangle just before earnings. Here is the setup: We are testing opening the position 7 calendar days before earnings and then closing the position 1 day before earnings. This is not making any earnings bet. This is not making any stock direction bet. Once we apply that simple rule to our back-test, we run it on a 40-delta strangle, which is a fancy of saying, buying both the 40-delta call and 40-delta put, for a non-directional bet on volatility. Returns If we did this long strangle in Apple Inc (NASDAQ:AAPL) over the last three-years, but only held it before earnings, using the options closest to 14 days from expiration, we get these results: AAPL Long 40 Delta Strangle % Wins: 83.3% Wins: 10 Losses: 2 % Return: 189% Tap Here to See the Back-test The mechanics of the TradeMachine™ are that it uses end of day prices for every back-test entry and exit (every trigger). We see a 189% return, testing this over the last 12 earnings dates in Apple Inc. We can also see that this strategy hasn't been a winner all the time, rather it has won 10 times and lost 2 times, for a 83.3% win-rate on an one-week trade. Setting Expectations While this strategy has an overall return of 189%, the trade details keep us in bounds with expectations: ➡ The average percent return per trade was 16.9% over 7-days. ➡ The average percent return per winning trade was 21.8% over 7-days. ➡ The average percent return per losing trade was -7.6% over 7-days. We like the comfort of a trade that, when it loses, it isn't a disaster -- at least not historically. Option Trading in the Last Year We can also look at the last year of earnings releases and examine the results: AAPL Long 40 Delta Strangle % Wins: 100% Wins: 4 Losses: 0 % Return: 98.2% Tap Here to See the Back-test In the latest year this pre-earnings option trade has 4 wins and lost 0 times and returned 98.2%. ➡ Over just the last year, the average percent return per trade was 22.3% over 7-days. WHAT HAPPENED We don't always have to look at bullish back-tests in a bull market -- sometimes a straight down the middle volatility pattern pops up. This is it -- this is how people profit from the option market -- finding trading opportunities that avoid earnings risk and work equally well during a bull or bear market. To see how to do this for any stock we welcome you to watch this quick demonstration video: Tap Here to See the Tools at Work Risk Disclosure You should read the Characteristics and Risks of Standardized Options. Past performance is not an indication of future results. -
 WHAT? A quick step back before we thrust forward. The VIX that we see on CNBC or various websites is actually called the 'Spot VIX' and it is not a tradeable asset -- which is to say, you cannot buy or sell the VIX spot. The VIX spot is derived from the implied volatility of SPX options. But the tradeable VIX is actually in the futures market. Here is how VIX futures look as of 8-22-2017, pay special attention to the price for each expiry, and how it rises with each successive date. We can see a futures expiration every week through 9-27-2017, and then it goes monthly. But that's not the key, here. Notice that for every time period further out in the future, the price of the VIX future is higher than the last. This pattern, when the future price is higher than the price behind it, is called "contango." The opposite, for those curious, is called "backwardation." BACK TO THE VXX OPTIONS Jill Malandrino, formerly of TheStreet.com writes it beautifully when she notes: To see how often VIX futures are in contango, or more precisely, how often VXX falls, here is an all-time price chart for trading VXX options: Yep, the VXX is down 99.96% since inception. The reason is simply that VIX is almost always in contango. For the times that VIX falls out of contango, we can see abrupt pops in the VXX which we have highlighted in the image above. Note that the VXX does a reverse split quite often and that's why it isn't trading at $0.01. It splits into fewer shares which raises the stock price -- obviously having no affect on the actual option trade. The most recent split is 8-23-2017. OK - TALK TO ME ABOUT THE TRADE For those that want more information on the trading VXX options and VIX futures and options the CBOE is a treasure trove of information as is Jill's article 5 Misperceptions About VXX. With the price of VXX trending down most of the time, except for rare instances where there are large price spikes, a simple option strategy should work. TRADING VXX OPTIONS We tested buying a put option spread in the VXX using the 90 day options over the last five-years. Here are the results of this VXX options trading strategy: Tap Here to See the back-test We see a 615% return, testing this over the last 5-years. Since we tested the 90 day options, that was 21 trades, in which 17 were winners and 4 were losers. We can see that this VXX trading strategy hasn't been a winner all the time, but it has won a lot. Setting Expectations While this strategy has an overall return of 615%, the trade details keep us in bounds with expectations: ➡ The average percent return per trade was 28.9% (in 90 days). ➡ The average percent return per winning trade was 52.7% (in 90 days). ➡ The average percent return per losing trade was -72.4% (in 90 days). We note that when the VIX goes into backwardation, the VXX does pop aggressively higher and we see that in the average loss, which is actually larger than the average win. Option Trading in the Last Year We can also look at the last year of trading in the VXX options: Tap Here to See the back-test The results are staggeringly similar to the five-year results with a 80% win-rate versus the 81% win-rate over 5-years. ➡ Over just the last year, the average percent return per trade was 50.3% (in 90 days). ➡ The average percent return per winning trade was 63.4% (in 90 days). ➡ The percent return for the one losing trade was -1.9% (in 90 days). The key to this trade has been risk control so the losses aren't harmful and didn't discourage trading the next cycle. WHAT HAPPENED Successful option trading is about preparation -- it's methodical -- it's scientific. This is it -- this is how people profit from the option market, and this can be done with any stock, ETF, ETN or index. To see how to become a scientific option trader and take the guess work out, we welcome you to watch this quick demonstration video: Tap Here to See the Tools at Work Please note that while the trade wins 80% of the time, when it loses, it can lose big time. This is why position sizing is the key. SteadyOptions launched Creating Alpha strategy that uses a different strategy, limiting the loss significantly. This strategy still wins 80% of the time, but the loss is typically limited to ~5%. The winners are obviously much smaller as well. The Incredible Winning Trade In SVXY article describes how this strategy performed in February 2018. The trade is now being implemented using VXX options instead of SVXY options.
 -
 Which is also the same day that Apple and Amazon report. Two trading days before 2-1-2018 would be Tuesday, January 30th. IDEA The idea is quite simple -- trying to take advantage of a pattern in short-term bullishness just before earnings, and then getting out of the way so no actual earnings risk is taken, looking at just the 2 trading days before earnings. The Short-term Option Swing Trade Ahead of Earnings in Alphabet Inc We will examine the outcome of going long a weekly out of the money call option in Alphabet Inc just two trading days before earnings and selling the call the day of the actual news. But, since Alphabet reports earnings after the market closes, this back-test does not take a position on the earnings result -- it closes before the report. Oftentimes we look at option set-ups that are longer-term, and take no directional bet -- this is not one of those times. This is a no holds barred short-term bullish swing trade with options and that's it. It's a bullish bet, so must be conscious of the delta risk. RISK MANAGEMENT We can add another layer of risk management to the back-test by instituting and 40% stop loss and a 40% limit gain. Here is that setting: In English, at the close of each trading day we check to see if the long option is either up or down 40% relative to the open price. If it was, the trade was closed. RESULTS Below we present the back-test stats over the last two-years in Alphabet Inc: GOOGL: Long 40 Delta Call % Wins: 87.5% Wins: 7 Losses: 1 % Return: 136% Tap Here to See the Back-test The mechanics of the TradeMachine™ are that it uses end of day prices for every back-test entry and exit (every trigger). We see a 136% return, testing this over the last 8 earnings dates in Alphabet Inc. That's a total of just 16 days (2-day holding period for each earnings date, over 8 earnings dates). Setting Expectations While this strategy has an overall return of 136%, the trade details keep us in bounds with expectations: ➡ The average percent return per trade was 21% over two-days. ➡ The average percent return per winning trade was 28.4% over two-days. ➡ The percent return for the losing trade was -31% over two-days. Looking at More Recent History We did a multi-year back-test above, now we can look at just the last year: GOOGL: Long 40 Delta Call % Wins: 100% Wins: 4 Losses: 0 % Return: 102% Tap Here to See the Back-test We're now looking at102% returns, on 4 winning trades and 0 losing trades. ➡ The average percent return over the last year per trade was 22%. WHAT HAPPENED Bull markets tend to create optimism, whether it's deserved or not. To see how to find the best performing historical momentum, technical analysis or non-directional trades for any stock using empirical results rather than guesses, we welcome you to watch this quick demonstration video: Tap Here to See the Tools at Work Risk Disclosure You should read the Characteristics and Risks of Standardized Options. Past performance is not an indication of future results.
 -
.jpg.6178fa4730aa8e1399027f69d87872f2.jpg) The news was three-fold fold: (1) The Board of Directors has named Nikesh Arora as its new chief executive officer and chairman of the Board of Directors, effective June 6, 2018. He succeeds Mark McLaughlin, who is transitioning to the role of vice chairman of the Board for Palo Alto Networks. Nikesh Arora was the president and chief operating officer at SoftBank, but he is most famously known as the chief business officer at Google where he took the search business from $2 billion in revenues to over $60 billion in revenues. (2) The company pre-announced that in the fiscal third quarter, total revenue grew 31% percent year over year to $567.1 million, product revenue grew 31 percent year over year to $215.2 million, and billings grew 33 percent year over year to $721.0 million. This $567.1 million number is a whopping earnings beat, where analyst expectations were $545.68 million and in a range of [$540 million, $556.4 million]. The CFO went on to say that "[w]e had a strong fiscal third quarter 2018 and will be reporting top line and bottom line results above all our third quarter guided ranges." (3) Palo Alto Networks will host a conference call for analysts and investors to discuss its fiscal third quarter 2018 results and outlook for its fiscal fourth quarter and full fiscal year 2018 on Monday, June 4th before the market opens. It's that last little bit that changed everything for option traders. PANW burying its news in a late Friday press release leaves the option holders with a coin flip -- not a well measured probability bet. PREFACE On 4-27-2018, we published the dossier Applying The New Standard of Repeating Momentum in Palo Alto Networks Inc. In that dossier we noted that "We have empirically and explicitly demonstrated the repeating pattern of bullish momentum right before earnings. [Further we find] in Palo Alto Networks Inc (NYSE:PANW) exactly the two-tiered pattern we researched again -- stocks that have pre-earnings momentum, and ones with a recent history of large beats that push this momentum into the next quarter." These were the results over the last one-year in Palo Alto Networks of owning a 40 delta (out of the money) call 6-days pre-earnings and selling the call before the earnings announcement. Since PANW reports after the market closes, this test looks at holding the call right until the end of that trading day, and then selling before the announcement. PANW: Long 40 Delta Call % Wins: 100% Wins: 4 Losses: 0 % Return: 175% Tap Here to See the Back-test But all of those results were predicated on avoiding the earnings release and we noted that the back-tested looked at a trade that closes before earnings, so this trade does not make a bet on the earnings result. With the extremely odd news, released at an extremely odd time, this is no longer the case. Earnings be released before the market opens, and will not give option traders the ability to exit any option positions before the earnings event occurs. WHAT HAPPENED In over two decades of option trading and as an option market maker on the exchange floors, I cannot recall a single time when a company announced a new CEO, an earnings beat (but with partial numbers), and then announced earnings on the same day as planned but moved the time from after the market to before the market all at once. Usually when companies pre-release, it's very early -- like Micron did about 6-weeks before earnings in the last couple of weeks. This is simply a case of terrible luck. Now, for anyone with an option position in PANW that intended to avoid the risk of the actual earnings news, we are left with exactly the opposite. Any position now has become a straight down the middle earnings bet - the kind most traders try to avoid at all costs. But, this is it, there is no changing it now. For those that are long calls in the weekly options, the only hope to turn a profit on that position now is for a large earnings move up for the stock. The hope is that the pre-announcement will be backed by even better EPS and guidance news and that the introduction of a Silicon Valley super star as CEO drives the stock higher. But, make no mistake, PANW burying its news in a late Friday press release leaves the option holders with a coin flip -- not a well measured probability bet. Tap Here to See the Tools at Work Risk Disclosure You should read the Characteristics and Risks of Standardized Options. Past performance is not an indication of future results. Ophir Gottlieb is the CEO & Co-founder of Capital Market Laboratories. Mr Gottlieb’s learning background stems from his graduate work in mathematics and measure theory at Stanford University and his time as an option market maker on the NYSE and CBOE exchange floors. He has been cited by Yahoo! Finance, CNNMoney, MarketWatch, Business Insider, Reuters, Bloomberg, Wall St. Journal, Dow Jones Newswire, Barron’s, Forbes, SF Chronicle, Chicago Tribune and Miami Herald and is often seen on financial television. He created and authored what was believed to be the most heavily followed option trading blog in the world for three-years.This article is used here with permission and originally appeared here.
The news was three-fold fold: (1) The Board of Directors has named Nikesh Arora as its new chief executive officer and chairman of the Board of Directors, effective June 6, 2018. He succeeds Mark McLaughlin, who is transitioning to the role of vice chairman of the Board for Palo Alto Networks. Nikesh Arora was the president and chief operating officer at SoftBank, but he is most famously known as the chief business officer at Google where he took the search business from $2 billion in revenues to over $60 billion in revenues. (2) The company pre-announced that in the fiscal third quarter, total revenue grew 31% percent year over year to $567.1 million, product revenue grew 31 percent year over year to $215.2 million, and billings grew 33 percent year over year to $721.0 million. This $567.1 million number is a whopping earnings beat, where analyst expectations were $545.68 million and in a range of [$540 million, $556.4 million]. The CFO went on to say that "[w]e had a strong fiscal third quarter 2018 and will be reporting top line and bottom line results above all our third quarter guided ranges." (3) Palo Alto Networks will host a conference call for analysts and investors to discuss its fiscal third quarter 2018 results and outlook for its fiscal fourth quarter and full fiscal year 2018 on Monday, June 4th before the market opens. It's that last little bit that changed everything for option traders. PANW burying its news in a late Friday press release leaves the option holders with a coin flip -- not a well measured probability bet. PREFACE On 4-27-2018, we published the dossier Applying The New Standard of Repeating Momentum in Palo Alto Networks Inc. In that dossier we noted that "We have empirically and explicitly demonstrated the repeating pattern of bullish momentum right before earnings. [Further we find] in Palo Alto Networks Inc (NYSE:PANW) exactly the two-tiered pattern we researched again -- stocks that have pre-earnings momentum, and ones with a recent history of large beats that push this momentum into the next quarter." These were the results over the last one-year in Palo Alto Networks of owning a 40 delta (out of the money) call 6-days pre-earnings and selling the call before the earnings announcement. Since PANW reports after the market closes, this test looks at holding the call right until the end of that trading day, and then selling before the announcement. PANW: Long 40 Delta Call % Wins: 100% Wins: 4 Losses: 0 % Return: 175% Tap Here to See the Back-test But all of those results were predicated on avoiding the earnings release and we noted that the back-tested looked at a trade that closes before earnings, so this trade does not make a bet on the earnings result. With the extremely odd news, released at an extremely odd time, this is no longer the case. Earnings be released before the market opens, and will not give option traders the ability to exit any option positions before the earnings event occurs. WHAT HAPPENED In over two decades of option trading and as an option market maker on the exchange floors, I cannot recall a single time when a company announced a new CEO, an earnings beat (but with partial numbers), and then announced earnings on the same day as planned but moved the time from after the market to before the market all at once. Usually when companies pre-release, it's very early -- like Micron did about 6-weeks before earnings in the last couple of weeks. This is simply a case of terrible luck. Now, for anyone with an option position in PANW that intended to avoid the risk of the actual earnings news, we are left with exactly the opposite. Any position now has become a straight down the middle earnings bet - the kind most traders try to avoid at all costs. But, this is it, there is no changing it now. For those that are long calls in the weekly options, the only hope to turn a profit on that position now is for a large earnings move up for the stock. The hope is that the pre-announcement will be backed by even better EPS and guidance news and that the introduction of a Silicon Valley super star as CEO drives the stock higher. But, make no mistake, PANW burying its news in a late Friday press release leaves the option holders with a coin flip -- not a well measured probability bet. Tap Here to See the Tools at Work Risk Disclosure You should read the Characteristics and Risks of Standardized Options. Past performance is not an indication of future results. Ophir Gottlieb is the CEO & Co-founder of Capital Market Laboratories. Mr Gottlieb’s learning background stems from his graduate work in mathematics and measure theory at Stanford University and his time as an option market maker on the NYSE and CBOE exchange floors. He has been cited by Yahoo! Finance, CNNMoney, MarketWatch, Business Insider, Reuters, Bloomberg, Wall St. Journal, Dow Jones Newswire, Barron’s, Forbes, SF Chronicle, Chicago Tribune and Miami Herald and is often seen on financial television. He created and authored what was believed to be the most heavily followed option trading blog in the world for three-years.This article is used here with permission and originally appeared here. -

 Backtest 1: The Bullish Option Trade Before Earnings in Alphabet Inc We start with the backtest that shows a higher historical return, but lower historical win rate. We will examine the outcome of getting long a weekly call option in Alphabet Inc 7-days before earnings (using calendar days) and selling the call before the earnings announcement if and only if the stock price is above the 50-day simple moving average. Here's the set-up in great clarity; again, note that the trade closes before earnings since GOOGL reports earnings after the market closes, so this trade does not make a bet on the earnings result. And here is the technical analysis -- note only one is "turned on," and that is the 50-day moving average requirement.: Here's a visual representation, where the stock price 7-days before earnings (circled) is above the 50-day moving average (black line), and therefore triggers a back-test. If the stock price fails the technical requirement, it's fine, we just put a pin in it and check next quarter. RISK MANAGEMENT We can add another layer of risk management to the back-test by instituting and 40% stop loss and a 40% limit gain. Here is that setting: In English, at the close of each trading day we check to see if the long option is either up or down 40% relative to the open price. If it was, the trade was closed. RESULTS Here are the results over the last three-years in Alphabet Inc: GOOGL: Long 40 Delta Call % Wins: 70% Wins: 7 Losses: 3 % Return: 277% Tap Here to See the Back-test The mechanics of the TradeMachine® stock option backtester are that it uses end of day prices for every back-test entry and exit (every trigger). Notice that while this is a 3-year back-test and we would expect four times that many earnings triggers (4 earnings per year), the technical requirement using the 50-day moving average has avoided 2 pre-earnings attempts. In other words -- it's working. Setting Expectations While this strategy had an overall return of 277%, the trade details keep us in bounds with expectations: ➡ The average percent return per trade was 27.6%. Backtest 2: The "Not Bearish" Option Trade Before Earnings in Alphabet Inc With a similar set-up, we examine the same phenomenon -- that is, pre-earnings bullish momentum. But, this time, rather than backtesting owning a call option with the earnings date occurring in the options expiration period, we look at the other side. We examine selling a put spread in options that expire before earnings are announced. Specifically, we look at opening the trade 7 calendar days before earnings, selling a 40 delta / 10 delta put spread, in options that expire the closest to 5-days but before the earnings date. We don't us any stops or limits -- this backtest simply waits until expiration. We also note that the technical requirements with the stock above the 50-day moving average, are identical -- this should result in the same number of trades. This is a trade, unlike the long call, that takes a position on the stock that is simply "not bearish," as opposed to aggressively bullish. RESULTS Here are the results over the last three-years in Alphabet Inc for the short put spread -- again, since these options are selected to expire before the earnings dates, this backtest does not take earnings risk. GOOGL: Short 40 / 10 Delta put Spread % Wins: 100% Wins: 10 Losses: 0 % Return: 161% Tap Here to See the Back-test The mechanics of the TradeMachine® stock option backtester are that it uses end of day prices for every back-test entry and exit (every trigger). Setting Expectations While this strategy had an overall return of 161%, the trade details keep us in bounds with expectations: ➡ The average percent return per trade was 20.5%. Decision So, there you have it in black and white. Owning the pre-earnings call yielded a substantially higher return, but with a 70% win rate, and the 3 losses, they were substantial, averaging -33.5%. returns (losses). This is in contrast to the short put spread which has yielded considerably smaller returns, but no losses in the last 3-years. Is This Just Because Of a Bull Market? It's a fair question to ask if these returns are simply a reflection of a bull market rather than a successful strategy. It turns out that this phenomenon of pre-earnings optimism also worked very well during 2007-2008, when the S&P 500 collapsed into the "Great Recession." The average return for this strategy, by stock, using the Nasdaq 100 and Dow 30 as the study group, saw a 45.3% return over those 2-years. And, of course, these are just 8 trades per stock, each lasting 7 days. * Yes. We are empirical. Back-testing More Time Periods in Alphabet Inc Now we can look at just the last year as well. We start with the long call back-test in which the options include the earnings date within the expiration period. GOOGL: Long 40 Delta Call % Wins: 100.00% Wins: 2 Losses: 0 % Return: 115% Tap Here to See the Back-test And now we can look at the short put spread in which the options exclude the earnings date within the expiration period. GOOGL: Short 40 / 10 Delta Put Spread % Wins: 100.00% Wins: 2 Losses: 0 % Return: 42.3% Tap Here to See the Back-test Again, the contrast is clear, but the decision is personal and not obvious. WHAT HAPPENED Don't trade blind, please. Try pattern recognition. Risk Disclosure Past performance is not an indication of future results. Ophir Gottlieb is the CEO & Co-founder of Capital Market Laboratories. Mr Gottlieb’s learning background stems from his graduate work in mathematics and measure theory at Stanford University and his time as an option market maker. He has been cited by Yahoo! Finance, CNNMoney, MarketWatch, Business Insider, Reuters, Bloomberg, Wall St. Journal, Dow Jones Newswire, Barron’s, Forbes, SF Chronicle, Chicago Tribune and Miami Herald. He created and authored what was believed to be the most heavily followed option trading blog in the world for three-years. Related articles: The Incredible Option Trade In VXX Earnings Momentum Trade In Oracle Post Earnings Option Trade In Facebook Option Trade After Earnings In AutoZone Pre-Earnings Momentum Trade In Netflix Microsoft Pre-Earnings Momentum Trade Post Earnings Trade In FedEx Pre Earnings Pattern In Apple Earnings Momentum Trading In Google PANW Broke The Golden Rule How To Profit From PayPal Volatility
 -
 These are all trade-able events, at anytime, without concern for earnings. Today we look at exactly what has worked for Apple (AAPL). Take well bounded risk, small, and direction-less, and let a tweet, a news headline, an Apple headline, a day of pessimism or a day of optimism, whatever -- move the market, as it has so often in this new volatility regime. The Short-term Option Volatility Trade in Apple Inc We will examine the outcome of going long a short-term at-the-money (50 delta) straddle, in options that are the closest to seven-days from expiration. But we have a rule -- it's a stop and a limit of 10%, and, we back-test re-opening the position immediately, as opposed to waiting for 5-days later. Here is the stock chart for Apple since October 1st -- focus on the volatility, not the direction -- these are daily candles. Chart from CMLviz.com We can volatility and a general downtrend, in fact, a 14% drop in less than 6 weeks. But let's not worry about direction, let's try to find a back-test that benefits from that volatility that is in fact up 92% in just six-weeks and takes no stock direction risk at all. Here it is, first, we enter the long straddle. Second, we set a very specific type of stop and limit: At the end of each day, the back-tester checks to see if the long straddle is up or down 10%. If it is, it closes the position, and re-opens at the same time, another long straddle, but this one now re-adjusted for what is the newest at-the-money strike price. We have a full blown tutorial write up on this type of stop/limit behavior in the Discover Tab: Stops & Limits Roll Timing What does "open again at normal time" vs "immediately" mean? The Results We back-tested this only over the last six-weeks. We are hyper focusing not on a long drawn out pattern, but rather this time, right now, this period of volatility. AAPL: Long 50 Delta Straddle % Wins: 58.8% Wins: 10 Losses: 7 % Return: 92% Tap Here to See the Back-test The mechanics of the TradeMachine® are that it uses end of day prices for every back-test entry and exit (every trigger). Notice that this has triggered a trade 17 times in the last six-weeks and while the stock has dropped 14%, the option strategy, which takes no directional positioning, is up more than 92% in six-weeks time. This is a fast moving, re-adjusting straddle. The idea is simple: Take well bounded risk, small, and direction-less, and let a tweet, a news headline, an Apple headline, a day of pessimism or a day of optimism, whatever -- move the market, as it has so often in this new volatility regime. Setting Expectations Since we use end of day open and closes, while this strategy has an overall return of 92%, the trade details keep us in bounds with expectations: ➡ The average percent return per trade was 11%. ➡ The average percent return per winning trade was 29.9%. ➡ The percent return per losing trade was -16%. Not only are we seeing a high winning percentage, but also that the average win is twice as large as the average loss. Further, this trade takes no stock direction risk at all. WHAT HAPPENED When the market shifts, we need a minimum amount of data to adjust, and succeed. This is how people profit from the option market -- it's not luck, it's preparation. Tap Here to See the Tools at Work Risk Disclosure You should read the Characteristics and Risks of Standardized Options. Past performance is not an indication of future results. Trading futures and options involves the risk of loss. Please consider carefully whether futures or options are appropriate to your financial situation. Only risk capital should be used when trading futures or options. Investors could lose more than their initial investment. Past results are not necessarily indicative of future results. The risk of loss in trading can be substantial, carefully consider the inherent risks of such an investment in light of your financial condition. Please note that the executions and other statistics in this article are hypothetical, and do not reflect the impact, if any, of certain market factors such as liquidity and slippage. Ophir Gottlieb is the CEO & Co-founder of Capital Market Laboratories. Mr Gottlieb’s learning background stems from his graduate work in mathematics and measure theory at Stanford University and his time as an option market maker. He has been cited by Yahoo! Finance, CNNMoney, MarketWatch, Business Insider, Reuters, Bloomberg, Wall St. Journal, Dow Jones Newswire, Barron’s, Forbes, SF Chronicle, Chicago Tribune and Miami Herald. He created and authored what was believed to be the most heavily followed option trading blog in the world for three-years. Related articles: The Incredible Option Trade In VXX Earnings Momentum Trade In Oracle Post Earnings Option Trade In Facebook Option Trade After Earnings In AutoZone Pre-Earnings Momentum Trade In Netflix Microsoft Pre-Earnings Momentum Trade Post Earnings Trade In FedEx Pre Earnings Pattern In Apple Earnings Momentum Trading In Google PANW Broke The Golden Rule How To Profit From PayPal Volatility
 -
The Volatility Option Trade In Alibaba
Ophir Gottlieb posted a article in SteadyOptions Trading Blog
 It's time to take advantage of volatility. Fear, uncertainty, doubt, unclear news headlines -- these are all trade-able events, at anytime, without concern for earnings. Today we look at exactly what has worked. Across the board for several technology companies, and specifically today, we look at Alibaba (BABA). Please check your Trade Machine for AAPL, NVDA, and others. Now is our time. Take well bounded risk, small, and direction-less, and let a tweet, a news headline, an Apple headline, a day of pessimism or a day of optimism, whatever -- move the market, as it has so often in this new volatility regime. Take well bounded risk, small, and direction-less, and let a tweet, a news headline, an Apple headline, a day of pessimism or a day of optimism, whatever -- move the market, as it has so often in this new volatility regime. The Short-term Option Volatility Trade in Alibaba Group Holding We will examine the outcome of going long a short-term at-the-money (50 delta) straddle, in options that are the closest to five-days from expiration. But we have a rule -- it's a stop and a limit of 10%, and, we back-test re-opening the position immediately, as opposed to waiting for 5-days later. Here is the stock chart for Alibaba since October 1st -- focus on the volatility, not the direction -- these are daily candles. So we see the wild gyrations -- let's not worry about direction, let's try to find a back-test that benefits from that volatility. Here it is, first, we enter the long straddle. Second, we set a very specific type of stop and limit: At the end of each day, the back-tester checks to see if the long straddle is up or down 10%. If it is, it closes the position, and re-opens at the same time, another long straddle, but this one now re-adjusted for what is the newest at-the-money strike price. We have a full blown tutorial write up on this type of stop/limit behavior in the Discover Tab: Stops & Limits Roll Timing What does "open again at normal time" vs "immediately" mean? The Results We back-tested this only over the last six-weeks. We are hyper focusing not on a long drawn out pattern, but rather this time, right now, this period of volatility. Tap Here to See the Back-test The mechanics of the TradeMachine® are that it uses end of day prices for every back-test entry and exit (every trigger). Notice that this has triggered a trade 20 times in the last six-weeks. This is a fast moving, re-adjusting straddle. The idea is simple: Take well bounded risk, small, and direction-less, and let a tweet, a news headline, an Apple headline, a day of pessimism or a day of optimism, whatever -- move the market, as it has so often in this new volatility regime. Setting Expectations Since we use end of day open and closes, while this strategy has an overall return of 408%, the trade details keep us in bounds with expectations: ➡ The average percent return per trade was 23.4%. ➡ The average percent return per winning trade was 49.2%. ➡ The percent return per losing trade was -24.6%. Not only are we seeing a high winning percentage, but also that the average win is twice as large as the average loss. Further, this trade takes no stock direction risk at all. WHAT HAPPENED This is why you have a Trade Machine membership. We can ride the evergreen patterns, and we have, for years. But when the market shifts, we need a minimum amount of data to adjust, and succeed. This is how people profit from the option market. Tap Here to See the Tools at Work Risk Disclosure You should read the Characteristics and Risks of Standardized Options. Past performance is not an indication of future results. Trading futures and options involves the risk of loss. Please consider carefully whether futures or options are appropriate to your financial situation. Only risk capital should be used when trading futures or options. Investors could lose more than their initial investment. Past results are not necessarily indicative of future results. The risk of loss in trading can be substantial, carefully consider the inherent risks of such an investment in light of your financial condition. Please note that the executions and other statistics in this article are hypothetical, and do not reflect the impact, if any, of certain market factors such as liquidity and slippage. Related articles: The Incredible Option Trade In VXX The Volatility Option Trade In Apple Earnings Momentum Trade In Oracle Post Earnings Option Trade In Facebook Option Trade After Earnings In AutoZone Pre-Earnings Momentum Trade In Netflix Microsoft Pre-Earnings Momentum Trade Post Earnings Trade In FedEx Pre Earnings Pattern In Apple Earnings Momentum Trading In Google PANW Broke The Golden Rule How To Profit From PayPal Volatility
 -
Option Trade After Earnings in AutoZone
Ophir Gottlieb posted a article in SteadyOptions Trading Blog
 For AutoZone Inc, irrespective of whether the earnings move was up or down, if we waited two-days after the stock move, and then sold a 3-week at out of the money iron condor (using monthly options), the results were quite strong. This trade opens two calendar after earnings were announced to try to let the stock find equilibrium after the earnings announcement. We can test this approach without bias with a custom option back-test. Here is our earnings set-up: Rules * Open the short iron condor two calendar days after earnings * Close the iron condor 21 calendar days after earnings * Use the options closest to 30 days from expiration (but at least 21-days). And a note before we see the results: This is a straight down the middle volatility bet -- this trade wins if the stock is not volatile the three weeks following earnings and it will stand to lose if the stock is volatile. RISK MANAGEMENT We can add another layer of risk management to the back-test by instituting and 40% stop loss and a 40% limit gain. Here is that setting: In English, at the close of each trading day we check to see if the entire iron condor is either up or down 40% relative to the open price. If it was, the trade was closed. Trade Discovery We found this trade by using the TradeMachine® Pro scanner, looking at the S&P 500, post-earnings back-tests and specifically the short iron condor. Then we looked at 3-year back-tests and sorted by earnings date. We can see AZO has the highest win rate and a rather large historical returns. This can be a nice diversification for those with generally long volatility positions (long options). We do note the rather hectic stock price move after the latest earnings results were announced and a general downward trend. Here is a stock chart: The back-tester computes all calculations using end of day prices, so two-days after earnings would be 9-21-2017 at (or near) the close. To adjust an iron condor so that it is symmetric to downside and upside risk, you can read about option skew and the impact on iron condors here: Option Skew -- What it is and Why It Exists RESULTS If we sold this 35/15 delta iron condor in AutoZone Inc (NYSE:AZO) over the last three-years but only held it after earnings we get these results: Tap Here to See the Back-test We see a 282.5% return, testing this over the last 12 earnings dates in AutoZone Inc. That's a total of just 228 days (19 days for each earnings date, over 12 earnings dates). We can also see that this strategy hasn't been a winner all the time, rather it has won 11 times and lost 1 times, for a 92% win-rate. Setting Expectations While this strategy had an overall return of 282.5%, the trade details keep us in bounds with expectations: ➡ The average percent return per trade was 22.82% over 19-days. ➡ The average percent return per winning trade was 24.94% over 19-days. ➡ The average percent return per losing trade was -0.51% over 19-days. Over the Last Year We can see similarly strong results over the last year: Tap Here to See the Back-test We see a 97% return, testing this over the last 4 earnings dates in AutoZone Inc, with 4 wins and 0 losses in that short-time period. Setting Expectations While this strategy had an overall return of 97%, the trade details keep us in bounds with expectations: ➡ The average percent return per trade was 29% over 19-days. WHAT HAPPENED This is it -- this is how people profit from the option market -- finding trading opportunities that avoid earnings risk and work equally well during a bull or bear market. To see how to do this for any stock we welcome you to watch this quick demonstration video: Tap Here to See the Tools at Work Thanks for reading. Risk Disclosure You should read the Characteristics and Risks of Standardized Options. Past performance is not an indication of future results. Trading futures and options involves the risk of loss. Please consider carefully whether futures or options are appropriate to your financial situation. Only risk capital should be used when trading futures or options. Investors could lose more than their initial investment. Past results are not necessarily indicative of future results. The risk of loss in trading can be substantial, carefully consider the inherent risks of such an investment in light of your financial condition.
 -
Apple Options Trade After an Earnings Beat
Ophir Gottlieb posted a article in SteadyOptions Trading Blog
.jpg.20ae6b78978aba7c963801d659caf403.jpg) There is a bullish momentum pattern in Apple Inc (NASDAQ:AAPL) stock 2 calendar days after earnings, if and only if the stock showed a large gap up after the actual earnings announcement. This is a conditional entry -- the company reports earnings and if the stock move off of that report is a 3% gain or larger, then a bullish position is back-tested looking for continuing momentum. The event is rare, but when it has occurred, the back-test results are noteworthy. Apple Inc (NASDAQ:AAPL) Earnings In Apple Inc, if the stock move immediately following an earnings result was large (3% or more to the upside), if we test waiting two-days after that earnings announcement and then bought a three-week at the money (50 delta) call, the results were quite strong. This back-test opens two-days after earnings were announced to try to find a stock that continues an upward trajectory after an earnings rally. Simply owning options after earnings, blindly, is likely not a good trade, but hand-picking the times and the stocks to do it in can be useful. We can test this approach without bias with a custom option back-test. Here is the timing set-up around earnings: Rules Condition: Wait for the one-day stock move off of earnings, and if it shows a 3% gain or more in the underlying, then, follow these rules: Open the long at-the-money call two-calendar days after earnings. Close the long call 14 calendar days after earnings. Use the options closest to 21 days from expiration (but more than 14 days). This is a straight down the middle direction trade -- this trade wins if the stock is continues on an upward trajectory after a large earnings move the two-weeks following earnings and it will stand to lose if the stock does not rise. This is not a silver bullet -- it's a trade that needs to be carefully examined. But, this is a conditional back-test, which is to say, it only triggers if an event before it occurs. RISK CONTROL Since blindly owning calls can be a quick way to lose in the option market, we will apply a tight risk control to this analysis as well. We will add a 40% stop loss and a 40% limit gain. In English, at the close of every trading day, if the call is up 40% from the price at the start of the trade, it gets sold for a profit. If it is down 40%, it gets sold for a loss. This also has the benefit of taking profits if there is a stock rally early in the two-week period rather than waiting to close 14-days later. Another risk reducing move we made was to use 21-day options and only hold them for 14-days so the trade doesn't suffer from total premium decay. RESULTS If we bought the at-the-money call in Apple Inc (NASDAQ:AAPL) over the last three-years but only held it after earnings and after an earnings pop higher, we get these results: AAPL Long 50 Delta Call % Wins: 80% Wins: 4 Losses: 1 % Return: 151.9% Tap Here to See the Back-test The mechanics of the TradeMachine® are that it uses end of day prices for every back-test entry and exit (every trigger). Looking at Averages The overall return was 151.9%; but the trade statistics tell us more with average trade results: ➡ The average return per trade was 46.54% over each 12-day period. ➡ The average return per winning trade was 76.92% over each 12-day period. ➡ The average return per losing trade was -75% over each 12-day period. WHAT HAPPENED Bullish momentum and sentiment after of earnings can be quite powerful with the tailwind of an earnings beat. This is just one example of what has become a tradable phenomenon in Apple. To identify patterns that have repeated over and over again, empirically, we welcome you to watch this quick demonstration video: Tap Here to See the Tools at Work Risk Disclosure You should read the Characteristics and Risks of Standardized Options. Ophir Gottlieb is the CEO & Co-founder of Capital Market Laboratories. Mr Gottlieb’s learning background stems from his graduate work in mathematics and measure theory at Stanford University and his time as an option market maker on the NYSE and CBOE exchange floors. He has been cited by Yahoo! Finance, CNNMoney, MarketWatch, Business Insider, Reuters, Bloomberg, Wall St. Journal, Dow Jones Newswire, Barron’s, Forbes, SF Chronicle, Chicago Tribune and Miami Herald and is often seen on financial television. He created and authored what was believed to be the most heavily followed option trading blog in the world for three-years.This article is used here with permission and originally appeared here.
There is a bullish momentum pattern in Apple Inc (NASDAQ:AAPL) stock 2 calendar days after earnings, if and only if the stock showed a large gap up after the actual earnings announcement. This is a conditional entry -- the company reports earnings and if the stock move off of that report is a 3% gain or larger, then a bullish position is back-tested looking for continuing momentum. The event is rare, but when it has occurred, the back-test results are noteworthy. Apple Inc (NASDAQ:AAPL) Earnings In Apple Inc, if the stock move immediately following an earnings result was large (3% or more to the upside), if we test waiting two-days after that earnings announcement and then bought a three-week at the money (50 delta) call, the results were quite strong. This back-test opens two-days after earnings were announced to try to find a stock that continues an upward trajectory after an earnings rally. Simply owning options after earnings, blindly, is likely not a good trade, but hand-picking the times and the stocks to do it in can be useful. We can test this approach without bias with a custom option back-test. Here is the timing set-up around earnings: Rules Condition: Wait for the one-day stock move off of earnings, and if it shows a 3% gain or more in the underlying, then, follow these rules: Open the long at-the-money call two-calendar days after earnings. Close the long call 14 calendar days after earnings. Use the options closest to 21 days from expiration (but more than 14 days). This is a straight down the middle direction trade -- this trade wins if the stock is continues on an upward trajectory after a large earnings move the two-weeks following earnings and it will stand to lose if the stock does not rise. This is not a silver bullet -- it's a trade that needs to be carefully examined. But, this is a conditional back-test, which is to say, it only triggers if an event before it occurs. RISK CONTROL Since blindly owning calls can be a quick way to lose in the option market, we will apply a tight risk control to this analysis as well. We will add a 40% stop loss and a 40% limit gain. In English, at the close of every trading day, if the call is up 40% from the price at the start of the trade, it gets sold for a profit. If it is down 40%, it gets sold for a loss. This also has the benefit of taking profits if there is a stock rally early in the two-week period rather than waiting to close 14-days later. Another risk reducing move we made was to use 21-day options and only hold them for 14-days so the trade doesn't suffer from total premium decay. RESULTS If we bought the at-the-money call in Apple Inc (NASDAQ:AAPL) over the last three-years but only held it after earnings and after an earnings pop higher, we get these results: AAPL Long 50 Delta Call % Wins: 80% Wins: 4 Losses: 1 % Return: 151.9% Tap Here to See the Back-test The mechanics of the TradeMachine® are that it uses end of day prices for every back-test entry and exit (every trigger). Looking at Averages The overall return was 151.9%; but the trade statistics tell us more with average trade results: ➡ The average return per trade was 46.54% over each 12-day period. ➡ The average return per winning trade was 76.92% over each 12-day period. ➡ The average return per losing trade was -75% over each 12-day period. WHAT HAPPENED Bullish momentum and sentiment after of earnings can be quite powerful with the tailwind of an earnings beat. This is just one example of what has become a tradable phenomenon in Apple. To identify patterns that have repeated over and over again, empirically, we welcome you to watch this quick demonstration video: Tap Here to See the Tools at Work Risk Disclosure You should read the Characteristics and Risks of Standardized Options. Ophir Gottlieb is the CEO & Co-founder of Capital Market Laboratories. Mr Gottlieb’s learning background stems from his graduate work in mathematics and measure theory at Stanford University and his time as an option market maker on the NYSE and CBOE exchange floors. He has been cited by Yahoo! Finance, CNNMoney, MarketWatch, Business Insider, Reuters, Bloomberg, Wall St. Journal, Dow Jones Newswire, Barron’s, Forbes, SF Chronicle, Chicago Tribune and Miami Herald and is often seen on financial television. He created and authored what was believed to be the most heavily followed option trading blog in the world for three-years.This article is used here with permission and originally appeared here. -
Netflix Pre-earnings Momentum Options Trade
Ophir Gottlieb posted a article in SteadyOptions Trading Blog
.jpg.b7a2b417a1fd41c5edc184a7eb7e62f3.jpg) There is a bullish momentum pattern in Netflix Inc (NASDAQ:NFLX) stock 7 calendar days before earnings, and we can capture that phenomenon explicitly by looking at returns in the option market. LOGIC The logic behind the back-test is easy to understand -- in a bull market there can be a stock rise ahead of earnings on optimism, or upward momentum, that sets in the one-week before an earnings date. Stock Chart We can start with a stock return chart over the last year comparing Netflix (in red) to the rest of FAANG. Netflix has more than doubled the rest of the high momentum crew. The Bullish Option Trade Before Earnings in Netflix Inc We will examine the outcome of getting long a weekly call option in Netflix Inc 7-days before earnings (using calendar days) and selling the call before the earnings announcement. Here's the set-up in great clarity; again, note that the trade closes before earnings, so this trade does not make a bet on the earnings result. RISK MANAGEMENT We can add another layer of risk management to the back-test by instituting and 50% stop loss and a 50% limit gain. Note that this is a little different from our normal 40% stop and limit. Here is that setting: In English, at the close of each trading day we check to see if the long option is either up or down 40% relative to the open price. If it was, the trade was closed. Back-test Discovery We found this back-test by looking at pre=-earnings strategies in the Nasdaq 100. We focused on 3-year results, and sorted by wins. Don't worry, we will talk about those six companies with better scan results soon, but Netflix has a nice narrative around it that stands out. RESULTS Here are the results over the last three-years in Netflix Inc: NFLX: Long 40 Delta Call % Wins: 75% Wins: 9 Losses: 3 % Return: 173% Tap Here to See the Back-test We see a 173% return, testing this over the last 12 earnings dates in Netflix Inc. That's a total of just 84 days (7-days for each earnings date, over 12 earnings dates). This has been the results of following the trend of bullish sentiment into earnings while avoiding the actual earnings result. We can also see that this strategy hasn't been a winner all the time, rather it has won 9 times and lost 3 times, for a 75% win-rate and again, that 173% return in less than six-full months of trading. Setting Expectations While this strategy had an overall return of 173%, the trade details keep us in bounds with expectations: ➡ The average percent return per trade was 26%. ➡ The average percent return per winning trade was 47.7%. ➡ The average percent return per losing trade was -39%. Back-testing More Time Periods in Netflix Inc Now we can look at just the last year as well: NFLX: Long 40 Delta Call % Wins: 75% Wins: 3 Losses: 1 % Return: 105% Tap Here to See the Back-test We're now looking at 105% returns, on 3 winning trades and 1 losing trades. It's worth noting again that we are only talking about one-week of trading for each earnings release, so this is 105% in just 4-weeks of total trading. ➡ The average percent return over the last year per trade was 26.1%. This is remarkably similar to the three-year result of a 26% average return. ➡ The average percent return per winning trade was 40%. ➡ The average percent return for the one losing trade was -15.7%. Going Yet Further While we're at it, we can take a look what really sets this back-test apart from some others that actually have slightly higher win rates. We are also focused on the 9-month back-test: NFLX: Long 40 Delta Call % Wins: 100% Wins: 3 Losses: 0 % Return: 131% Tap Here to See the Back-test We can see that Netflix has a bit of streak to it right now with three consecutive pre-earnings one-week long call back-tests showing wins, with an average return of 40%. WHAT HAPPENED Bull markets tend to create optimism, whether it's deserved or not. With the recent history of outperformance of the other FAANG stocks and nice winning streak, this gets twice the attention and is worth noting well ahead of the next event. To see how to test this for any stock we welcome you to watch this quick demonstration video: Tap Here to See the Tools at Work Risk Disclosure You should read the Characteristics and Risks of Standardized Options. Past performance is not an indication of future results. Trading futures and options involves the risk of loss. Please consider carefully whether futures or options are appropriate to your financial situation. Only risk capital should be used when trading futures or options. Investors could lose more than their initial investment. Past results are not necessarily indicative of future results. The risk of loss in trading can be substantial, carefully consider the inherent risks of such an investment in light of your financial condition.
There is a bullish momentum pattern in Netflix Inc (NASDAQ:NFLX) stock 7 calendar days before earnings, and we can capture that phenomenon explicitly by looking at returns in the option market. LOGIC The logic behind the back-test is easy to understand -- in a bull market there can be a stock rise ahead of earnings on optimism, or upward momentum, that sets in the one-week before an earnings date. Stock Chart We can start with a stock return chart over the last year comparing Netflix (in red) to the rest of FAANG. Netflix has more than doubled the rest of the high momentum crew. The Bullish Option Trade Before Earnings in Netflix Inc We will examine the outcome of getting long a weekly call option in Netflix Inc 7-days before earnings (using calendar days) and selling the call before the earnings announcement. Here's the set-up in great clarity; again, note that the trade closes before earnings, so this trade does not make a bet on the earnings result. RISK MANAGEMENT We can add another layer of risk management to the back-test by instituting and 50% stop loss and a 50% limit gain. Note that this is a little different from our normal 40% stop and limit. Here is that setting: In English, at the close of each trading day we check to see if the long option is either up or down 40% relative to the open price. If it was, the trade was closed. Back-test Discovery We found this back-test by looking at pre=-earnings strategies in the Nasdaq 100. We focused on 3-year results, and sorted by wins. Don't worry, we will talk about those six companies with better scan results soon, but Netflix has a nice narrative around it that stands out. RESULTS Here are the results over the last three-years in Netflix Inc: NFLX: Long 40 Delta Call % Wins: 75% Wins: 9 Losses: 3 % Return: 173% Tap Here to See the Back-test We see a 173% return, testing this over the last 12 earnings dates in Netflix Inc. That's a total of just 84 days (7-days for each earnings date, over 12 earnings dates). This has been the results of following the trend of bullish sentiment into earnings while avoiding the actual earnings result. We can also see that this strategy hasn't been a winner all the time, rather it has won 9 times and lost 3 times, for a 75% win-rate and again, that 173% return in less than six-full months of trading. Setting Expectations While this strategy had an overall return of 173%, the trade details keep us in bounds with expectations: ➡ The average percent return per trade was 26%. ➡ The average percent return per winning trade was 47.7%. ➡ The average percent return per losing trade was -39%. Back-testing More Time Periods in Netflix Inc Now we can look at just the last year as well: NFLX: Long 40 Delta Call % Wins: 75% Wins: 3 Losses: 1 % Return: 105% Tap Here to See the Back-test We're now looking at 105% returns, on 3 winning trades and 1 losing trades. It's worth noting again that we are only talking about one-week of trading for each earnings release, so this is 105% in just 4-weeks of total trading. ➡ The average percent return over the last year per trade was 26.1%. This is remarkably similar to the three-year result of a 26% average return. ➡ The average percent return per winning trade was 40%. ➡ The average percent return for the one losing trade was -15.7%. Going Yet Further While we're at it, we can take a look what really sets this back-test apart from some others that actually have slightly higher win rates. We are also focused on the 9-month back-test: NFLX: Long 40 Delta Call % Wins: 100% Wins: 3 Losses: 0 % Return: 131% Tap Here to See the Back-test We can see that Netflix has a bit of streak to it right now with three consecutive pre-earnings one-week long call back-tests showing wins, with an average return of 40%. WHAT HAPPENED Bull markets tend to create optimism, whether it's deserved or not. With the recent history of outperformance of the other FAANG stocks and nice winning streak, this gets twice the attention and is worth noting well ahead of the next event. To see how to test this for any stock we welcome you to watch this quick demonstration video: Tap Here to See the Tools at Work Risk Disclosure You should read the Characteristics and Risks of Standardized Options. Past performance is not an indication of future results. Trading futures and options involves the risk of loss. Please consider carefully whether futures or options are appropriate to your financial situation. Only risk capital should be used when trading futures or options. Investors could lose more than their initial investment. Past results are not necessarily indicative of future results. The risk of loss in trading can be substantial, carefully consider the inherent risks of such an investment in light of your financial condition. -
Post Earnings Option Trade in Facebook
Ophir Gottlieb posted a article in SteadyOptions Trading Blog
 Facebook Inc (NASDAQ:FB) Earnings We can test this approach without directional bias with a custom option back-test. Here is our earnings set-up: Rules * Open an iron condor two calendar days after earnings * Close the iron condor 7 calendar days after earnings * Use the options closest to 7 days from expiration (but at least 7-days). And a note before we see the results: This is a straight down the middle volatility bet -- this trade wins if the stock doesn't move much during the week following earnings and it will stand to lose if the stock is volatile. RESULTS If we sold this 40/20 delta iron condor in Facebook Inc (NASDAQ:FB) over the last three-years but only held it after earnings we get these results: FB: Short 40 Delta / 20 Delta Iron Condor % Wins: 67% Wins: 8 Losses: 4 % Return: 49.5% We see a 49.5% return, testing this over the last 12 earnings dates in Facebook Inc. That's a total of just 60 days (5 days for each earnings date, over 12 earnings dates). We can also see that this strategy hasn't been a winner all the time, rather it has won 8 times and lost 4 times, for a 67% win-rate. Setting Expectations While this strategy had an overall return of 49.5%, the trade details keep us in bounds with expectations: ➡ The average percent return per trade was 7.78% over 5-days. WHAT HAPPENED This is how people profit from the option market -- it's not about guessing. We hope, if nothing else, you have learned the intelligence and methodology of trading Facebook options and this idea of equilibrium right after earnings. To see how to find the best strategy for any stock we welcome you to watch this quick demonstration video: Tap Here to See the Tools at Work Risk Disclosure You should read the Characteristics and Risks of Standardized Options. We incorporated this strategy into our SteadyOptions model portfolio with good results so far. This is how SteadyOptions members take advantage of the CMLviz Trade Machine.
 -
 But, this pre-earnings momentum back-test is unlike any other in that it is the only one, out of more than 4,000 scans, that has never lost over the last three-years. (This does not mean it deserves extra risk capital or that it is somehow infallible, but, we are sharing a fact.) Here we go. PREFACE There is a bullish momentum trading pattern in Microsoft Corporation (NASDAQ:MSFT) stock 7 calendar days before earnings, and we can capture that phenomenon explicitly by looking at returns in the option market. The strategy won't work forever, but for now it is a momentum play that has not only returned 851.3%, but has also shown a win-rate of 100% over the last three-years. LOGIC The logic behind the test is easy to understand -- in a bull market there can be a stock rise ahead of earnings on optimism, or upward momentum, that sets in the one-week before an earnings date. Now we can see it in Microsoft Corporation. The Bullish Option Trade Before Earnings in Microsoft Corporation We will examine the outcome of getting long a weekly call option in Microsoft Corporation 7-days before earnings (using calendar days) and selling the call before the earnings announcement. Here's the set-up in great clarity; again, note that the trade closes before earnings, so this trade does not make a bet on the earnings result. RISK MANAGEMENT We can add another layer of risk management to the back-test by instituting and 40% stop loss and a 40% limit gain. Here is that setting: In English, at the close of each trading day we check to see if the long option is either up or down 40% relative to the open price. If it was, the trade was closed. Discovery We found this pattern by using the TradeMachine™ Pro scanner, searching for stocks that show bullish momentum 7-days before earnings. Here are the top results in the entire market over the last 3-years: RESULTS Here are the results over the last three-years in Microsoft Corporation: MSFT: Long 40 Delta Call % Wins: 100% Wins: 12 Losses: 0 % Return: 851.3% Tap Here to See the Back-test We see a 851.3% return, testing this over the last 12 earnings dates in Microsoft Corporation. That's a total of just 72 days (6-days for each earnings date, over 12 earnings dates). This has been the results of following the trend of bullish sentiment into earnings while avoiding the actual earnings result. This is not a magic bullet, even though it looks so good, there are no guarantees in the market. This is simply a bullish strategy. In the short-term it hasn't seen any losses, but more importantly, whether or not it loses on any given earnings run-up, the 851.3% return in less than three-full months of trading is predicated on an idea of consistent momentum. The trade will lose sometimes, but over the most recent trading history, this momentum and optimism options trade has won ahead of earnings. Setting Expectations While this strategy had an overall return of 851.3%, the trade details keep us in bounds with expectations: ➡ The average percent return per trade was 51.68% over each six-day period. Back-testing More Time Periods in Microsoft Corporation Now we can look at just the last year as well: MSFT: Long 40 Delta Call % Wins: 100% Wins: 4 Losses: 0 % Return: 230.1% Tap Here to See the Back-test We're now looking at 230.1% returns, on 4 winning trades and 0 losing trades. It's worth noting again that we are only talking about one-week of trading for each earnings release, so this is 230.1% in just 4-weeks of total trading. ➡ The average percent return over the last year per trade was 53.93% over six-days, remarkably similar to the 51.68% average return over the last three-years. WHAT HAPPENED Bull markets tend to create optimism, whether it's deserved or not. To see how to test this for any stock we welcome you to watch this quick demonstration video: Tap Here to See the Tools at Work Risk Disclosure You should read the Characteristics and Risks of Standardized Options. Past performance is not an indication of future results. Trading futures and options involves the risk of loss. Please consider carefully whether futures or options are appropriate to your financial situation. Only risk capital should be used when trading futures or options. Investors could lose more than their initial investment. Past results are not necessarily indicative of future results. The risk of loss in trading can be substantial, carefully consider the inherent risks of such an investment in light of your financial condition.
 -
.jpg.30a3aac325802e764aa266326c8b923d.jpg) IDEA The idea is quite simple -- trying to take advantage of a pattern in short-term bullishness just before earnings, and then getting out of the way so no actual earnings risk is taken. Now we can see it in Oracle Corporation. The Short-term Option Swing Trade Ahead of Earnings in Oracle Corporation We will examine the outcome of going long a weekly call option in Oracle Corporation just three calendar days before earnings and selling the call the day of the actual news. Since Oracle reports earnings after the market closes, examining a pattern that goes right up to the close of that day still does not take earnings risk. This is construct of the trade, noting that the short-term trade closes before earnings and therefore does not take a position on the earnings result. RISK MANAGEMENT We can add another layer of risk management to the back-test by instituting and 40% stop loss and a 40% limit gain. Here is that setting: In English, at the close of each trading day we check to see if the long option is either up or down 40% relative to the open price. If it was, the trade was closed. DISCOVERY We found this pattern using the scanner in Trade Machine Pro. We looked at the NASDAQ 100 and then the 3-day pre-earnings long call scan: And here are the results: There are only seven companies in the NASDAQ 100 that have seen this pattern win at least four times in a row, and Oracle is one of those. RESULTS Below we present the back-test stats over the last two-years in Oracle Corporation: ORCL: Long 40 Delta Call % Wins: 100% Wins: 8 Losses: 0 % Return: 290% Tap Here to See the Back-test The mechanics of the TradeMachine™ are that it uses end of day prices for every back-test entry and exit (every trigger). We see a 290% return, testing this over the last 8 earnings dates in Oracle Corporation. That's a total of just 32 days (4-day holding period for each earnings date, over 8 earnings dates). The trade will lose sometimes, and since it is such a short-term position, it can lose from news that moves the whole market that has nothing to do with Oracle Corporation, but over the recent history, this bullish option trade has won ahead of earnings. Setting Expectations While this strategy has an overall return of 290%, the trade details keep us in bounds with expectations: ➡ The average percent return per trade was 40.4% over just 4 trading days. Looking at More Recent History We did a multi-year back-test above, now we can look at just the last year: ORCL: Long 40 Delta Call % Wins: 100% Wins: 4 Losses: 0 % Return: 123% Tap Here to See the Back-test We're now looking at 123% returns, on 4 winning trades and 0 losing trades. ➡ The average percent return over the last year per trade was 30% over just 4 trading days. WHAT HAPPENED Bull markets tend to create optimism, whether it's deserved or not. To see how to test this for any stock we welcome you to watch this quick demonstration video: Tap Here to See the Tools at Work Risk Disclosure You should read the Characteristics and Risks of Standardized Options. Past performance is not an indication of future results. Trading futures and options involves the risk of loss. Please consider carefully whether futures or options are appropriate to your financial situation. Only risk capital should be used when trading futures or options. Investors could lose more than their initial investment. Past results are not necessarily indicative of future results. The risk of loss in trading can be substantial, carefully consider the inherent risks of such an investment in light of your financial condition. Please note that the executions and other statistics in this article are hypothetical, and do not reflect the impact, if any, of certain market factors such as liquidity and slippage.
IDEA The idea is quite simple -- trying to take advantage of a pattern in short-term bullishness just before earnings, and then getting out of the way so no actual earnings risk is taken. Now we can see it in Oracle Corporation. The Short-term Option Swing Trade Ahead of Earnings in Oracle Corporation We will examine the outcome of going long a weekly call option in Oracle Corporation just three calendar days before earnings and selling the call the day of the actual news. Since Oracle reports earnings after the market closes, examining a pattern that goes right up to the close of that day still does not take earnings risk. This is construct of the trade, noting that the short-term trade closes before earnings and therefore does not take a position on the earnings result. RISK MANAGEMENT We can add another layer of risk management to the back-test by instituting and 40% stop loss and a 40% limit gain. Here is that setting: In English, at the close of each trading day we check to see if the long option is either up or down 40% relative to the open price. If it was, the trade was closed. DISCOVERY We found this pattern using the scanner in Trade Machine Pro. We looked at the NASDAQ 100 and then the 3-day pre-earnings long call scan: And here are the results: There are only seven companies in the NASDAQ 100 that have seen this pattern win at least four times in a row, and Oracle is one of those. RESULTS Below we present the back-test stats over the last two-years in Oracle Corporation: ORCL: Long 40 Delta Call % Wins: 100% Wins: 8 Losses: 0 % Return: 290% Tap Here to See the Back-test The mechanics of the TradeMachine™ are that it uses end of day prices for every back-test entry and exit (every trigger). We see a 290% return, testing this over the last 8 earnings dates in Oracle Corporation. That's a total of just 32 days (4-day holding period for each earnings date, over 8 earnings dates). The trade will lose sometimes, and since it is such a short-term position, it can lose from news that moves the whole market that has nothing to do with Oracle Corporation, but over the recent history, this bullish option trade has won ahead of earnings. Setting Expectations While this strategy has an overall return of 290%, the trade details keep us in bounds with expectations: ➡ The average percent return per trade was 40.4% over just 4 trading days. Looking at More Recent History We did a multi-year back-test above, now we can look at just the last year: ORCL: Long 40 Delta Call % Wins: 100% Wins: 4 Losses: 0 % Return: 123% Tap Here to See the Back-test We're now looking at 123% returns, on 4 winning trades and 0 losing trades. ➡ The average percent return over the last year per trade was 30% over just 4 trading days. WHAT HAPPENED Bull markets tend to create optimism, whether it's deserved or not. To see how to test this for any stock we welcome you to watch this quick demonstration video: Tap Here to See the Tools at Work Risk Disclosure You should read the Characteristics and Risks of Standardized Options. Past performance is not an indication of future results. Trading futures and options involves the risk of loss. Please consider carefully whether futures or options are appropriate to your financial situation. Only risk capital should be used when trading futures or options. Investors could lose more than their initial investment. Past results are not necessarily indicative of future results. The risk of loss in trading can be substantial, carefully consider the inherent risks of such an investment in light of your financial condition. Please note that the executions and other statistics in this article are hypothetical, and do not reflect the impact, if any, of certain market factors such as liquidity and slippage. -
CMLViz recently had an article on SPX Weekly Call Spreads on Trademachine Pro - and someone used that setup on YouTube to illustrate - https://www.youtube.com/watch?v=XeBG8tQ6C1U&t=617s Which returned results for variations on 75/73, 74/72 etc Call Spreads And the results using default settings were like this When I set this up using default settings in TMP - I get this So I am not getting any 70-ish Delta setup results I am a new TMP user and I do understand that the first set of results - while the original author - must have been using some settings other than TMP default, I cannot think of what settings those might have been If anybody saw tgat CMLviz article or knows what settings might produce those SPX 70-ish Delta setups, I would appreciate it :-)
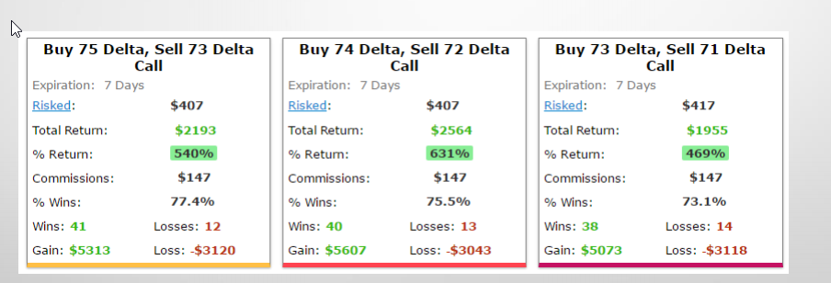
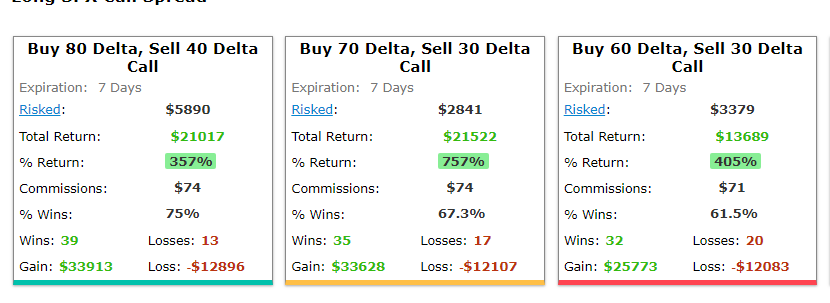
-
.jpg.945777d06629ce4c04ed67019095104f.jpg) FedEx has earnings due out on Tuesday 12-19-2017 after the market closes, according to our data provider Wall Street Horizon, and two days after that would be 12-21-2017 at the market close. FedEx Corporation (NYSE:FDX) Earnings For FedEx Corporation, irrespective of whether the earnings move was up or down, if we waited two full trading days after the stock move, and then sold a 3-week at out of the money iron condor (using weekly options closest to 21 days) at the close of trading of the second full day after earnings, the results were quite strong. This trade opens two calendar after earnings were announced to try to let the stock find equilibrium after the earnings announcement. We can test this approach without bias with a custom option back-test. Here is our earnings set-up: Rules * Open the short iron condor two calendar days after earnings * Close the iron condor 21 calendar days after earnings * Use the options closest to 21 days from expiration (but at least 21-days). And a note before we see the results: This is a straight down the middle volatility bet -- this trade wins if the stock is not volatile the three weeks following earnings and it will stand to lose if the stock is volatile. RESULTS If we sold this 35/15 delta iron condor in FedEx Corporation (NYSE:FDX) over the last two-years but only held it after earnings we get these results: FDX: Short 35 Delta / 15 Delta Iron Condor % Wins: 85.7% Wins: 6 Losses: 1 % Return: 338% Tap Here to See the Back-test We see a 338% return, testing this over the last 7 earnings dates in FedEx Corporation. That's a total of just 133 days (19 days for each earnings date, over 7 earnings dates). We can also see that this strategy hasn't been a winner all the time, rather it has won 6 times and lost 1 time, for a 86% win-rate. Setting Expectations While this strategy had an overall return of 34.9%, the trade details keep us in bounds with expectations: ➡ The average percent return per trade was 37.2% over 19-days. ➡ The average percent return per winning trade was 46.1% over 19-days. ➡ The average percent return per losing trade was -16.5% over 19-days. WHAT HAPPENED Traders that have a plan guess less. This is how people profit from the option market. Take a reasonable idea or hypothesis, test it, and apply lessons learned. Sometimes that means using momentum or technical analysis. In this article, we examined non-directional positioning. Tap Here to See the Tools at Work Risk Disclosure You should read the Characteristics and Risks of Standardized Options. Past performance is not an indication of future results.
FedEx has earnings due out on Tuesday 12-19-2017 after the market closes, according to our data provider Wall Street Horizon, and two days after that would be 12-21-2017 at the market close. FedEx Corporation (NYSE:FDX) Earnings For FedEx Corporation, irrespective of whether the earnings move was up or down, if we waited two full trading days after the stock move, and then sold a 3-week at out of the money iron condor (using weekly options closest to 21 days) at the close of trading of the second full day after earnings, the results were quite strong. This trade opens two calendar after earnings were announced to try to let the stock find equilibrium after the earnings announcement. We can test this approach without bias with a custom option back-test. Here is our earnings set-up: Rules * Open the short iron condor two calendar days after earnings * Close the iron condor 21 calendar days after earnings * Use the options closest to 21 days from expiration (but at least 21-days). And a note before we see the results: This is a straight down the middle volatility bet -- this trade wins if the stock is not volatile the three weeks following earnings and it will stand to lose if the stock is volatile. RESULTS If we sold this 35/15 delta iron condor in FedEx Corporation (NYSE:FDX) over the last two-years but only held it after earnings we get these results: FDX: Short 35 Delta / 15 Delta Iron Condor % Wins: 85.7% Wins: 6 Losses: 1 % Return: 338% Tap Here to See the Back-test We see a 338% return, testing this over the last 7 earnings dates in FedEx Corporation. That's a total of just 133 days (19 days for each earnings date, over 7 earnings dates). We can also see that this strategy hasn't been a winner all the time, rather it has won 6 times and lost 1 time, for a 86% win-rate. Setting Expectations While this strategy had an overall return of 34.9%, the trade details keep us in bounds with expectations: ➡ The average percent return per trade was 37.2% over 19-days. ➡ The average percent return per winning trade was 46.1% over 19-days. ➡ The average percent return per losing trade was -16.5% over 19-days. WHAT HAPPENED Traders that have a plan guess less. This is how people profit from the option market. Take a reasonable idea or hypothesis, test it, and apply lessons learned. Sometimes that means using momentum or technical analysis. In this article, we examined non-directional positioning. Tap Here to See the Tools at Work Risk Disclosure You should read the Characteristics and Risks of Standardized Options. Past performance is not an indication of future results.
