
The strategy seeks to make a profit from a large move in either direction of the underlying asset. It has a large profit potential with the risk limited to the price paid for both premiums.
A long strangle option is the most common and involves buying an out of the money call option with the strike price above the current market price and buying a put option with the strike price below the current market price.
A long strangle is an options spread that involves purchasing a put option and a call option at the same expiration date and a different strike price. The strategy is long volatility and market-neutral with infinite profit potential and limited risk. A strangle is similar to a straddle but uses options at different strike prices, while a straddle uses a call and put at the same strike price.
What is a Long Strangle?
The long strangle is quite similar to the popular straddle spread, the only difference is that the straddle involves buying a put and call at the same strike price, while the strangle uses different strike prices.
The trade is theta negative, vega positive, gamma positive and (typically) delta neutral.
Let’s look at an example in SPY options.
- SPY (underlying) price: $414.00
- BUY (1) 19 MAY $405 PUT @ $3.67
- BUY (1) 19 MAY $420 CALL @ $2.30
- Total trade cost: $5.97 (net debit)
In this case, you’re hoping for a large price movement in either direction, as your break-even price is often pretty far from the current underlying price. So you’d want to buy a strangle when you expect substantial market volatility, but when you’re relatively agnostic about the direction of that volatility.
An example of such a situation is if there’s an important upcoming Federal Reserve meeting that you think will shock the market, resulting in dramatic price action.
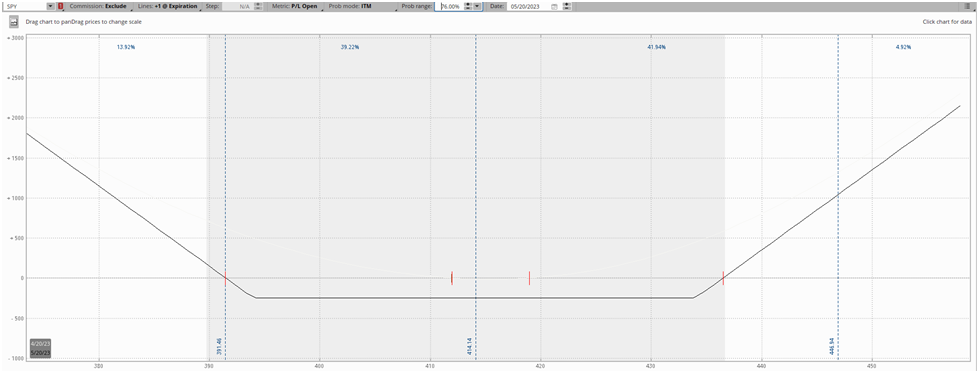
Here’s the payoff diagram for this position:
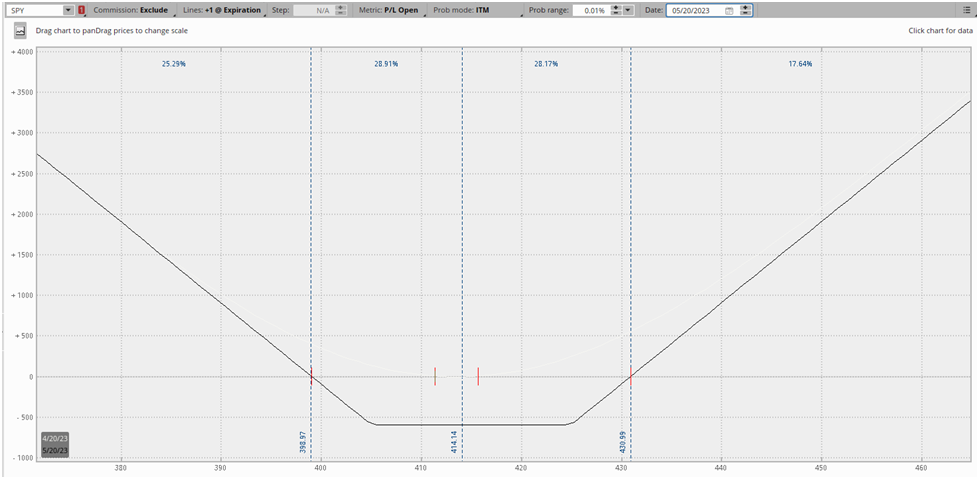
The position becomes profitable, or in-the-money, when the price of SPY trades outside of the dotted blue lines at expiration. With this specific spread expiring in 29 days, you’re playing for a pretty significant market move, in this case, you’re expecting SPY to move up or down roughly 3.6%.
Elements of a Long Strangle
Market Neutral
Strangles make no attempt to forecast the direction the underlying price will move in the future. A standard strangle has roughly equal exposure to both increases and decreases in price. Instead, you’re taking a view on the magnitude of price movement.
The Long Strangle is a Bet on Increased Volatility
The long strangle is a Vega positive options strategy. When you buy a strangle, you’re betting on a significant price move in the underlying stock and/or increasing implied volatility.
Think of it this way. The price of an at-the-money straddle (the “sister” spread to the strangle) is basically the option’s market expectations of how much price will move until expiration.
You can think of it like a spread in sports betting. If the Giants are +140 to beat the Vikings, then the bookies are giving the Giants a 41% chance of winning. If you think those odds are substantially higher, then you should bet on the Giants.
The same is true in the options market. For instance, if an ATM straddle in SPY costs $13.84 when SPY is trading at $414, the options market is pricing in a roughly 3.3% move. If you think it will move substantially more, then you should buy a long volatility spread like a strangle or straddle.
The Strangle is Negative Theta
Because the strangle is a long premium options strategy, you’re working against the clock. Due to theta decay, the value of your options will slowly lose value with each passing day, meaning the market needs to make a big move in a relatively short time to make up for theta decay.
The Strangle Has Unlimited Profit Potential
Because options are worth their intrinsic value at expiration and there’s no theoretical limit to how high a stock can go, a strangle has unlimited profit potential on the upside, with the profit potential on the downside only limited by the underlying stock going to zero.
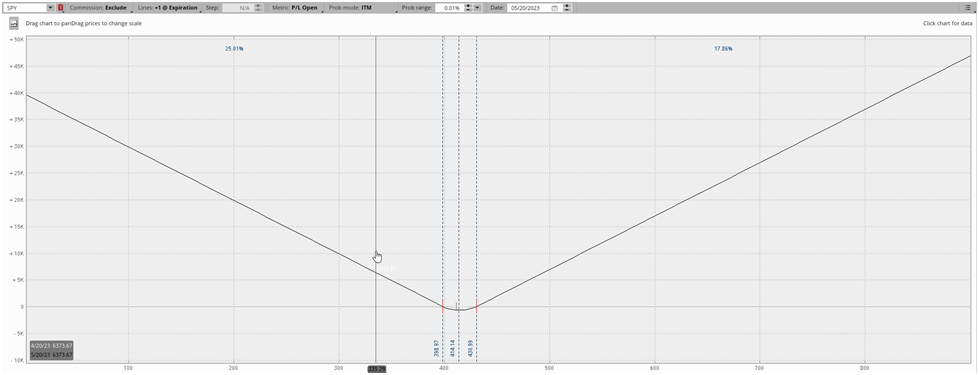
Here’s a zoomed-out payoff diagram for a visual:
The Strangle Has Limited Risk
The strangle involves only buying options, meaning that the most you can lose is the net debit, or the total cost of the options. In this case, the trading costs would be the combined cost of both the put and the call.
Recalling our SPY strangle example from earlier in the example:
- SPY (underlying) price: $414.00
- BUY (1) 19 MAY $405 PUT @ $3.67
- BUY (1) 19 MAY $420 CALL @ $2.30
- Total trade cost: $5.97 (net debit)
The most we can lose in this case would be $5.97, the net debit or total cost of the trade.
How to Create a Long Strangle Spread
A long strangle is a very simple trade structure: a put and a call at different strike prices with the same expiration date. The width between the strike prices can be as narrow or wide as you like. You structuring the strangle trade to fit your specific market view is where the “special sauce” of options trading comes in.
Let’s visualize a strangle on an options chain:
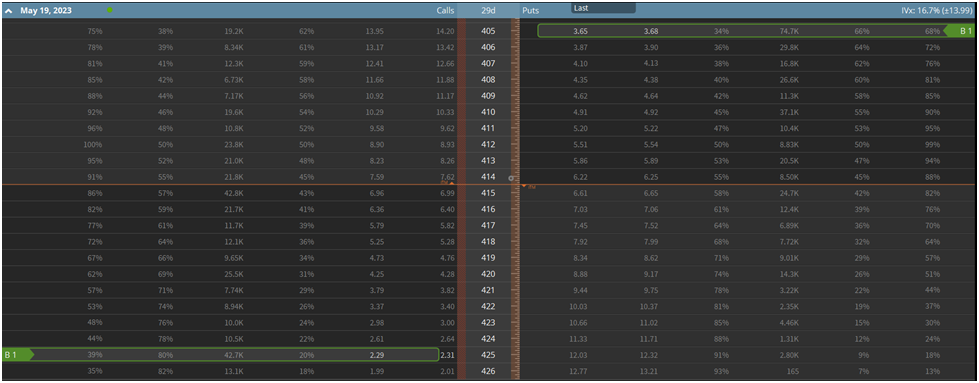
Above is the same SPY long strangle example we’ve been using throughout the article. You’re basically buying out-of-the-money (OTM) options that will benefit from huge price moves in either direction. The market move needs to not only be large enough to put one of your OTM options in-the-money, but also pay for your net debit.
So perhaps you conclude the structure we have above is a little expensive for your taste. You’d rather pay less for a spread and have a smaller probability of making a significant return on your capital.
You can simply widen the spread to fit this view. See the table below:
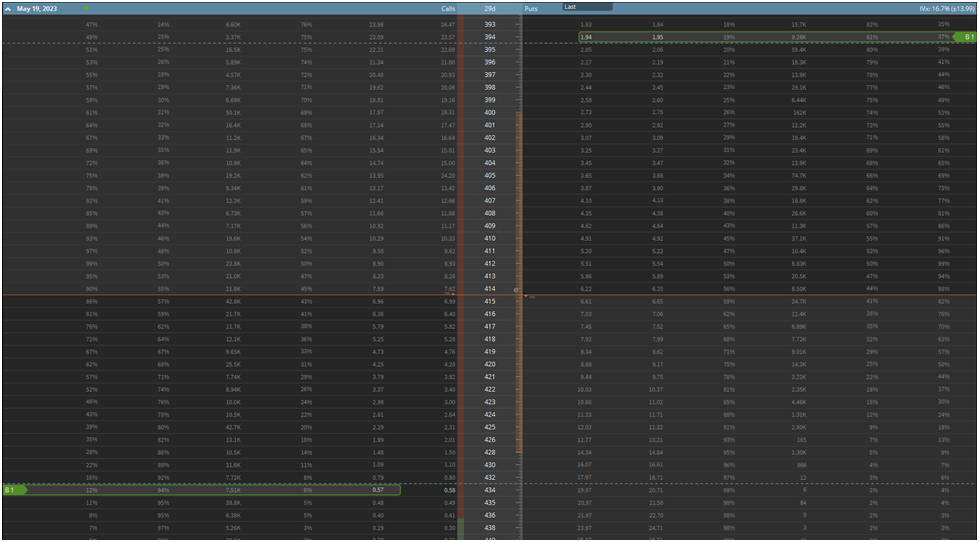
This spread will cost substantially less at $2.52, however your probability of profiting on the trade is far lower as the market needs to make a much bigger move to put your trade in the money.
Like any options trade, the long strangle is about tradeoffs. You’re trying to find the right balance between risk and reward. The longer expiration you choose, the longer you give yourself for the trade to work, but the more you pay for the spread. If you widen the width between your strikes, your risk/reward is higher, but your probability of profiting on the trade declines.
For this reason, there’s a number of considerations to make when structuring a long strangle spread.
Strike Width and Strike Selection
Strike selection is a key component of options trading, it’s often what defines a profitable or losing trade. The decision largely comes down to the balance between reward/risk ratio and probability of profit.
As a rule, wide strike widths have high reward/risk ratios and low probabilities of profit, while narrow strike widths have comparatively lower reward/risk ratios and higher win rates.
As a point of demonstration, let’s compare the strangle examples we referred to earlier in this article. If you recall, the first one is:
- SPY (underlying) price: $414.00
- BUY (1) 19 MAY $405 PUT @ $3.67
- BUY (1) 19 MAY $420 CALL @ $2.30
- Total trade cost: $5.97 (net debit)
And the second spread is:
- SPY (underlying) price: $414.00
- BUY (1) 19 MAY $394 PUT @ $1.95
- BUY (1) 19 MAY $434 CALL @ $0.58
- Total trade cost: $2.53 (net debit)
While both of these spreads are long-volatility spreads aiming for big wins, the second spread has a far higher reward/risk by virtue of the much smaller capital outlay. But the first spread has a much better chance of expiring in-the-money. The first spread has a probability of profit (POP) of 56%, whereas the second spread has a POP of just 25%.
Expiration Date
A very similar tradeoff is at play when selecting an expiration date for your options. In an ideal world, you’d always select the longest expiration date possible. But of course, the longer an option has until expiration, the more time value it has and in turn, the more expensive it is.
So we’re constantly looking to strike the perfect balance between buying ourselves enough time to be right, but not overpaying for time value so much that it hurts our reward/risk ratio.
Theta is the primary factor to keep in mind here. The following chart from Investopedia displays the rate of theta decay based on the time to expiration:
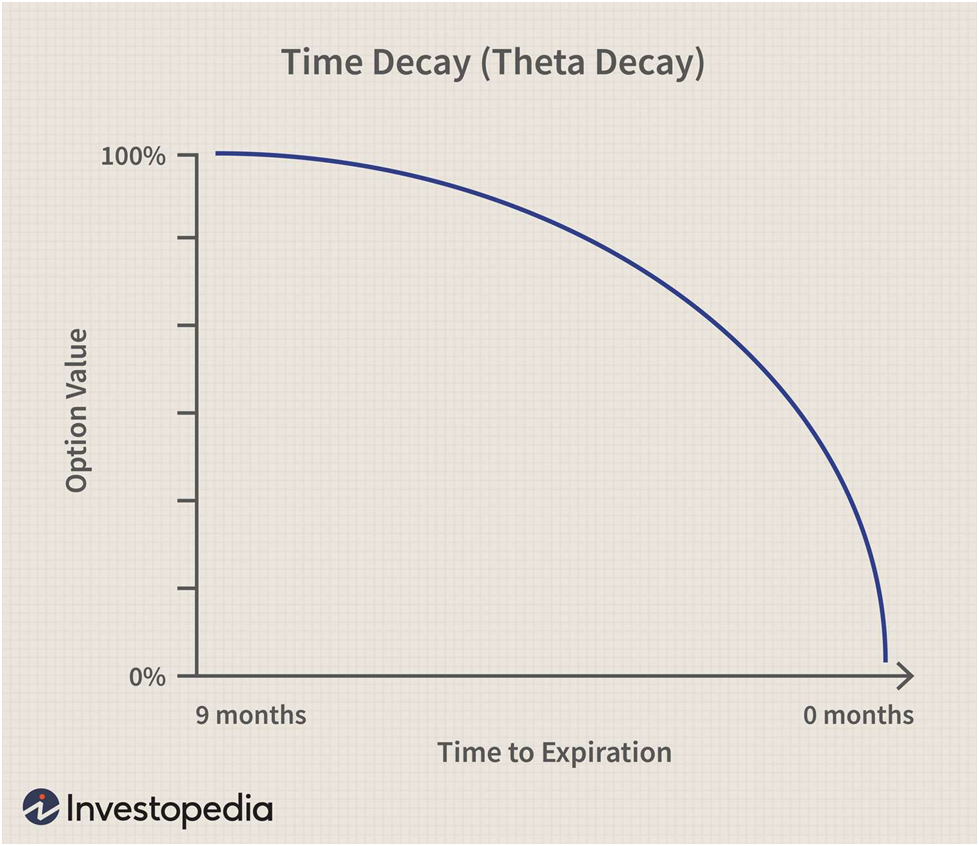
While this is only a rough guide and theta decay will be slightly different for each option, the concept stands. As you get closer to expiration, the rate of theta decay accelerates.
For this reason, many traders prefer to pick longer-dated expirations when buying premium. But again, you’re paying for that extra time value.
What Are Market Expectations?
In financial markets, obvious things are priced-in. Buying a high-quality company like Apple typically comes with a heftier valuation than a lower or mid-tier company. Everyone knows that Apple is a good company and the price reflects that. The same is true to a more severe extent in the options market.
The best analogy for this concept is in sports. The Boston Bruins just broke the NHL record for most wins in a season at 65. If the Bruins were facing the Anaheim Ducks with only 23 wins on the season, it’s pretty obvious who’s going to win. You’d never bet on the Ducks with 50/50 odds. But with 1/99 odds? Suddenly that seems like a good bet.
To relate the concept to options, everyone knows that a Federal Reserve meeting or earnings report will create volatility. So the options market, just like sportsbooks, set “odds” on what is most likely to happen. In the same way that sportsbooks reflect that the Bruins should beat the Ducks, the options market does this to reflect publicly available information. This is why buying pre-earnings options is expensive, because everyone knows that there will be increased volatility.
The best way to see what the option market thinks will happen is pricing out an at-the-money (ATM) straddle.
For instance, let’s say we were interested in betting on earnings on Apple. We’d look at the expiration following the company’s earnings date on May 4, 2023 and sum the price of the ATM call and put, giving us a net debit of $8.03. This means the options market expects the price of Apple stock to move plus/minus about $8 on the release of earnings.
You can look at the ATM straddle as the “moneyline” in sports betting. Rather than thinking in terms of “the Bruins are the better team, I think they’ll win,” you think more in terms of “I think the Bruins’ probability of winning is higher/lower than the odds.”
So before entering a long strangle, you need to ensure that you are bullish on volatility relative to market pricing. It’s not enough to think that prices will be volatile, you need to think they’ll be more volatile than what the market is already expecting. This is a key concept that many novice traders take a while to learn.
Long Strangle Payoff and P&L Characteristics
Long Strangle Breakeven Prices
The long strangle has two breakeven prices, an upper breakeven and a lower breakeven. Calculating them is easy.
- Upper Breakeven Price = Call Strike Price + Net Debit
- Lower Breakeven Price = Put Strike Price - Net Debit
For instance, here’s an example for an Apple strangle:
- $175 Call
- $160 Put
- Net Debit: $2.60
- Upper Breakeven = $175 + $2.60 = $177.60
-
Lower Breakeven = $160 - $2.60 = $157.40
Long Strangle Maximum Loss/Risk
The maximum risk for a long strangle is the net debit paid for the spread. The net debit is simply the combined cost of both the put and the call you purchase. Limited risk trading strategies like the long strangle are often the building blocks for new traders to cut their teeth on, allowing them to learn without taking on unlimited risk they might not understand.
Long Strangle Maximum Profit
The long strangle has unlimited profit potential because there is no limit to how high or low the underlying stock price can go. The only theoretical bound is the stock going to zero on the downside.
Long Strangle Market View and Outlook
Matching Market View to Options Trade Structure
One thing we're trying to nail home in this primer is the importance of matching your market view to the correct options spread. As an options trader, you're a carpenter, and option spreads are your tools. If you need to tighten a screw, you won't use a hammer but a screwdriver.
So before you add a new spread to your toolbox, it's crucial to understand the market view it expresses. One of the worst things you can do as an options trader is structure a trade that is out of harmony with your market outlook.
This mismatch is often on display with novice traders. Perhaps a meme stock like GameStop went from $10 to $400 in a few weeks. You're confident the price will revert to some historical mean, and you want to use options to express this view. Novice traders frequently only have outright puts and calls in their toolbox. Hence, they will use the proverbial hammer to tighten a screw in this situation.
In this hypothetical, a more experienced options trader might use a bear call spread, as it expresses a bearish directional view while also providing short-volatility exposure. But this trader can be infinitely creative with his trade structuring because he understands how to use options to express his market view appropriately.
The nuances of his view might drive him to add skew to the spread, turn it into a ratio spread, and so on.
What Market Outlook Does a Long Strangle Express?
The long strangle is delta-neutral, meaning traders buying a strangle take no position on price direction. Instead, they’re betting on the price magnitude, whether up or down. Put simply, a strangle profits when the underlying stock makes a big price move in either direction.
Positions like the long strangle or long straddle are often described as being long volatility, which might sound weird. To most, volatility is simply a calculation or an adjective used to describe chaotic trading. How can you “buy volatility?”
When you buy an option, you’re making a bet on price direction, time, and volatility. So if you buy a call, not only are you betting that the stock will go up, but that it will go up prior to expiration, and that it will go up more than the extrinsic value in the option cost implies. That third part is the volatility aspect of the equation.
Because a strangle involves buying both a put and a call, the directional aspect of the trade is neutralized, leaving only the time and volatility aspects of the trade.
So the long strangle trader is bullish on volatility and neutral on price. He is expecting a large price move.
When To Use a Long Strangle
Earnings
Speculating on earnings is the most popular use for strangles, which involves making a bet that a stock will or won’t make a big move following its earnings report.
A trader might observe that a specific stock tends to habitually make big moves on earnings, buyers of strangles profits quarter after quarter. Acknowledging this, a trader might buy a strangle prior to the following earnings report, so long as it doesn’t look like the market is adjusting to reality and making earnings options more expensive.
Here at SteadyOptions, we prefer to trade earnings volatility differently than the traditional style. We trade pre-earnings strangles and straddles. In other words, we both enter and exit our earnings volatility trades before the earnings event ever occurs. This might seem entirely counter-intuitive but I promise, it makes sense.
Because implied volatility tends to rise in the lead-up to earnings, we exploit this phenomenon. Essentially, as earnings get closer, traders and investors begin buying protection in the form of puts and buying speculative calls, pushing implied volatility up.
We tend to buy strangles and straddles 2-15 days before an earnings release and sell before earnings are even released. In this way, not only do we harvest many of the benefits of earnings volatility trading, but we also avoid the grim reaper of long volatility earnings trades: implied volatility (IV) crush, or the phenomenon for IV to plummet immediately following the release of an earnings report as the uncertainty that made the IV expensive is now gone.
Furthermore, the quick turnover also mitigates negative theta, or theta decay, the primary risk of buying options.
Other Market Events and Catalysts
While earnings is the main domain for volatility trading, several other events present similar trading opportunities. Some of these are:
- FDA trials for biotech stocks
- Significant economic releases like Federal Reserve meetings, nonfarm payroll, etc.
- Impending court decisions for companies in litigation
- M&A takeover speculation
- SEC and federal investigation outcomes
The general concept stands. When there is a catalyst that will significantly impact a company’s stock price and the market knows the date of the catalyst, the same uptick and crush in implied volatility will occur as it does with earnings releases.
Certain catalysts are more up in the air and don’t have a definitive date of resolution as earnings or a Federal Reserve meeting do. The SEC’s ongoing fight with Coinbase is one such example. In this case, you might see the implied volatility of such a stock’s options elevated for a prolonged period, as the market can’t pinpoint exactly when the catalyst will resolve. Such catalysts are much harder to trade and are better left to specialists.
Volatility Mean Reversion
We explained earlier in this article how the long strangle is more than anything, a volatility trade. You’re making a bet that the underlying stock’s volatility will be more than what the option market expects. In other words, the stock will make a bigger move than the market thinks it will.
So just as many traders might systematically buy stocks after huge declines, betting that it will revert back to a historical mean, the same concept exists in volatility trading. As a matter of fact, true mean reversion is much easier to observe in the volatility trading world than it is in the stock trading world.
For instance, take a look at a long-term (12 weeks) moving average of the S&P 500 Volatility Index (VIX), which is a measure of implied volatility for the S&P 500.
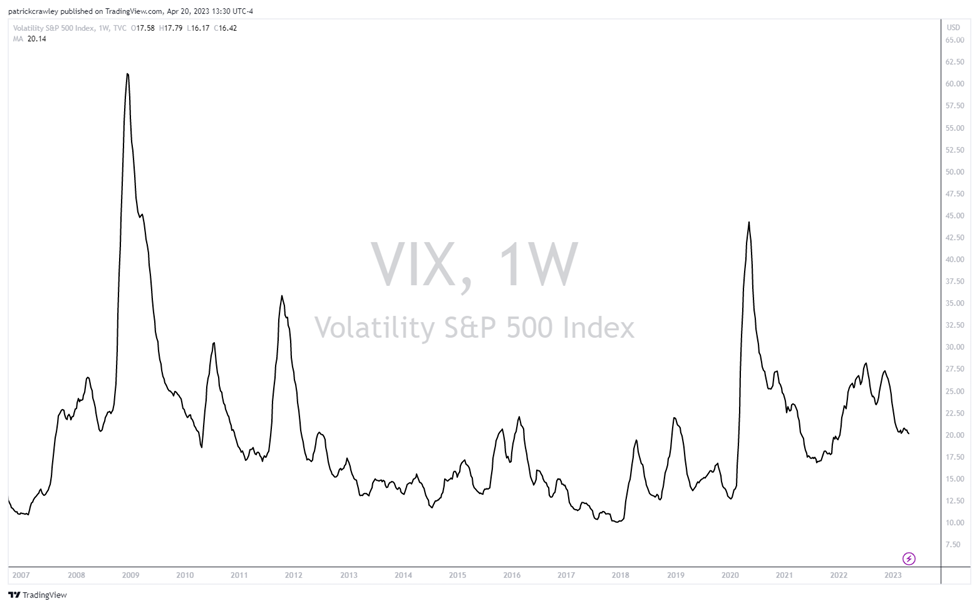
The above chart is a 12-week moving average of the VIX over the last 15 or so years. As you can see, the chart more resembles an EKG than a stock price, featuring semi-predictable peaks and valleys.
The behavior of volatility mean reversion is a well-known and accepted phenomenon in the quantitative finance world, with GARCH models being the standard way to model volatility.
With this in mind, many traders aim to play these peaks and valleys of volatility. Buying when it’s cheap relative to its historical mean, and selling when it’s expensive.
We at SteadyOptions do a fair bit of volatility trading and we prefer to approach it using long-volatility positioning, allowing us to benefit from significant spikes in volatility and not expose ourselves to the potentially catastrophic losses of selling volatility.
Long Strangle vs. Long Straddle
Strangles and straddles are very similar. They’re both delta-neutral, long-volatility strategies that aim to capture a significant price move in either direction. Both are used to speculate on volatility related to earnings and other market catalysts.
The primary difference is that straddles involve buying a put and call at the same strike price while strangles involve buying a put and call at different strike prices.
In practice, while a strangle and straddle have very similar market outlooks, their P&Ls behave differently throughout the trade.
The practical differences are as follows:
- Straddles tend to have more premium than strangles and cost more to initiate a position
- Straddles tend to have a higher probability of profit than strangles
- Strangles tend to require a larger move to breakeven on the trade
The best way to represent these differences is through each trade’s payoff diagrams.
A strangle features a more U-shaped payoff diagram:
:max_bytes(150000):strip_icc()/Strangle2-1d15c8d645af4bc7a7a57be18b4fa331.png)
As you can see by the flat line, a strangle is more of a “do or die” type of trade. It either works, or you lose almost all of your premium.
On the other hand, the straddle’s V-shaped payoff diagram means that very rarely will a straddle trader reach their maximum loss at expiration:
:max_bytes(150000):strip_icc()/understandingstraddles22-19b55dd41aee458287dda61e4929428a.png)
Bottom Line
The long strangle is a simple option spread. It involves buying a put and a call at different strike prices and the same expiration date. Long strangles are betting on a big price move and/or IV increase.
To enhance the gains, traders might also consider gamma scalping.
Related articles:
- Long Straddle Options Strategy: The Ultimate Guide
- How We Trade Straddle Option Strategy
- Straddle Vs. Strangle Options Strategy
- Exploiting Earnings Associated Rising Volatility
- What Is An Implied Volatility Crush
Subscribe to SteadyOptions now and experience the full power of options trading at your fingertips. Click the button below to get started!
Join SteadyOptions Now!


There are no comments to display.
Join the conversation
You can post now and register later. If you have an account, sign in now to post with your account.
Note: Your post will require moderator approval before it will be visible.