

SteadyOptions is an options trading forum where you can find solutions from top options traders. Join Us!

We’ve all been there… researching options strategies and unable to find the answers we’re looking for. SteadyOptions has your solution.

Citigroup Earnings Report July 15th, 2022


Welcome to the ORATS earnings report where we scan for companies with upcoming earnings announcements, check out historical earnings information, and find a potential options trade. Read on or watch the video overview here: https://youtu.be/9gDZSB2sRsk.


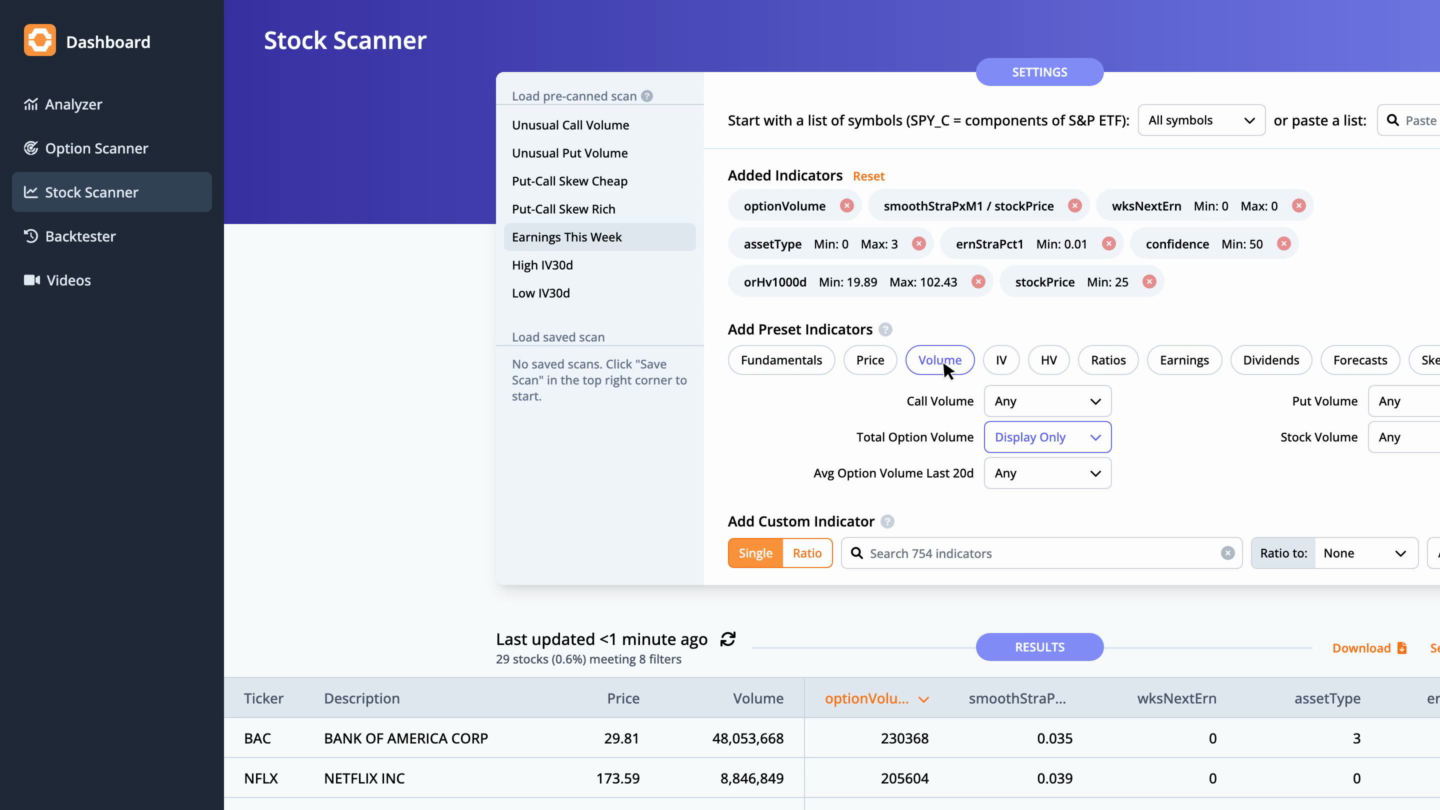
Let's start by running a scan on stocks reporting earnings this week, which includes the total option volume indicator, sorted from greatest to least.
 

mhtEaMsSUYMOkCBPqCcrgKmJFhvMOmY2JCSTZ7YB


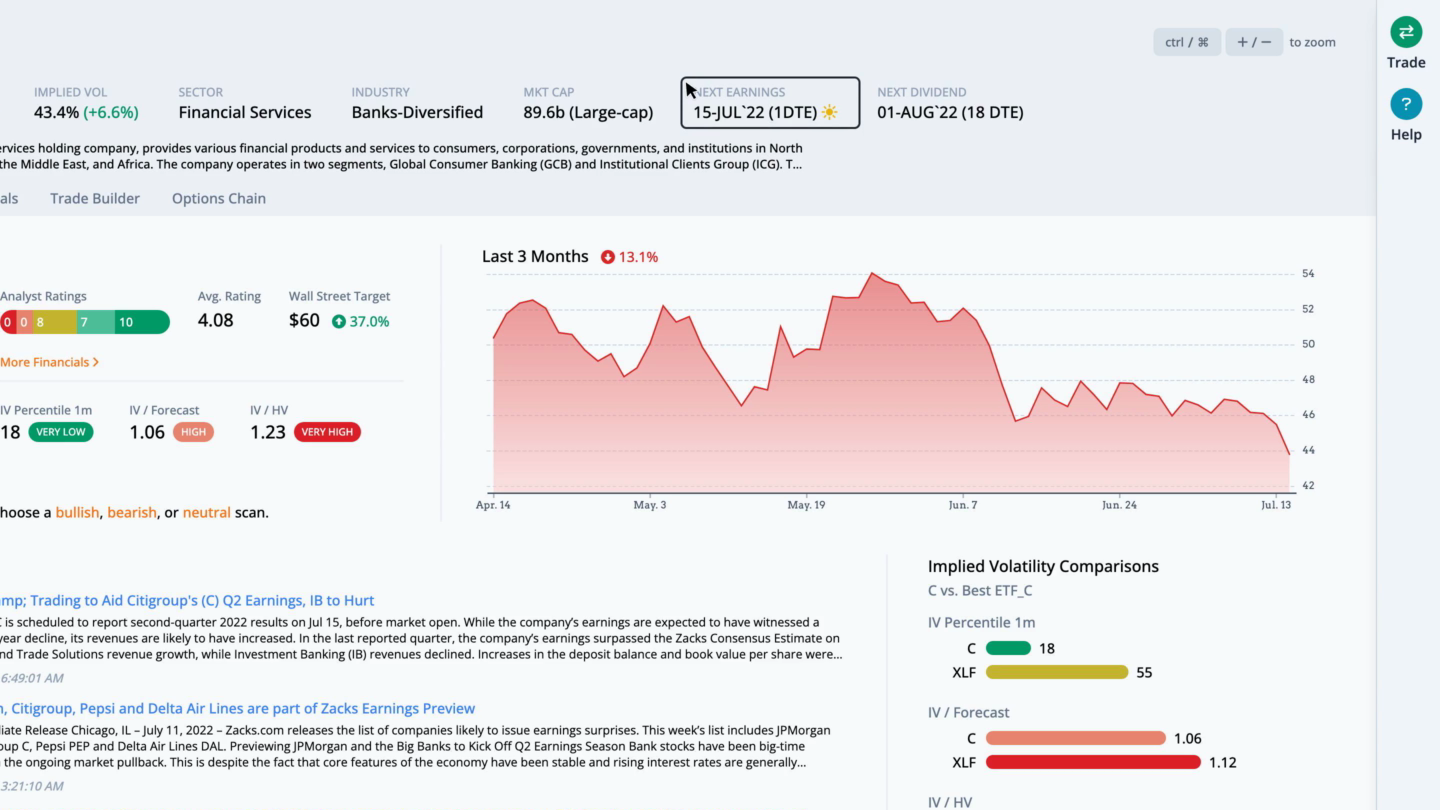
Focusing on Citigroup, as we click through, we see this large-cap company in the banks-diversified industry reports earnings on Friday, July 15th, before the open.
 

N9pnFV3pcjdNxwkDiYVzv7r27jVvaXUWGnMnR5HF


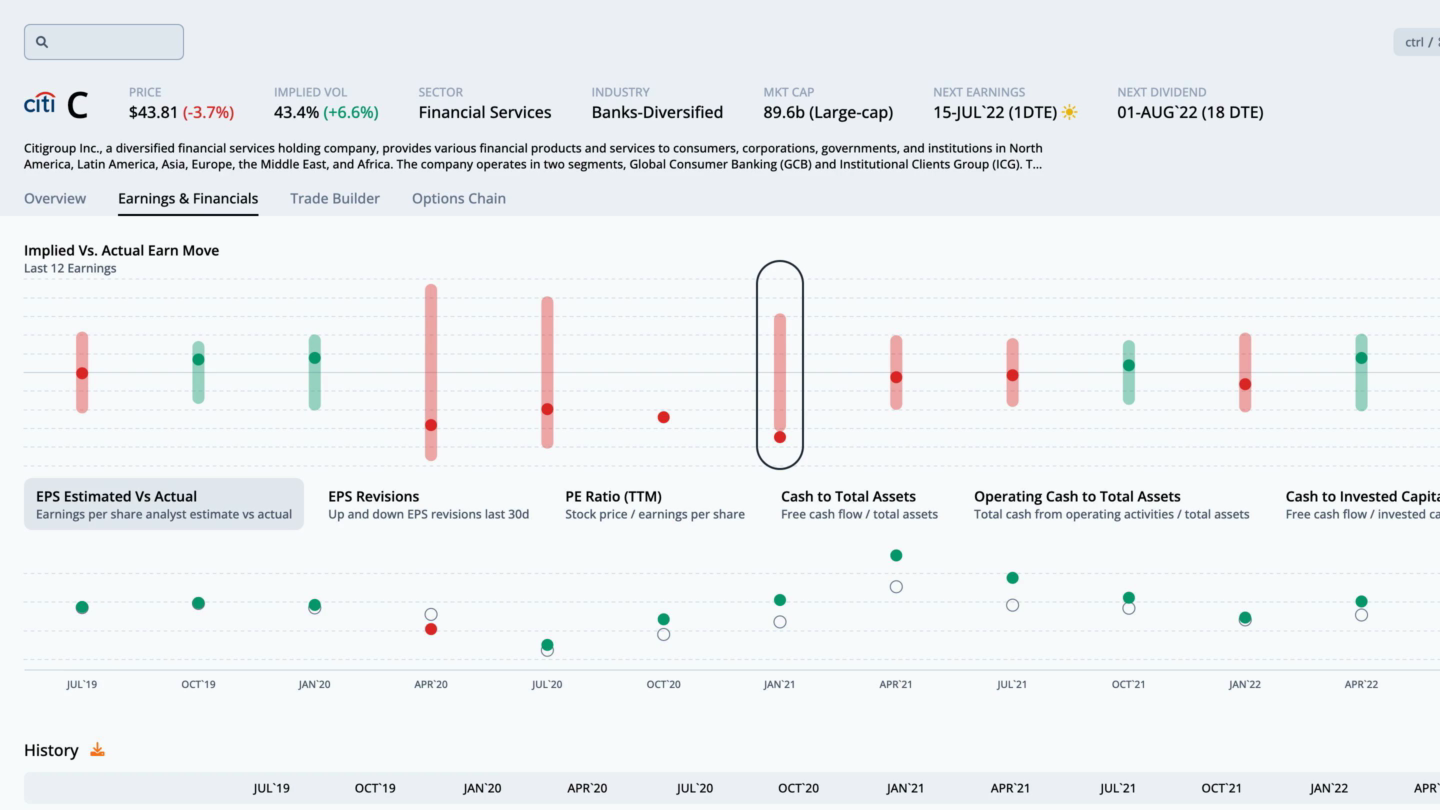
The earnings and financials tab takes us to more detail showing the options market expecting a move of 4.4% in either direction. This move was breached in 2 out of the last 12 earnings.
 

DAdIDs3DHsqRI0h7qCtRMUXxsXzcxNXv5uJhepNv


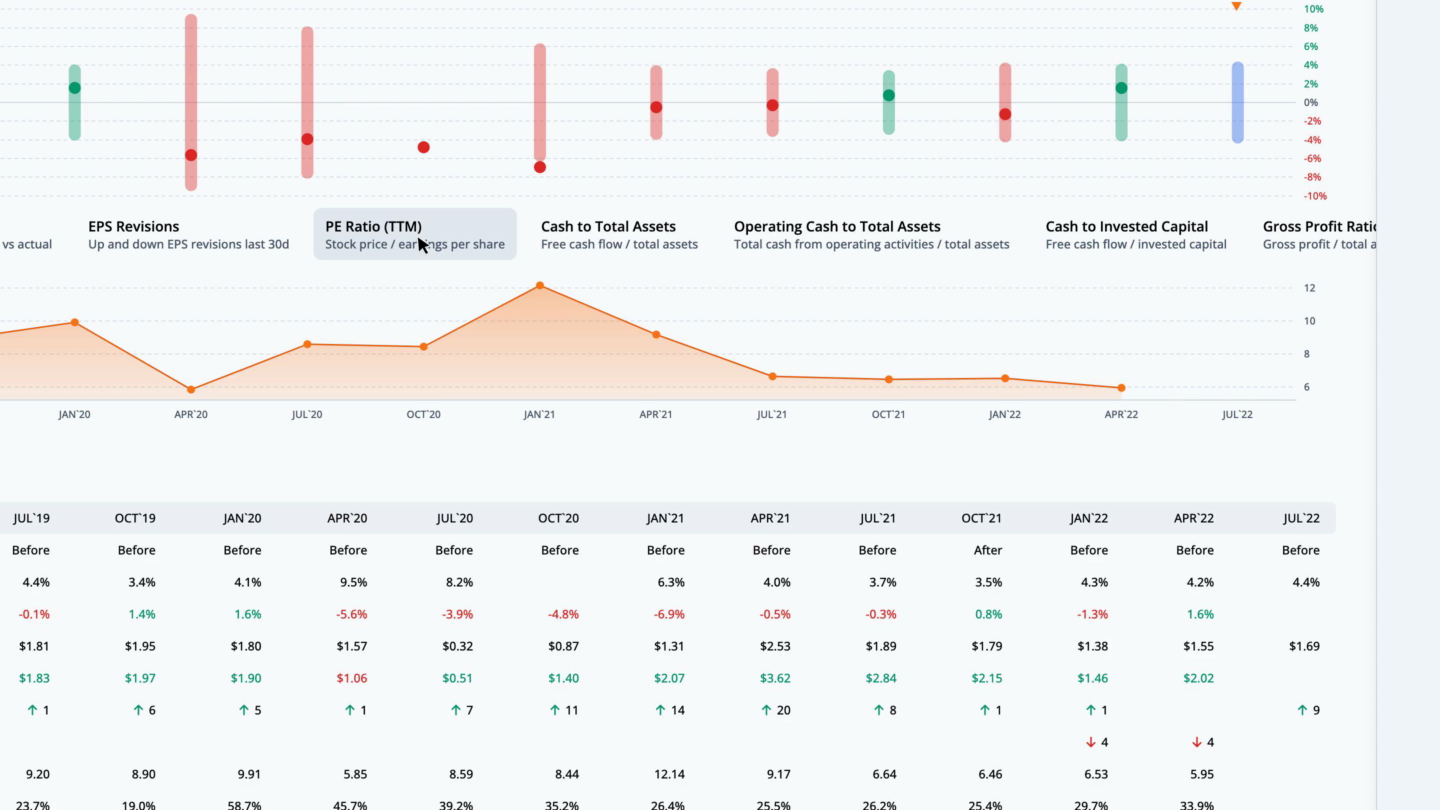
During that time, the post-earnings move was outside of the implied range 1 times. In those cases, long straddles were profitable. The rest of the earnings moves likely yielded profitable short straddles. We can overlay quarterly financial data by clicking on the ratios below the earn move graph. Let's look at the PE ratio, which is the stock price divided by the trailing twelve months earnings per share.
 

mdnH2kvphR5PXz74TW3wcclsqX6-WmByzM6tIQow


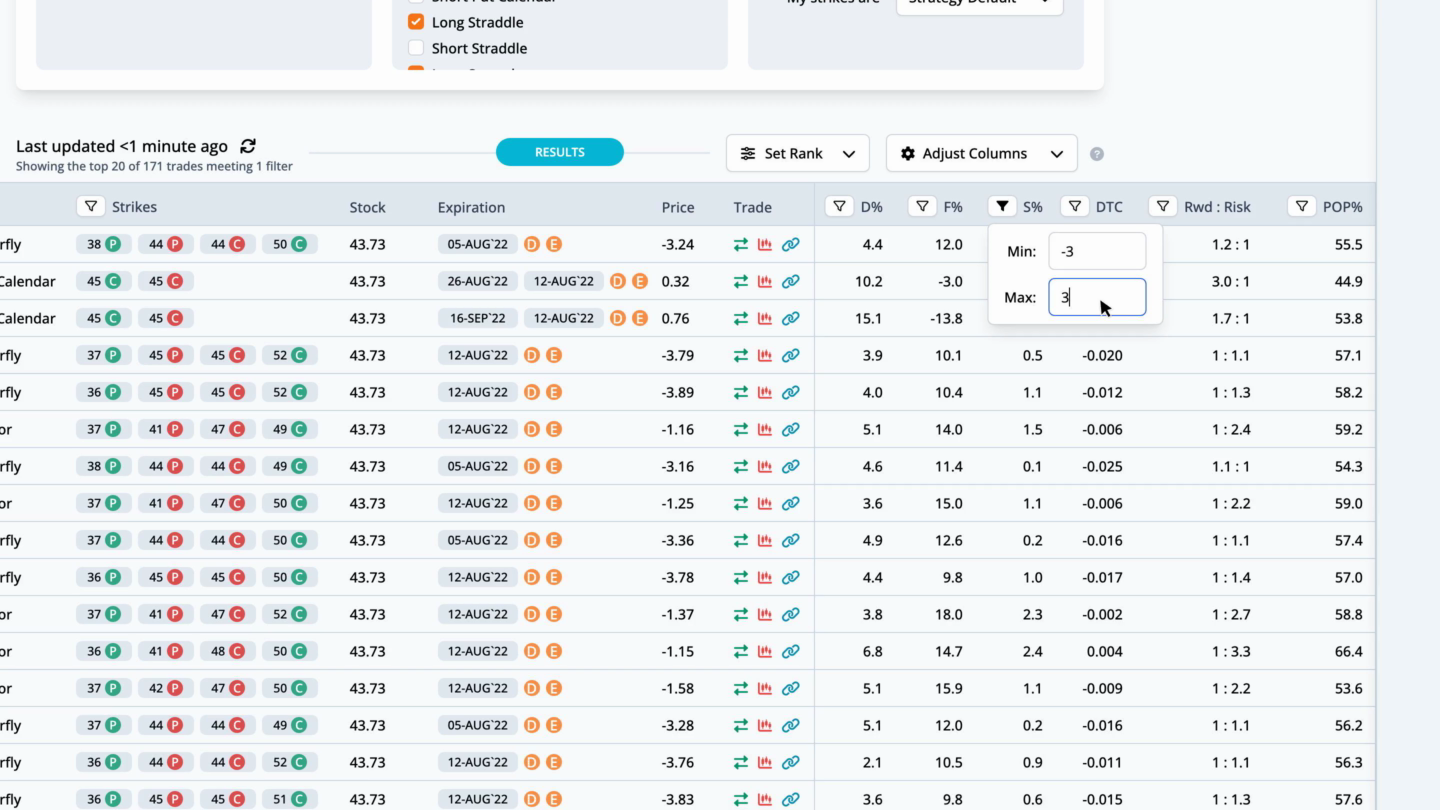
For C, the current PE ratio is 5.2, which is 20.7% under the average for the last twelve earnings observations. Returning to the overview tab, we can quickly run a scan to find the best option trades. Since earnings are right around the corner, we scan for market neutral strategies, then filter the scan results by S%, or smoothed edge, by setting it between negative and positive 3%.
 

q9BOjMn7pJWuK86Mkrt_QBSfMdjxmryBoQRov9_P


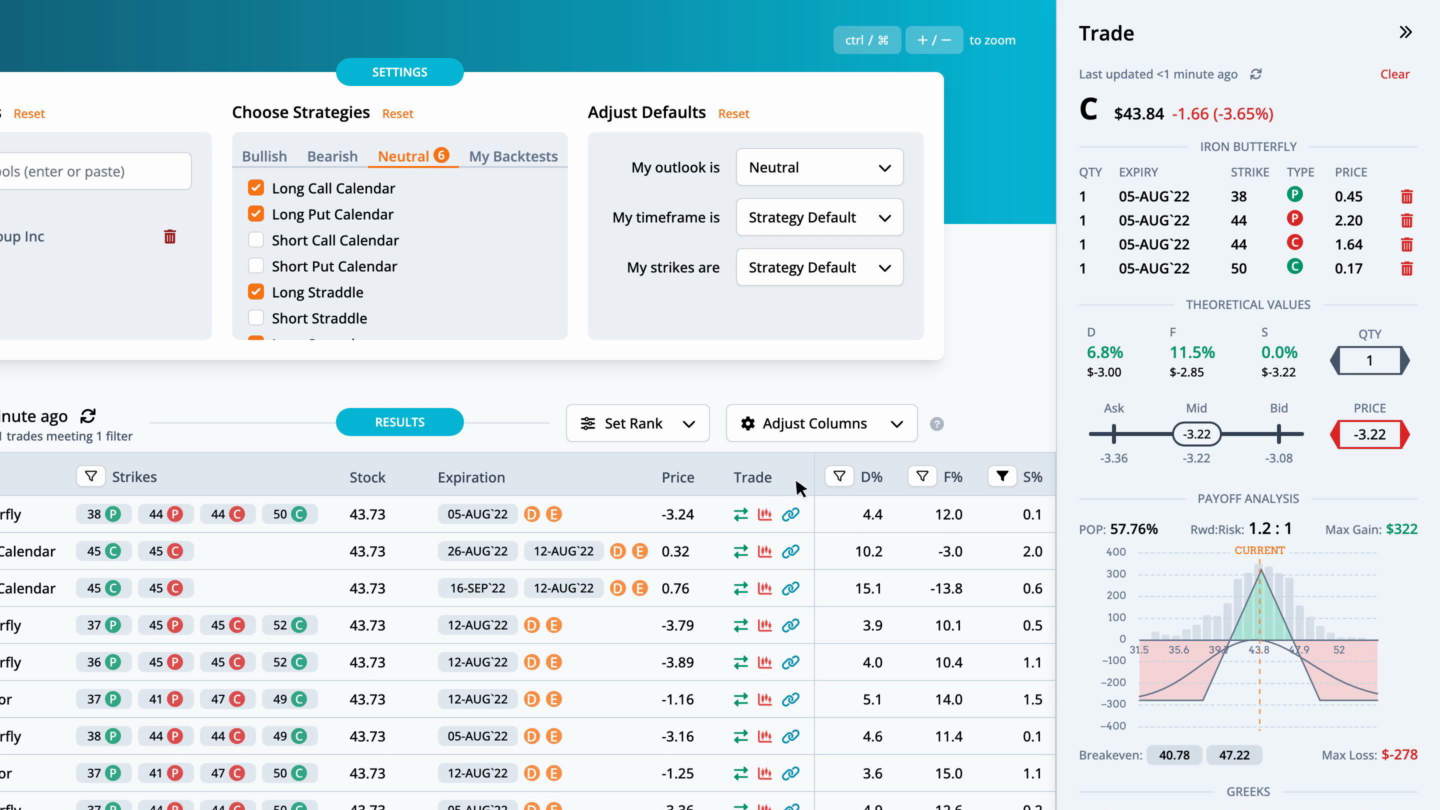
This helps narrow the results to trades that are fairly priced. The highest ranked trade is a Iron Butterfly with strikes at 38, 44, and 50, expiring on 2022-08-05, for a credit of $3.24.
 

UKktC8P0JeUE1AYyZKVJukdLzZr11gwuDGzvbiyX


By pulling up the trade, we can see the theoretical values in more detail. The distribution edge, found by the expected value of the payoff picture on the stock's historical distribution, has an edge of 6.8%. The forecast edge, which is derived from historical volatility, has an edge of 11.5%. Lastly, the smoothed edge, which is calculated by drawing a best fit curve through the monthly implied volatilities, has an edge of 0.0%. The edge is relative to the mid-market price of the trade.

Greater positive edges are a theoretical benefit to the trader. We can also look at the payoff graph. The probability of profit sums the probability of the nodes for the part of the payoff picture above the zero profit line over three standard deviations. For this trade the probability of profit is 57.76%. The reward to risk divides the max gain by the max loss. Here the 1.2 to 1 is the ratio of the max gain of $322 to the max loss of $-278. There are two break evens for this Iron Butterfly at 40.78 and 47.22. The total greeks and ThinkOrSwim code complete the information on the trade analysis popout.
 

mnT3ZyPBdit4PQtUFSb0Pxah7bNeKJ4hXjR1mwn_


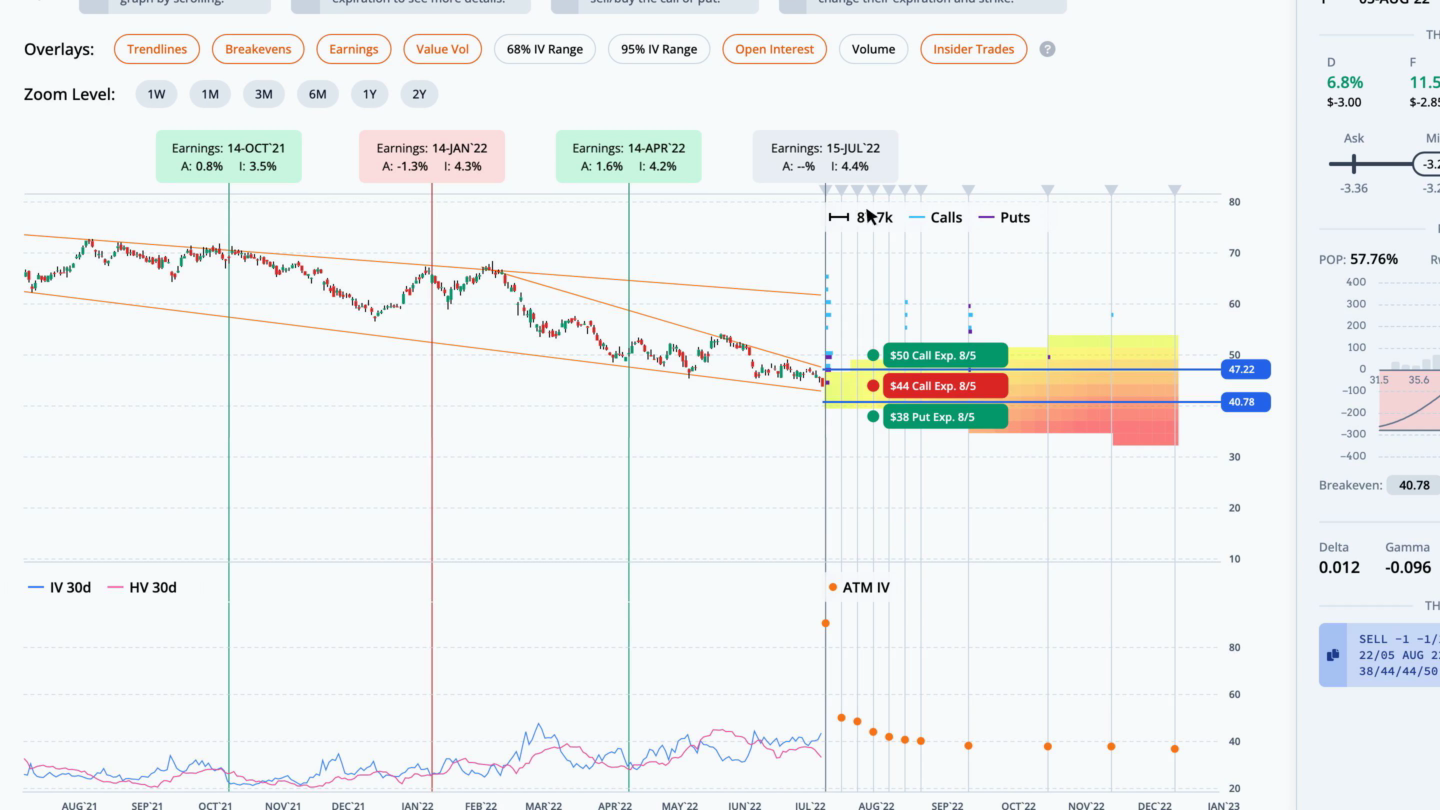
Next, let's look at this trade in the trade builder. Over the last month, the stock price fell 7.9%, while the thirty-day implied volatility rose 10.6%. The average slope of the trendlines is negative. The heatmap on the right side of the graph is green where volatility and slope are undervalued, and red where they are overvalued. In this case, short term IV and slope are neutral, while the long term is overvalued.
 

_h0bNQem5hMauKuFD-9CMMY0SbL2ntOirl5wASQI


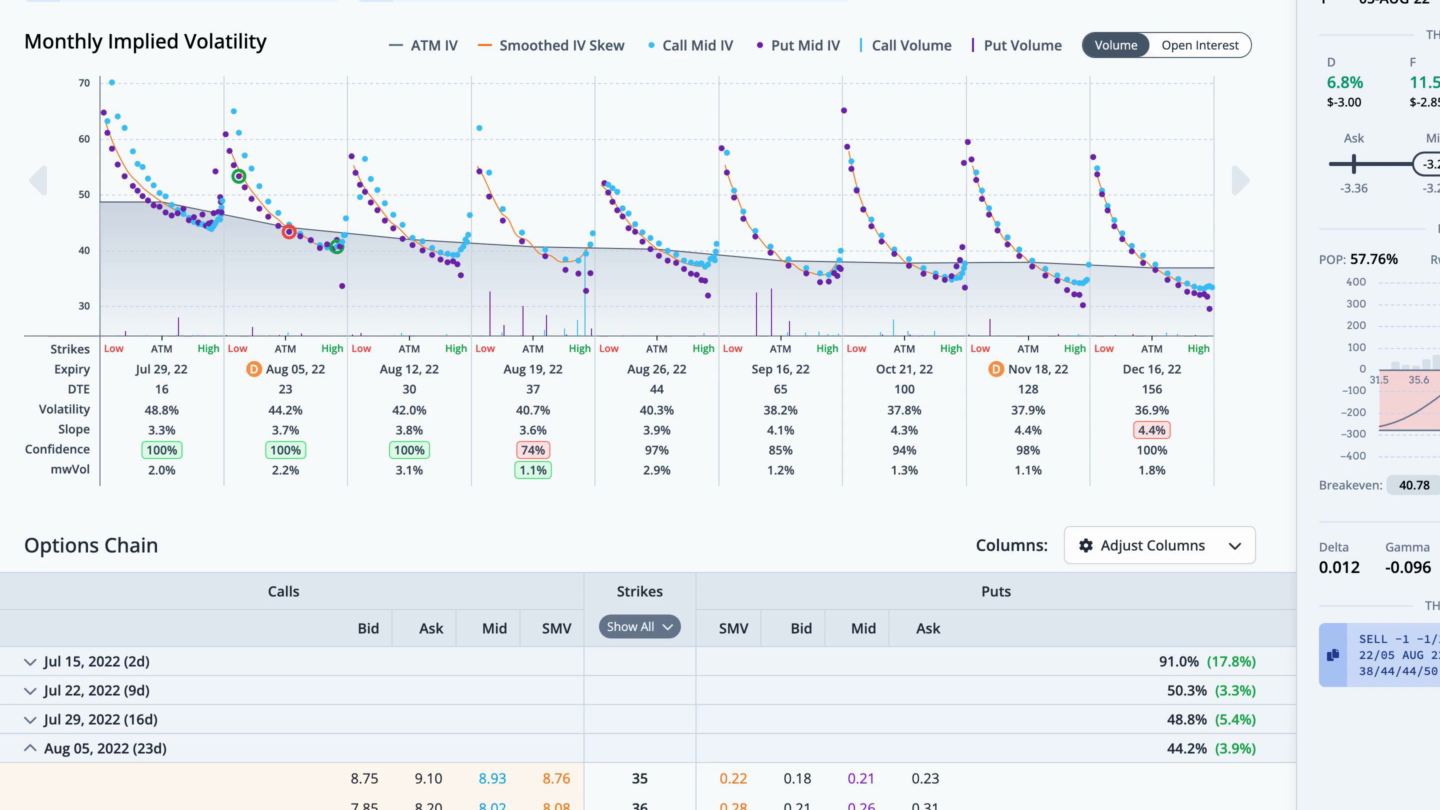
We can also see this trade overlaid on the monthly implied volatility graph in the chain tab. The legs for this trade are circled. For any questions or issues with the article, please contact otto@orats.com. To subscribe to the dashboard, please visit https://orats.com/dashboard


Disclaimer:

The opinions and ideas presented herein are for informational and educational purposes only and should not be construed to represent trading or investment advice tailored to your investment objectives. You should not rely solely on any content herein and we strongly encourage you to discuss any trades or investments with your broker or investment adviser, prior to execution. None of the information contained herein constitutes a recommendation that any particular security, portfolio, transaction, or investment strategy is suitable for any specific person. Option trading and investing involves risk and is not suitable for all investors.

About the Author: Matt Amberson, Principal and Founder of Option Research & Technology Services. ORATS was born out of a need by traders to get access to more accurate and realistic option research. Matt started ORATS to support his options market making firm where he would hire statistically minded individuals, put them on the floor, and develop research to aid in trading options. He is heavily involved with product design and quantitative research. ORATS offers data and backtesting on a subscription basis at www.orats.com. Matt has a Master’s degree from Kellogg School of Business.

What Is SteadyOptions?

12 Years CAGR of 114.5%

Full Trading Plan

Complete Portfolio Approach

Real-time trade sharing: entry, exit, and adjustments

Diversified Options Strategies

Exclusive Community Forum

Steady And Consistent Gains

High Quality Education

Risk Management, Portfolio Size

Performance based on real fills

Subscribe to SteadyOptions now and experience the full power of options trading!
Subscribe

Non-directional Options Strategies

10-15 trade Ideas Per Month

Targets 5-7% Monthly Net Return

Visit our Education Center

Recent Articles

Articles

  • Expanded Trading Hours for Select Equity Options

    The Cboe Options Exchange will start offering expanded trading hours for select high-liquidity single-stock equity options. The schedule features a morning Global Trading Hours (GTH) session from 7:30 a.m. to 9:25 a.m. ET and an afternoon Curb session from 4:00 p.m. to 4:15 p.m.

    By Kim,

    • 0 comments
    • 160 views
  • How LEAPS Differ From Short-Term Options

    LEAPS stands for Long-Term Equity Anticipation Security. Which is just a long-dated option, typically referring to those with expirations more than a year out. There’s no technical difference between LEAPS and shorter-term options other than the expiration date. They’re traded on the same exchanges and have the same rules surrounding margin and whatnot.

    By Pat Crawley,

    • 0 comments
    • 30700 views
  • Why Not to Hold Strangles Through Earnings

    In my previous article, I described a strategy of buying a long strangle a few days before earnings and selling them just before earnings. In this article, I will show why it might be not a good idea to keep those strangles through earnings.

    By Kim,

    • 0 comments
    • 5886 views
  • Pre-Earnings Entry Price: What 31,000 Cycles Say

    Every card in the scanner carries a block called How expensive is this entry? It compares what you would pay today against what the same setup cost on the same ticker at the same point in past cycles. I built that block in August. It reads well. But a reading that looks sensible and a reading that predicts something are different things, and until last week I had only the first.


    By Romuald,

    • 3 comments
    • 232 views
  • Expensive Compared to What?

    A trader looks at a pre-earnings straddle and asks whether it is expensive. It is the right instinct and the wrong question, because the word carries no meaning on its own. Expensive against what? A $12 straddle on a $200 stock is not expensive or cheap. It is $12.

    By Romuald,

    • 0 comments
    • 297 views
  • Beyond Strategies: What Options Traders Should Know

    Options education almost always begins with structures. Traders learn vertical spreads, calendars, butterflies, condors, covered calls and straddles, study the expiration diagrams, work out maximum profit and loss, and build a sense of the conditions each structure is supposed to suit. That foundation is necessary and there is no way around it.

    By Kim,

    • 0 comments
    • 686 views
  • SPX vs SPY Options: Which One Should You Trade? (2026 Guide)

    Both SPX and SPY options give you exposure to the S&P 500. They track the same 500 stocks, move nearly tick-for-tick, and offer the same core strategies — credit spreads, iron condors, butterflies, and 0DTE trades. Yet the two products settle differently, are taxed differently, and carry very different assignment risks.

    By krisbee,

    • 0 comments
    • 4372 views
  • Strike Price Effects Or Pinning Revisted

    Loyal readers of this blog will recall my post from 2019 “Pinning Down the ‘Option Pinning’”. If you have not heard of pinning have a look at that article as – spoiler – everything in it as well as Jeff Augen’s observations in his books which are referenced is still valid.

    By TrustyJules,

    • 0 comments
    • 1986 views
  • Could This Strategy Be The Holy Grail Of Investing?

    This is a reprint of my Seeking Alpha article from 2013. If you have SA subscription, you can read the full article including hundreds of comments here. For the record, the strategy implementation has changed since then, but the principle remains the same. You can read more here

    By Kim,

    • 6 comments
    • 5417 views
  • Why Traders Need Brokers: An Important Alliance

    Trading the financial markets can be rewarding, but it also offers its fair share of complexities and obstacles. When faced with thousands of financial instruments, fluctuating markets, and a range of platforms at their disposal, traders can feel overwhelmed.

    By Kim,

    • 0 comments
    • 2125 views

  Report Article


We want to hear from you!


There are no comments to display.


Join the conversation

You can post now and register later. If you have an account, sign in now to post with your account.
Note: Your post will require moderator approval before it will be visible.

Guest
Add a comment...

×   Pasted as rich text.   Paste as plain text instead

  Only 75 emoji are allowed.

×   Your link has been automatically embedded.   Display as a link instead

×   Your previous content has been restored.   Clear editor

×   You cannot paste images directly. Upload or insert images from URL.

Loading...