
Below is a presentation of both calculations. Note this is a discussion on the current portfolio. Actual losses in new or differently structured portfolios may vary dramatically.
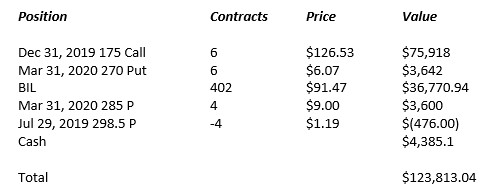
The current Leveraged Anchor portfolio looks like (as of July 15, 2019):
Before we continue, lets take a look at the model we posted in our Leveraged Anchor Implementation article when we just started the Leveraged Anchor implementation:
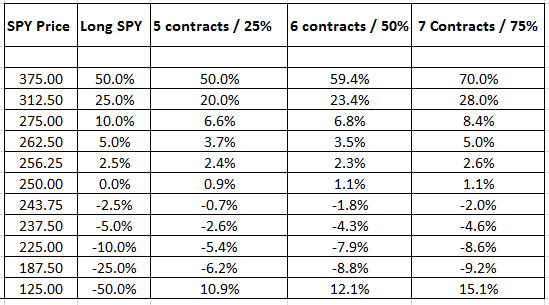
The current implementation is using 50% leverage.
SPY was up around 20% YTD on July 15, 2019. Based on the table, the Anchor was expected to slightly lag (1-2%). In reality, it produced 23.8% return, actually outperforming the markets.
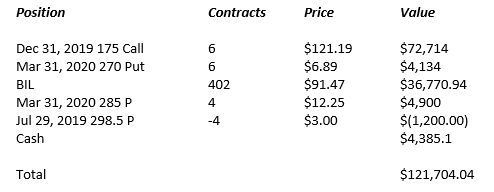
Now, lets look at the maximum loss. It is going to occur at some point after the long call is worth zero. Hypothetically, that would occur Dec 31 when there is zero time value left in the long calls. Let’s say there’s a catastrophic September 11 type event, and the markets open on December 31 at SPY 175. We picked 175 because that’s the “worst case” ending price of SPY. If it continues to go down after that point, our long puts become more profitable. In this hypothetical on December 31, the Leveraged Anchor Portfolio would look like:
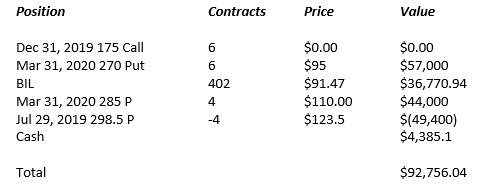
Our starting investment of the year was $100,000. In the event that the market declines 41% from its current position (30% from the start of the year price), the Leveraged Anchor portfolio would be down 7.5% on the year -- and that’s ignoring any additional cash we’d get between now and the end of the year from BIL dividends and put rolls. At that same time, the market as a whole would be down just over 30%. In other words, a good result.
For those who want to see what a bigger crash would look (as opposed to just trusting that bigger crashes are better), below assumes a price of SPY 100 on December 31:
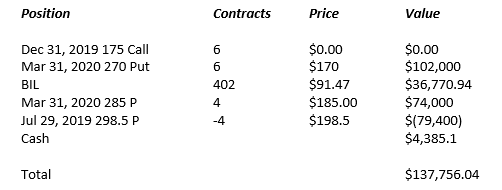
As noted earlier, the farther the market drops below 175, the better the Leveraged Anchor will perform. If the market dropped 60% YTD, Anchor would be up 37.7%. As currently constructed if we make no more trades, the worst case scenario of the year is down 7.5%. This is significantly better than being simply long in the market.
However, all of the above assumes a “static” investment – ignoring the rolls of the short puts, the return of BIL, and other dynamic events. It is entirely possible to end with a result worse than above if the market enters a prolonged “slow” decline, as you would lose some on the short puts each time they were rolled.
Take the following example which assumes that on July 29, the market is at SPY 295.5 – only slightly below our present price of around 298.5 (prices were derived using CBOE’s option calculator):
Due to the small decline in SPY, a loss on the short puts would be realized, but the benefit of the long puts has not really kicked in. This can easily continue until SPY gets to the 270 range. If the market follows a down trending pattern which looks like:
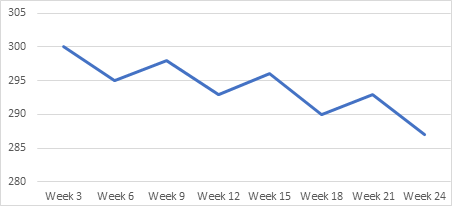
then we end up with the true worst case scenario, as not only have the long calls lost value, but we have lost value rolling the short puts every three weeks. Note to reach this worst case scenario, there is a price decline over 3 weeks, so we fully realize the loss on the sort puts, but then there’s a market rebound leading to a sale of a put at a higher level (that is not quite as high as the original price), followed by another 3 week decline. Both Leveraged Anchor and Anchor suffer the most when there is a 3 week market decline, followed by a rebound back up, followed by a three week decline, and this pattern continues for an extended time. This can lead to the bleeding of a few thousand dollars each roll period.
If you assume that style of decline over the entire year leading up to the long call expiration (7 more three week periods), it would be possible to lose another $20,000 or so, just depending on the angle of descent of the market decline – the shallower the decline, the worse off Anchor would be. This is part of the reason why Leveraged Anchor has the short puts hedged at the money, while the long calls are hedged five percent out of the money. By hedging the short puts at the money, we reduce the potential drawdowns from a slow decline pattern.
Of course, in the history of the stock market, the above charted pattern has never declined in that orderly of a fashion for a six month period, much less an entire year. It’s much more frequent to have sharper declines, rebounds back above the original price, flat periods, etc.. The chance of going down then back up almost to the starting point, then back down – all on exact 3 week cycles, isn’t likely, but it could happen. Once the stairstep down pattern hits the long hedge, small bleeding really starts to be limited, as that hedge goes up in value.
In this worst case, performance of the Anchor strategy will be the worst in a market with an extended pattern as graphed above until the hedge kicks in. This result would be worse than the 7.5% “one day” catastrophic worst case loss scenario.
In our opinion, the “worst” loss someone should expect in the current portfolio is somewhere around a 15% decline from the starting $100,000 investment. That would require significant “stair stepping” down, in three-week cycles, and the price of SPY ending up right at 175 in December. That is an awfully specific set of conditions that has to be met to reach that point, but it certainly could happen. (Note: this is not the maximum theoretical loss, rather our maximum expected loss. The maximum possible loss should everything go wrong is higher).
Remember, the above is a “worst case” analysis – which Anchor is certainly designed to combat and provide better alternatives than simply being in the market. The above analysis shows Anchor will still significantly out-perform the market in major declines, but it is not “lossless” as some people believe.
Personally, I greatly appreciate the tradeoff in a catastrophic event or even in sharp downturns. But I also understand the risks, worst case scenarios, and the market conditions which damage the trade the most. Anyone trading the strategy should have such an understanding.
If you would like to give it a try, you can sign up here.
Christopher Welsh is a licensed investment advisor and president of LorintineCapital, LP. He provides investment advice to clients all over the United States and around the world. Christopher has been in financial services since 2008 and is a CERTIFIED FINANCIAL PLANNER™. Working with a CFP® professional represents the highest standard of financial planning advice. Christopher has a J.D. from the SMU Dedman School of Law, a Bachelor of Science in Computer Science, and a Bachelor of Science in Economics. Christopher is a regular contributor to the Steady Options Anchor Trades and Lorintine CapitalBlog.
Related articles:
- Leveraged Anchor Implementation
- Leveraged Anchor Is Boosting Performance
- Leveraged Anchor: A Three Month Review

There are no comments to display.
Join the conversation
You can post now and register later. If you have an account, sign in now to post with your account.
Note: Your post will require moderator approval before it will be visible.