

Why new developments call for a fresh look at pinning
Here are, however, specific reasons to revisit pinning as a retail option investor strategy and the first and foremost of this was the announcement on April 16 by the SEC as reported (in this case) by Schwab:
"...Under the new rules, traders will no longer be required to maintain a minimum account balance of $25,000 to engage in frequent margin day trading. Instead, eligible margin accounts of more than $2,000 will gain access to intraday margin buying power set by individual brokerages based on current positions and maintenance margin requirements.
Currently, under the old rules, four or more day trades in five business days triggers a "pattern day trader" designation and the $25,000 requirement. Under the new framework, the pattern day trader designation will be eliminated, and day trades will no longer be counted...." (or see this video)
1) The biggest limitation to use pinning or expiry strike price effects was the pattern day trader issue. Inevitably strike price effects whilst usable from the Thursday before expiry to the Friday concentrated on the last trading day. Relatively complex positions are required with three or more legs and therefore pattern day trading was unavoidable. This in turn meant that $25,000 had to be in your account and yada yada. Well this is no longer the case and we can trade freely with most brokers;
2) The advent of 0DTE options has contributed massively to an increase in strike price effects. Older research attributed strike price effects to market makers unwinding massive static open positions built up over month at the crunch time of the 3rd Friday expiry. The effects being strongest at the so called ‘triple witching hour’ when stock index futures, stock index options and stock options would expire (3rd Friday of March, June, September and December respectively). With the multiplication of expiries this has decreased dramatically but the advent of shorter options drives market maker gamma hedging. Positive gamma (net long options) forces market makers to buy shares when a stock drops and the reverse if it rises. This creates a mean-reversion mechanism that drives stocks towards strike price levels.
3) A great deal more study was expended looking at the 0DTE options and they have validated something noted in the 2019 article: mid-strike pinning. At the time it was an empirical observation that stocks prone to pinning sometimes gravitated to the exact mid-point between strikes and pinned there instead. This phenomenon is now known as the gamma wall. Competing hedging behaviour finds an exact equilibrium which causes a pin at the mid-level as every hedge needs to be either over or under the current stock price. As the market is a random phenomenon market, makers cannot choose altogether to go for the one or the other. The stock then becomes stuck in a liquidity pocket halfway between strikes.
In other words pinning and strike price effects are alive and well and in fact exploitable more than ever.
Strike price effects: pinning, crosses, wild trading
Steady Options is a unique service in that it proposes strategies that are typically appropriate for the retail investor. Most of us are unable to harness quant strategies or massive positions exploiting minute arbitrage pricing differences. Many people feel that the game is therefore rigged in favour of big money. Sure, if you go head to head with Goldman Sachs you will be crushed. What else would you expect? It’s like going head to head boxing with Mike Tyson in his prime.
The retail investor benefits from his ability to trade small, which means better prices than those opening very large positions. Furthermore, there are certain phenomena like rising volatility towards earnings or the effect of additions to the S&P index that cause predictable effects on elements involved in option pricing. A retail investor can count on those and exploit them where a larger investor would find the market as a whole moving if he attempted the same.
Pinning is a phenomenon that certain stocks gravitate towards the strike price of an option on the expiry of that option (generally Friday). Pinning is deemed to occur if the stock price remains (and ends) within 15% of strike spacing. This is an adaptation of Jeff Augen’s approach which used static values to determine whether pinning occurs or not.
|
Nominal Stock Price |
Strike Spacing |
Old Static Threshold |
Dynamic Threshold (15% of Spacing) |
|
$40.00 |
$1.00 |
$0.40 (Too loose) |
$0.15 |
|
$150.00 |
$2.50 |
$0.40 (Perfect) |
$0.37 |
|
$350.00 |
$5.00 |
$0.40 (Too tight) |
$0.75 |
|
$600.00 |
$10.00 |
$0.40 (Impossible) |
$1.50 |
This simple visual from my previous article with a live example by AAPL speaks plainly enough as regards to the phenomenon of pinning itself:
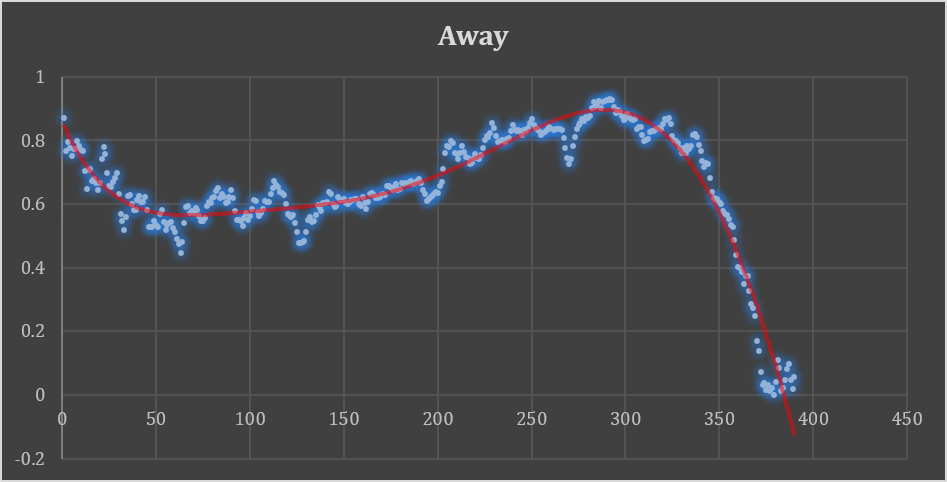
Figure 1: APPLE 17 March 2017 Expiry
The Y-axis is in dollars representing the amount that the stock was trading away from a strike price. The X-axis represents the number of minutes since trading started (a total of 390 minutes).
As noted, a stock can also pin in between strikes – a so called mid-way pin. One needs to analyze specific stocks to make a choice but the phenomenon sometimes takes the shape of the above with a sudden plunge or rise towards a strike. At other times a stock will cross a strike price over and over during the final trading day.
Another known strike price effect is the sudden inflation of IV (Implied Volatility) towards the day prior to expiry (usually Thursday) around 4 p.m. and the deflation of that IV in the first half hour of trade on the Friday morning. Same as with our earnings or SPY addition trades, no effect is repeated 100% of the time, in fact even in ideal conditions the effect occurs only 50% of the time. Any strategies must therefore be combined with clear risk limitation tactics taking into account we also know that IV will rise exponentially as we near the bell for ATM strikes.
Which stocks are suitable?
Broad research shows all stocks are affected – oddly even ones without options – however most option strategies that can be used to exploit them require liquidity and narrow spreads. Here is a list of requirements that need to be fulfilled, ideally in all cases but in any case not massively off target:
-
Liquid large cap optionable stocks with small spreads and a stock price over 100$ or more.
-
The general environment must be one of low VIX – if VIX is high you will get ripped because of underlying market effects.
-
Absence of macro catalysts, so no morning CPO, FOMC, significant earnings by market moving stocks and above all shield us from Trump tweets.
-
Check open interest on the day – it should be heavily stacked on a single psychological strike generally a round number or at least a multiple of 5. This should be quite asymmetric to the remainder of stock open interest at other strikes.
- The expiry day strike price effects occur over a slightly broader range than my original article averred. You can start looking for effects around 11 a.m. right up to even 1 p.m.. Closing always before the end of day and a minimum of 15 minutes as closing minutes get crazy. If we speak of volatility effects of the end of day before expiry the opening should be around 4 p.m. and closing maximum 30 minutes after the opening.
With the proliferation of expiry dates, Friday is not necessarily the only day but liquidity remains the biggest issue. AAPL remains a pinning stalwart and before its company split FDX was the loose electron that would gravitate over and under a strike. GS, MA, NVDA and similar stocks are all worth examining for potential strike price effect opportunities.
What option strategies are suitable?
In options trading nothing beats being right on direction whatever that direction is, so this includes the stock being stationary. How to exploit that knowledge really has no limit due to the flexibility of options as a trading instrument. Here are just some scenarios with stocks that you believe will pin. The ideas can be tweaked based on the situation.
Exploiting the day before expiry
This builds on the brief collapse in volatility after 4 p.m. on Thursday, its reinflation on Friday morning and the fall again after 10 p.m. that day. A simple way is the ratio trade for example if the stock is between strikes S and S+1 (the +1 in this case being the next optionable strike not 1$ necessarily). The position is to be opened on Thursday around 4 p.m. if the other criteria for strike price effects (see above) have been met.
- Buy 10 calls of next day expiry at S
- Sell 30 calls of next day expiry at S+1
The position should be closed at 10a.m. on Friday and will generate substantial profits even if the stock rises to the S+1 strike price. This is due to volatility decreasing and theta decay. A heavy drop in the stock will be buffered and losses should be manageable. Likewise an unexpected strong rise of the stock is temporarily buffered by the volatility loss and the long underlying position. The position is not proof to all circumstances but simply sufficiently flexible to bail if it goes sideways.
If the stock is really pinning at S+1 you should hold till the end as that will maximize profits. On the hand a massive, runaway gap up past represents a maximum risk zone, which is why a disciplined hard exit at Friday's 10 a.m. open is non-negotiable.
The classic pin
This strategy presumes that you see pin occurring at a particular strike S. As stated, that should become apparent between 11 a.m. to 1p.m. on the expiry day. The lull in trading caused by lunch is helpful to get good prices.
- Buy 10 calls at S-1
- Sell 30 calls at S
- Buy 20 calls at S+1
- or Buy 20 calls S=2 to limit margin and have an open balanced wing butterfly.
This position should be closed at the latest 10-15 minutes before the bell when ideally the value of the ATM calls has been bled dry by theta. It relies fully on a real pin at a strike occurring and will lose money in free trading or mid-pin outcomes.
A less trade intensive variant is to sell a call or put at S (the pinning strike) and buy the same one week out. You then wait for the short option to bleed its premium whilst the smaller amount of theta bleeding from your long still protects you in case things go sideways.
The mid-way pin
If you foresee the stock sticking between two strikes one can open an Iron Condor ‘Plateau’ spread (again between 11 a.m. to 1 p.m. on the expiry day).
- Buy 1 Put at (OR S-1)
- Sell 1 Put at -1 (OR S)
- Sell 1 Call at (OR S)
- Buy 1 Call at (Or S+1)
Like all these strategies, you can’t afford to walk away whilst this is playing out but the set-up works in case of a mid-strike pin and if held to (near) the end even if S-1 or S+1 are reached. The biggest issue used to be that not many stocks provide sufficient premium to make it worth one’s while to open this but it is possible with some high volatility high priced stocks. With the current run of high value tech stocks, however, the story is different and IC premiums can be attractive.
Utilizing crosses-gamma scalping
As mentioned some stocks are known– FDX was notorious for this at least until their stock divestment – for not pinning in a fixed manner but continually crossing a pinning strike either to the upside or the downside. The idea in this case is to utilize the lull in trade as of 11am to 1pm to open a straddle at S if the stock happens to be there.
If the stock moves up or down, one or the other side of the spread will make a gain. Occasionally this in itself will be enough to take a profit but usually it is not. The trick is then to delta hedge by either going long or shorting shares to neutralize your delta. Option software to know how many shares to sell is helpful here but one can eyeball it to a degree. Once the stock moves back to S one can close the stock position (or the whole position) and make small gains.
Beware of attempting to sell short straddles when the stock is away from S, pinning happens tops 50% of the time so you can find yourself with a huge loss if the stock goes to S+1 or S-2 whilst the profits from all the above strategies are modest.
Finding candidates
As mentioned above, we need high liquidity stocks with massive option volumes and a clear indicator in the open interest that a pinning situation or crossing is on the books. With the advent of AI, things have become considerably simpler compared to 2019 when the previous article was published. At the time there was nothing for it but to laboriously download data and run analyses through excel on it (at least as a retail investor). With the help of AI we have created a number of little python scripts which can help you.
They can be run from python directly if you have that installed but you can also run it in Google Colab. When you run this simple script (see file below entitled simple script), you will be asked to input a ticker, a date for which you want to run the analysis – limited in this case to the previous 4 weeks as the source is Yahoo which is free for that period – and then an entry time. You will get – for example for MSFT – an output like this:
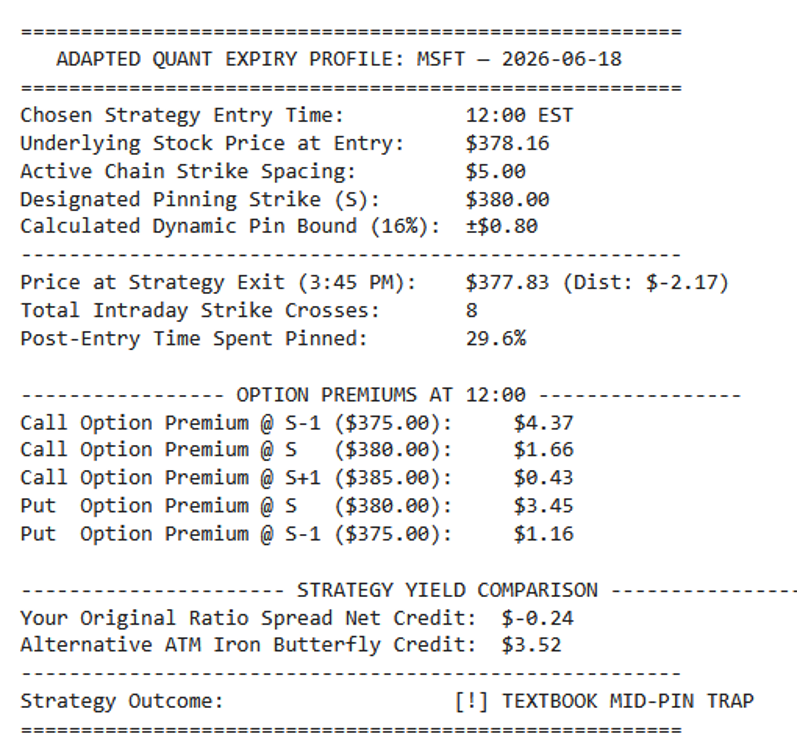
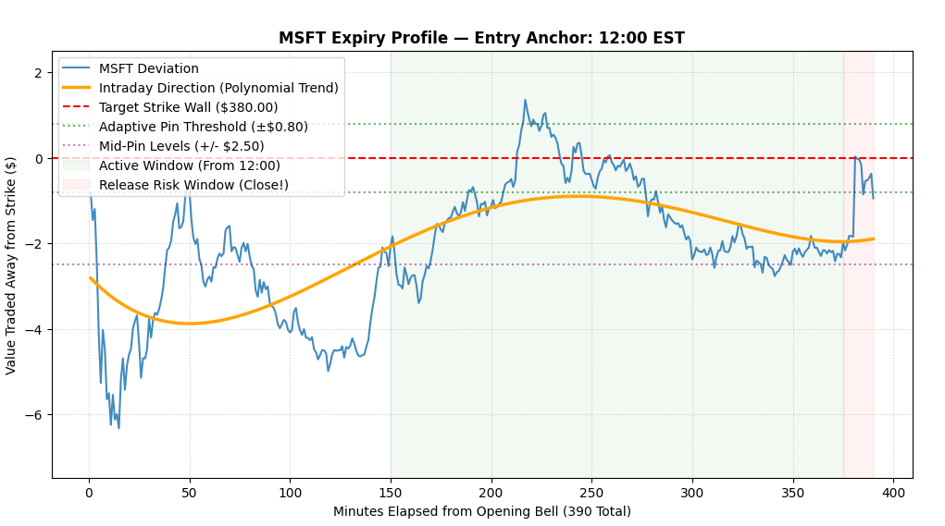
So in this example MSFT did a min pin level for most of the trading and a strategy utilizing that and closed in time would have yielded a good result. Historical outcomes do not guarantee a repeated pattern but the idea is to visualize for you how you can identify what the potential pinning level might be and see where trades might have been successful. This can then help you to open positions.
The second script (see file below called complex script) is a little more involved, it requires you to have a polygon.io account (free) so that the minute by minute stock data can be downloaded. If you register, your dashboard will give you an API Key that you need to paste in to run it. The script requires 10 minutes+ to run because there is a limit on the amount of data you may download. It gives the following output for, again, MSFT in this case:
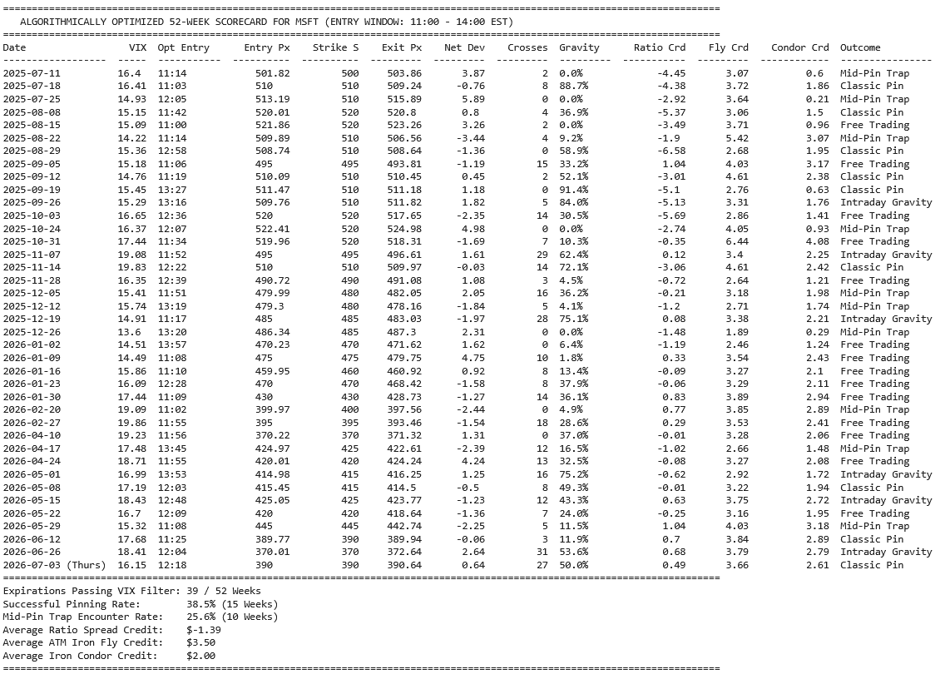
Note that the values for the option spreads are based on Black & Scholes and not downloaded data. They are not going to be identical to what’s in the market but not a million miles away either. In this case we asked the script to determine the best entry price rather than asking it to pick one as that wouldn’t make sense during a whole year. The outcome is that actually the midday lull – after major morning institutional activity is over – remains the best time to take the jump to open a position. Waiting until at least 12 noon reduces the number of Free Trading outcomes – that is where no perceptible pinning occurred – to 25% or less. What is also clear is that when VIX is higher – i.e. over 16 – more free trading failures occur, whereas below this the number of successful trades is almost double.
The cross count column is a powerful indicator of market maker positioning. The distributions across your 39 weeks reveal a stark reality:
- Intraday Gravity Days: Feature a massive average of 20.2 strike crosses.
- Classic Pin Days: Feature a clean average of 7.3 strike crosses.
- Mid-Pin Trap Days: Feature a low average of just 4.4 strike crosses.
If you enter a trade during the midday lull and the stock begins to continuously slice back and forth across your target strike, market-maker gamma walls are actively trapping the asset. The heavy volume is forcing a tight mean-reversion around that strike pivot.
However, if you establish a position and the stock drifts away without crossing your strike at least twice within the first 30 minutes, the gravity is absent. Given the low cross average on trap days, the asset is likely locked into a clean, low-friction trajectory straight toward a mid-pin hit.
For MSFT – based on the last year – a good guide seems to be to open after 12 noon, to avoid ratio strategies if VIX is under 16 but to use an Iron Condor instead. Note that this requires a stock that has a high price – around $300+ although a high beta-stock will also work. Finally, if within 30minutes of opening the trade there are few crosses you should consider that the position might migrate to a mid pin. Change your position in function of that.
Finding what works
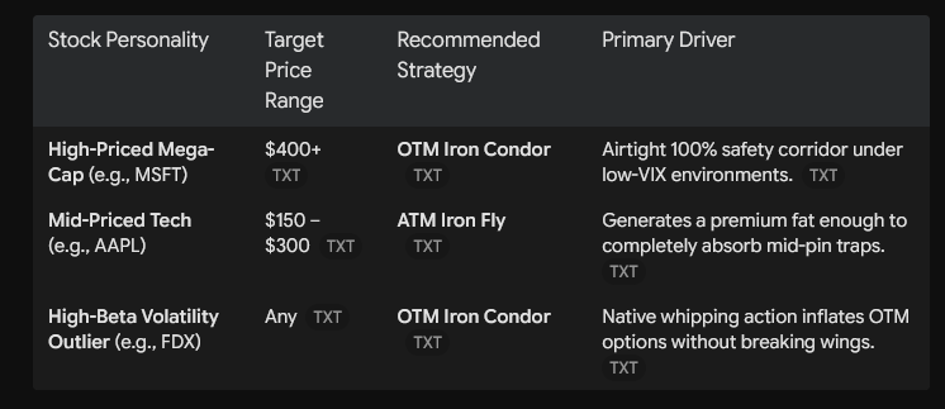
Without boring everyone with the various back-tests that were carried out, analysing stocks with rather different characteristics in the manner described above yielded an interesting playbook of strategies to play.
- Check the VIX. If it is printing above 20.0, walk away. Institutional fear is too high for pinning to work.
- If trading a High-Priced Mega-Cap (e.g., MSFT): Check the morning session's realized volatility proxy. If it passes your 17% VIX floor, deploy an OTM Iron Condor (Short Put / Short Call). It provides an airtight, 100% historical safety net.
- If trading a Mid-Priced, Low-Beta Tech Asset (e.g., AAPL): Completely avoid the OTM layout—the market won't pay you enough to justify the margin. Instead, deploy the ATM Iron Fly to harvest a premium cushion that neutralizes the mid-pin traps.
- If trading a High-Beta Volatility Outlier (e.g., FDX): Again deploy the OTM Iron Condor. The asset's native whipping action guarantees a good premium payout to sit safely behind a wide strike wide protective boundary.
Remember also that the cross-count is a key indicator whether things are going as you expected or not. This is not a fire and forget kind of strategy but one where you sit behind your computer and watch the skies err... the market.
Conclusions
Pinning is alive and well and there are opportunities for retail traders for the very good reason that institutionals cannot profitably trade such tiny volumes easily. Whether it is a good strategy does depend on the environment and low VIX at the minimum is required or it becomes too risky. Oddly, another factor that is important is the high prices of current high liquidity stocks – this facilitates the use of Iron Condors or Iron Flies which can show excellent outcomes based on holding a position for just a few hours or less. As usual, you do have your eggs in one basket so you’d better watch that basket. In 2019 we estimated a 6% per month return was possible taking into account inevitable losses. With the refinement and encompassing of mid-pin outcomes which enables us to be >60% in having a pin, mid-pin or mid-day gravity outcome, we should have better results than before.





There are no comments to display.
Join the conversation
You can post now and register later. If you have an account, sign in now to post with your account.
Note: Your post will require moderator approval before it will be visible.