SteadyOptions is an options trading forum where you can find solutions from top options traders. Join Us!

We’ve all been there… researching options strategies and unable to find the answers we’re looking for. SteadyOptions has your solution.

SteadyOptions 2019 Performance Analysis


Steady Options model portfolio produced 41.7% gain in 2019. This is a very good return by any standards, but well below our long term returns. In the name of full transparency and our continuous learning, we are providing a full analysis of the 2019 numbers.

First, as one of our members wrote, how many traders would consider 40%+ returns as subpar? We are definitely in a good shape if 41.7% is considered "well below" average. Most traders would be delighted to have our worst year as their best…But lets see what happened in 2019.

Each year, our contributor @Yowsterbreaks down the numbers by trade type. Here is .


As you can see, our returns have been heavily impacted by few big losers back in January and May. You can read a full analysis of January 2019 performanceWe had some very large losing trades:

  • Index trades (SPX, TLT, EEM, XLV): 4 big losing trades SPX (-100%, -100%, -72.9%) and TLT (-100%) killed the performance of these trades this year.
     
  • VIX-based trades: 3 losing trades which play for VIX to fall from highs, or looking for movement in either direction all failed.
     
  • Broken-wing Butterfly (BWB) Trades: One big -96% losing trade exceeded the gains from all winning trades.

Of the top 10 losers only one was from the calendar or straddle trades (and it was at #10). Take away those 10 biggest losers and the model portfolio gain gets to ~90% (non compounded).

When you dig into the numbers you see that the overall contribution from our “bread and butter” calendar and straddle trades is on par with prior years (multiply avg gain per trade by number of trades).
 

Since May we made some adjustments, and in the second half of 2019 the model portfolio was up 63%, which translates to annualized compounded return of 165%, in line or better with our previous years. Our core strategies continue to work very well. In fact, if we traded only straddles, calendars and ratios, the yearly return would be well into the triple digits.

Going forward, the goal is to avoid those bigger losses, and we are going to reduce the number of those higher risk trades and focus mostly on straddles, hedged straddles, calendars and ratios.


On a related note, I got the following message from one of the former members:

"So it is fair to say that there is definitely luck involved in trading any trading strategy. I happened to select to test your system at probably the worst 6 month period you have had in 8 years. Any other 6 month period … including 3 months earlier or three month later…  would have provided drastically different results."

This is true, but isn't it true for any investment? Someone who entered the stock market in March 2009 would have drastically different results from someone who started in 2007 and experience the 50% drawdown.

This is also true for many best performing stocks. Apple, Amazon and Google produced i
ncredible gains since their IPOs, but also experienced few large drawdowns, ranging from 65% to 94%. Of course those stocks have also experienced many smaller pullbacks of 20-25%. If you owned one of those stocks and sold them after each pullback, you would never achieved those long term results.

In a similar way, if you started SteadyOptions subscription in December 2018 and cancelled after the January drawdown, you would missed the following 63% recovery. If you cancelled after our previous drawdown in 2016, you would missed the following gains of over 400%.


Drawdowns are an inevitable part of achieving high returns. If you haven’t yet experienced a significant decline, then you probably haven’t owned something that has appreciated 10x, 20x or more. Or you simply haven’t been investing for that long.

All big winners have drawdowns. Accepting this fact can go a long way toward controlling your emotions during periods of adversity and becoming a better investor.

To put things in perspective, SteadyOptions produced Compounded Annual Growth Rate of 120.3% since inception. You cannot produce such high gains without taking some risk. We are trying to avoid the drawdowns as much as possible, but the truth is that 20% drawdowns are normal and expected for a strategy that produces such high returns.

Finally, take a look at SteadyOptions historical performance:

image.png

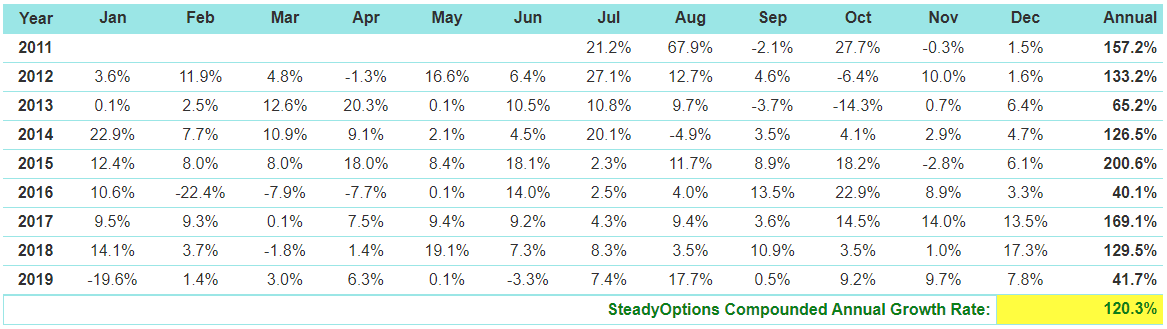
Only 3 out of 9 years we produced "subpar" double digit returns. If the historical pattern continues, the next 2 years should be very rewarding.. Stay the course!
 

What Is SteadyOptions?

Full Trading Plan

Complete Portfolio Approach

Real-time trade sharing: entry, exit, and adjustments

Diversified Options Strategies

Exclusive Community Forum

Steady And Consistent Gains

High Quality Education

Risk Management, Portfolio Size

Performance based on real fills

Subscribe to SteadyOptions now and experience the full power of options trading!
Subscribe

Non-directional Options Strategies

10-15 trade Ideas Per Month

Targets 5-7% Monthly Net Return

Visit our Education Center

Recent Articles

Articles

  • SPX Options vs. SPY Options: Which Should I Trade?

    Trading options on the S&P 500 is a popular way to make money on the index. There are several ways traders use this index, but two of the most popular are to trade options on SPX or SPY. One key difference between the two is that SPX options are based on the index, while SPY options are based on an exchange-traded fund (ETF) that tracks the index.

    By Mark Wolfinger,

    • 0 comments
    • 436 views
  • Yes, We Are Playing Not to Lose!

    There are many trading quotes from different traders/investors, but this one is one of my favorites: “In trading/investing it's not about how much you make, but how much you don't lose" - Bernard Baruch. At SteadyOptions, this has been one of our major goals in the last 12 years.

    By Kim,

    • 0 comments
    • 884 views
  • The Impact of Implied Volatility (IV) on Popular Options Trades

    You’ll often read that a given option trade is either vega positive (meaning that IV rising will help it and IV falling will hurt it) or vega negative (meaning IV falling will help and IV rising will hurt).   However, in fact many popular options spreads can be either vega positive or vega negative depending where where the stock price is relative to the spread strikes.  

    By Yowster,

    • 0 comments
    • 788 views
  • Please Follow Me Inside The Insiders

    The greatest joy in investing in options is when you are right on direction. It’s really hard to beat any return that is based on a correct options bet on the direction of a stock, which is why we spend much of our time poring over charts, historical analysis, Elliot waves, RSI and what not.

    By TrustyJules,

    • 0 comments
    • 472 views
  • Trading Earnings With Ratio Spread

    A 1x2 ratio spread with call options is created by selling one lower-strike call and buying two higher-strike calls. This strategy can be established for either a net credit or for a net debit, depending on the time to expiration, the percentage distance between the strike prices and the level of volatility.

    By TrustyJules,

    • 0 comments
    • 1,479 views
  • SteadyOptions 2023 - Year In Review

    2023 marks our 12th year as a public trading service. We closed 192 winners out of 282 trades (68.1% winning ratio). Our model portfolio produced 112.2% compounded gain on the whole account based on 10% allocation per trade. We had only one losing month and one essentially breakeven in 2023. 

    By Kim,

    • 0 comments
    • 5,891 views
  • Call And Put Backspreads Options Strategies

    A backspread is very bullish or very bearish strategy used to trade direction; ie a trader is betting that a stock will move quickly in one direction. Call Backspreads are used for trading up moves; put backspreads for down moves.

    By Chris Young,

    • 0 comments
    • 9,488 views
  • Long Put Option Strategy

    A long put option strategy is the purchase of a put option in the expectation of the underlying stock falling. It is Delta negative, Vega positive and Theta negative strategy. A long put is a single-leg, risk-defined, bearish options strategy. Buying a put option is a levered alternative to selling shares of stock short.

    By Chris Young,

    • 0 comments
    • 11,140 views
  • Long Call Option Strategy

    A long call option strategy is the purchase of a call option in the expectation of the underlying stock rising. It is Delta positive, Vega positive and Theta negative strategy. A long call is a single-leg, risk-defined, bullish options strategy. Buying a call option is a levered alternative to buying shares of stock.

    By Chris Young,

    • 0 comments
    • 11,519 views
  • What Is Delta Hedging?

    Delta hedging is an investing strategy that combines the purchase or sale of an option as well as an offsetting transaction in the underlying asset to reduce the risk of a directional move in the price of the option. When a position is delta-neutral, it will not rise or fall in value when the value of the underlying asset stays within certain bounds. 

    By Kim,

    • 0 comments
    • 9,667 views

  Report Article

We want to hear from you!


There are no comments to display.


Create an account or sign in to comment

You need to be a member in order to leave a comment

Create an account

Sign up for a new account. It's easy and free!


Register a new account

Sign in

Already have an account? Sign in here.


Sign In Now

Options Trading Blogs