SteadyOptions is an options trading forum where you can find solutions from top options traders. Join Us!

We’ve all been there… researching options strategies and unable to find the answers we’re looking for. SteadyOptions has your solution.

Long and Short Straddles: Opposite Structures


Simplification: We can all better understand options trading by removing the complexity so often seen in articles. One of the best ways to understand the profit potential and risk levels of any options strategy is through diagrams and a demonstration of the formula.

The long and short straddle are normally understood only in terms of how money flows. In a long straddle, the trader pays, and risk is mainly one of time versus price movement. In a short straddle, the trader is paid, and risk involves time decay and time to expiration. But does this really explain how these two strategies work?
 

In both forms of the straddle, the key to risk and profit potential is volatility. But the significance is opposite. A long trader tends to realize the greatest possibility of profits when underlying volatility is high; a short trader relies on declining time value and will reduce exercise risks when volatility is low.


Long profits
 

The formula for maximum profit in a long straddle is twofold, as maximum profit will be found at the upper price or the lower price:

            U – S – ( P + F ) = Pu

                S – U – ( P + F ) = Pl

            When  U = underlying price

                        S = strike

                        P = premium paid

                        F = trading fees

                        Pu = upper profit

                        Pl = lower profit


Breakeven point also is found at two price points:


                        S + P + F = Bu

                        S – P + F = Bl


When  S = strike

                        P = premium paid

                        F = trading fees

                        Bu = upper breakeven

                        Bl = lower breakeven


Finally, maximum loss occurs when the underlying price is at strike at expiration. Both sides expire worthless and loss is equal to premium paid:

                        P + F = M


            When  P = premium paid

                        F = fees paid

                        M = maximum loss


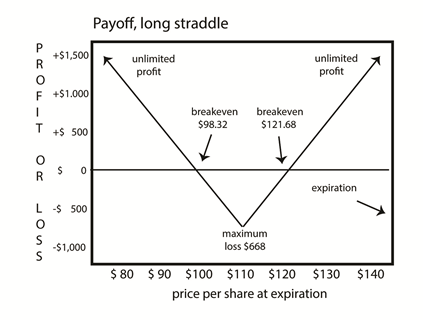
For example, a long straddle consists of the following positions:

            Buy one 105 call, ask 3.40 plus trading fees = $349

            Buy one 105 put, ask 3.10 plus trading fees = $319

                        Total debit $668


Possible outcomes, assuming a movement in the underlying of 8 points:


            Upper profit: 113 – 105 – 6.68 = $132

            Lower profit: 105 – 90 – 6.68 = $832

            Upper breakeven: 105 + 6.68 = $121.68

            Lower breakeven: 105 – 6.68 = $98.32

            Maximum loss: 6.50 + 0.18 = $668


These outcomes are diagrammed in the following payoff chart.


image.png  


Short profits


The opposite occurs for a short straddle. Traders want underlying prices to remain as close as possible to the strike so profits will result from declining time value and, ultimately, worthless expiration.
 

Although short straddle profits are limited to the net premiums received, the strategy is appealing to those willing to be exposed to the risk. Maximum profit is:

            P – F = M

            When  P = premium received

                        F = trading fees

                        M = maximum profit


Breakeven occurs at two points, upper and lower:


            ­S + ( P – F ) = Bu

            S – ( P – F ) = Bl


            When   S = strike

                        P = premium received

                        Bu = upper breakeven

                        Bl = lower breakeven


Maximum loss is unlimited and depends on how far the underlying price moves. It occurs at two points:

            U > S – ( P – F )

            U < S – ( P – F )


            When  U = underlying price

                        S = strike

                        P = premium received

                        F = trading fees


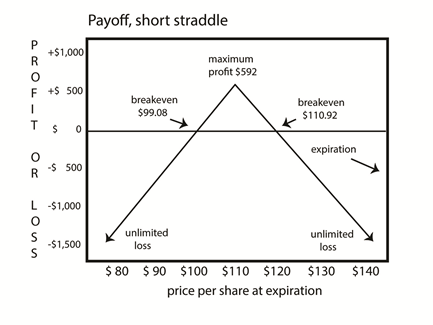
For example, a short straddle is constructed with the following positions:

            Sell one 105 call, bid 3.20, less trading fees = $311

            Sell one 105 put, bid 2.90, less trading fees = $281

                                    Net credit = $592


Outcomes for this trade, assuming a 215-point movement ibn the underlying, are:

            Maximum profit: $610 - $18 = $592

            Upper breakeven: 105 + 5.92 = $110.92

            Lower breakeven: 105 – 5.92 = $99.08

            Upper loss: 112 – 5 – 5.92 = $108

            Lower loss: 105 – 97 – 5.92 = $208


These outcomes are also summarized in the diagram.


image.png


The complexity of the long and short straddle is clarified by the realization that they operate in opposite directions – limited profit versus unlimited profit, and limited risk versus unlimited risk.
 

The nature of the short straddle must be further modified by the realization that collateral is required. For two positions, a total equal to potential exercise requires deposit of a significant sum. As a result, capital is tied up between position entry and expiration date. A completely accurate analysis should include calculation of the internal rate of return, given the requirement for depositing capital in the margin account. This is a significant variable; the longer the time to expiration, the more expensive it is to open a short straddle.


Michael C. Thomsett is a widely published author with over 80 business and investing books, including the best-selling Getting Started in Options, coming out in its 10th edition later this year. He also wrote the recently released The Mathematics of Options. Thomsett is a frequent speaker at trade shows and blogs on his websiteat Thomsett Guide as well as on Seeking Alpha, LinkedIn, Twitter and Facebook.

Related articles:

What Is SteadyOptions?

Full Trading Plan

Complete Portfolio Approach

Real-time trade sharing: entry, exit, and adjustments

Diversified Options Strategies

Exclusive Community Forum

Steady And Consistent Gains

High Quality Education

Risk Management, Portfolio Size

Performance based on real fills

Subscribe to SteadyOptions now and experience the full power of options trading!
Subscribe

Non-directional Options Strategies

10-15 trade Ideas Per Month

Targets 5-7% Monthly Net Return

Visit our Education Center

Recent Articles

Articles

  • SPX Options vs. SPY Options: Which Should I Trade?

    Trading options on the S&P 500 is a popular way to make money on the index. There are several ways traders use this index, but two of the most popular are to trade options on SPX or SPY. One key difference between the two is that SPX options are based on the index, while SPY options are based on an exchange-traded fund (ETF) that tracks the index.

    By Mark Wolfinger,

    • 0 comments
    • 433 views
  • Yes, We Are Playing Not to Lose!

    There are many trading quotes from different traders/investors, but this one is one of my favorites: “In trading/investing it's not about how much you make, but how much you don't lose" - Bernard Baruch. At SteadyOptions, this has been one of our major goals in the last 12 years.

    By Kim,

    • 0 comments
    • 876 views
  • The Impact of Implied Volatility (IV) on Popular Options Trades

    You’ll often read that a given option trade is either vega positive (meaning that IV rising will help it and IV falling will hurt it) or vega negative (meaning IV falling will help and IV rising will hurt).   However, in fact many popular options spreads can be either vega positive or vega negative depending where where the stock price is relative to the spread strikes.  

    By Yowster,

    • 0 comments
    • 783 views
  • Please Follow Me Inside The Insiders

    The greatest joy in investing in options is when you are right on direction. It’s really hard to beat any return that is based on a correct options bet on the direction of a stock, which is why we spend much of our time poring over charts, historical analysis, Elliot waves, RSI and what not.

    By TrustyJules,

    • 0 comments
    • 468 views
  • Trading Earnings With Ratio Spread

    A 1x2 ratio spread with call options is created by selling one lower-strike call and buying two higher-strike calls. This strategy can be established for either a net credit or for a net debit, depending on the time to expiration, the percentage distance between the strike prices and the level of volatility.

    By TrustyJules,

    • 0 comments
    • 1,475 views
  • SteadyOptions 2023 - Year In Review

    2023 marks our 12th year as a public trading service. We closed 192 winners out of 282 trades (68.1% winning ratio). Our model portfolio produced 112.2% compounded gain on the whole account based on 10% allocation per trade. We had only one losing month and one essentially breakeven in 2023. 

    By Kim,

    • 0 comments
    • 5,888 views
  • Call And Put Backspreads Options Strategies

    A backspread is very bullish or very bearish strategy used to trade direction; ie a trader is betting that a stock will move quickly in one direction. Call Backspreads are used for trading up moves; put backspreads for down moves.

    By Chris Young,

    • 0 comments
    • 9,487 views
  • Long Put Option Strategy

    A long put option strategy is the purchase of a put option in the expectation of the underlying stock falling. It is Delta negative, Vega positive and Theta negative strategy. A long put is a single-leg, risk-defined, bearish options strategy. Buying a put option is a levered alternative to selling shares of stock short.

    By Chris Young,

    • 0 comments
    • 11,135 views
  • Long Call Option Strategy

    A long call option strategy is the purchase of a call option in the expectation of the underlying stock rising. It is Delta positive, Vega positive and Theta negative strategy. A long call is a single-leg, risk-defined, bullish options strategy. Buying a call option is a levered alternative to buying shares of stock.

    By Chris Young,

    • 0 comments
    • 11,518 views
  • What Is Delta Hedging?

    Delta hedging is an investing strategy that combines the purchase or sale of an option as well as an offsetting transaction in the underlying asset to reduce the risk of a directional move in the price of the option. When a position is delta-neutral, it will not rise or fall in value when the value of the underlying asset stays within certain bounds. 

    By Kim,

    • 0 comments
    • 9,660 views

  Report Article

We want to hear from you!


There are no comments to display.


Create an account or sign in to comment

You need to be a member in order to leave a comment

Create an account

Sign up for a new account. It's easy and free!


Register a new account

Sign in

Already have an account? Sign in here.


Sign In Now

Options Trading Blogs