SteadyOptions is an options trading forum where you can find solutions from top options traders. Join Us!

We’ve all been there… researching options strategies and unable to find the answers we’re looking for. SteadyOptions has your solution.

The Incredible Option Trade in VXX


The iPath S&P 500 VIX Short Term Futures TM ETN (NYSEARCA:VXX) is referred to as "the VXX.".  The obligation of the VXX trading strategy is to match the performance of the S&P 500 VIX Short-Term Futures Index Total Return and it maintains positions in the front two-month Volatility Index (VIX) futures contracts. 


WHAT? 
A quick step back before we thrust forward. The VIX that we see on CNBC or various websites is actually called the 'Spot VIX' and it is not a tradeable asset -- which is to say, you cannot buy or sell the VIX spot. 

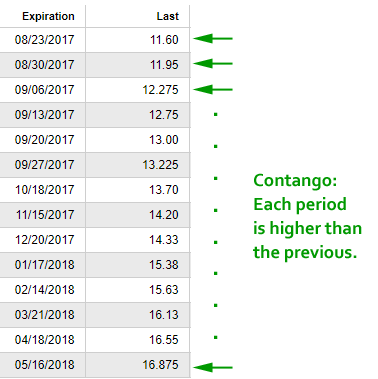
The VIX spot is derived from the implied volatility of SPX options. But the tradeable VIX is actually in the futures market. Here is how VIX futures look as of 8-22-2017, pay special attention to the price for each expiry, and how it rises with each successive date. 
 
VIXfutures_82217.PNG


We can see a futures expiration every week through 9-27-2017, and then it goes monthly. But that's not the key, here. 

Notice that for every time period further out in the future, the price of the VIX future is higher than the last. This pattern, when the future price is higher than the price behind it, is called "contango." The opposite, for those curious, is called "backwardation." 

BACK TO THE VXX OPTIONS 
Jill Malandrino, formerly of TheStreet.com writes it beautifully when she notes: 
 
Quote


This has a negative impact on VXX as the strategy VXX was created to follow will consistently sell front-month futures and buy second-month futures. 

This buying and selling of futures contracts is done to maintain a 30-day weighting between the two. Often this means that cheaper futures are being sold and more expensive futures being purchased. Eventually the second month future becomes the front month and the strategy will sell those contracts and begin purchasing the farther month. 

Often when selling commences the price of the future is lower than when it was purchased and the vast majority of the time the front month is being sold for less premium than is being paid for second month.


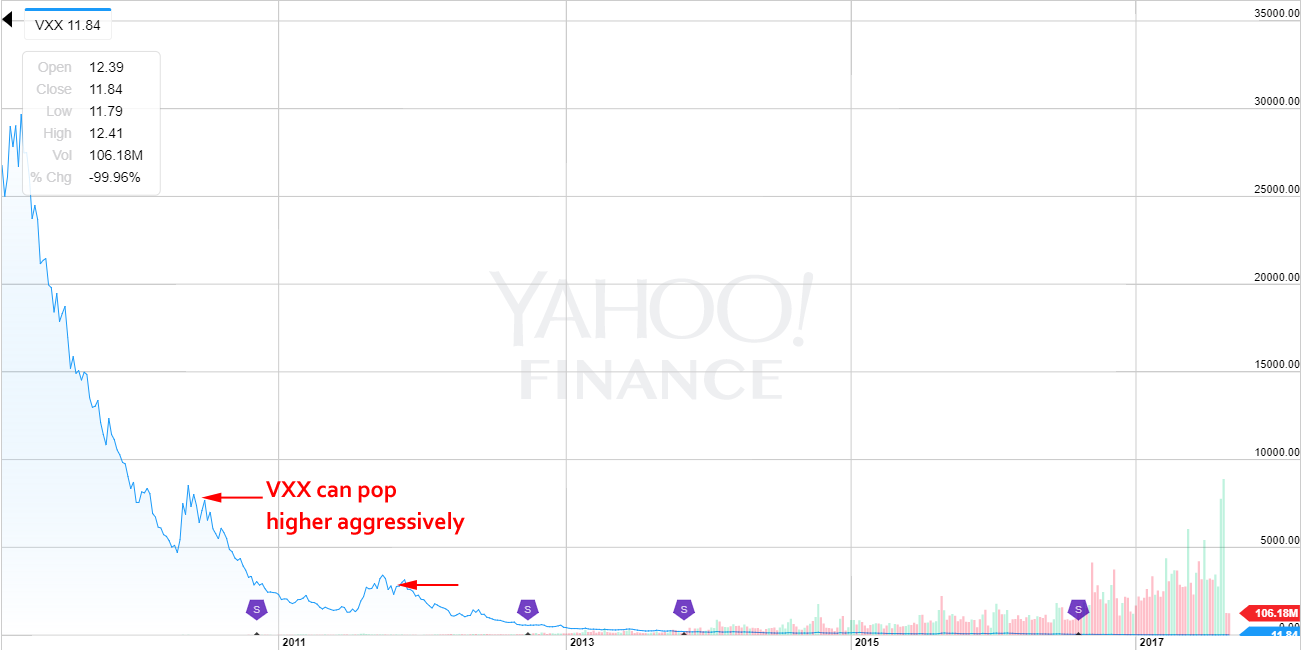
To see how often VIX futures are in contango, or more precisely, how often VXX falls, here is an all-time price chart for trading VXX options:
 
VXXcharts_817.PNG


Yep, the VXX is down 99.96% since inception. The reason is simply that VIX is almost always in contango. For the times that VIX falls out of contango, we can see abrupt pops in the VXX which we have highlighted in the image above. 

Note that the VXX does a reverse split quite often and that's why it isn't trading at $0.01. It splits into fewer shares which raises the stock price -- obviously having no affect on the actual option trade. The most recent split is 8-23-2017. 

OK - TALK TO ME ABOUT THE TRADE 
For those that want more information on the trading VXX options and VIX futures and options the CBOE is a treasure trove of information as is Jill's article 5 Misperceptions About VXX. 

With the price of VXX trending down most of the time, except for rare instances where there are large price spikes, a simple option strategy should work. 

TRADING VXX OPTIONS 
We tested buying a put option spread in the VXX using the 90 day options over the last five-years. Here are the results of this VXX options trading strategy:  

Capture.PNG


We see a 615% return, testing this over the last 5-years. Since we tested the 90 day options, that was 21 trades, in which 17 were winners and 4 were losers. 

We can see that this VXX trading strategy hasn't been a winner all the time, but it has won a lot.
 

Setting Expectations 
While this strategy has an overall return of 615%, the trade details keep us in bounds with expectations: 
       The average percent return per trade was 28.9% (in 90 days). 
       The average percent return per winning trade was 52.7% (in 90 days). 
       The average percent return per losing trade was -72.4% (in 90 days). 

We note that when the VIX goes into backwardation, the VXX does pop aggressively higher and we see that in the average loss, which is actually larger than the average win. 

Option Trading in the Last Year 
We can also look at the last year of trading in the VXX options: 


Capture.PNG


The results are staggeringly similar to the five-year results with a 80% win-rate versus the 81% win-rate over 5-years. 
       Over just the last year, the average percent return per trade was 50.3% (in 90 days). 
       The average percent return per winning trade was 63.4% (in 90 days). 
       The percent return for the one losing trade was -1.9% (in 90 days). 

The key to this trade has been risk control so the losses aren't harmful and didn't discourage trading the next cycle. 


WHAT HAPPENED 
Successful option trading is about preparation -- it's methodical -- it's scientific. This is it -- this is how people profit from the option market, and this can be done with any stock, ETF, ETN or index. 

To see how to become a scientific option trader and take the guess work out, we welcome you to watch this quick demonstration video: 

Tap Here to See the Tools at Work 


Please note that while the trade wins 80% of the time, when it loses, it can lose big time. This is why position sizing is the key.

SteadyOptions launched Creating Alpha strategy that uses a different strategy, limiting the loss significantly. This strategy still wins 80% of the time, but the loss is typically limited to ~5%. The winners are obviously much smaller as well.

The Incredible Winning Trade In SVXY article describes how this strategy performed in February 2018. The trade is now being implemented using VXX options instead of SVXY options.

What Is SteadyOptions?

12 Years CAGR of 127.5%

Full Trading Plan

Complete Portfolio Approach

Real-time trade sharing: entry, exit, and adjustments

Diversified Options Strategies

Exclusive Community Forum

Steady And Consistent Gains

High Quality Education

Risk Management, Portfolio Size

Performance based on real fills

Subscribe to SteadyOptions now and experience the full power of options trading!
Subscribe

Non-directional Options Strategies

10-15 trade Ideas Per Month

Targets 5-7% Monthly Net Return

Visit our Education Center

Recent Articles

Articles

  • Harnessing Monte Carlo Simulations for Options Trading: A Strategic Approach

    In the world of options trading, one of the greatest challenges is determining future price ranges with enough accuracy to structure profitable trades. One method traders can leverage to enhance these predictions is Monte Carlo simulations, a powerful statistical tool that allows for the projection of a stock or ETF's future price distribution based on historical data.

    By Romuald,

    • 1 comment
    • 4,589 views
  • Is There Such A Thing As Risk-Management Within Crypto Trading?

    Any trader looking to build reliable long-term wealth is best off avoiding cryptocurrency. At least, this is a message that the experts have been touting since crypto entered the trading sphere and, in many ways, they aren’t wrong. The volatile nature of cryptocurrencies alone places them very much in the red danger zone of high-risk investments.

    By Kim,

    • 0 comments
    • 1,371 views
  • Is There A ‘Free Lunch’ In Options?

    In olden times, alchemists would search for the philosopher’s stone, the material that would turn other materials into gold. Option traders likewise sometimes overtly, sometimes secretly hope to find that most elusive of all option positions: the risk free trade with guaranteed positive outcome:

    By TrustyJules,

    • 1 comment
    • 17,391 views
  • What Are Covered Calls And How Do They Work?

    A covered call is an options trading strategy where an investor holds a long position in an asset (most usually an equity) and sells call options on that same asset. This strategy can generate additional income from the premium received for selling the call options.

    By Kim,

    • 0 comments
    • 2,847 views
  • SPX Options vs. SPY Options: Which Should I Trade?

    Trading options on the S&P 500 is a popular way to make money on the index. There are several ways traders use this index, but two of the most popular are to trade options on SPX or SPY. One key difference between the two is that SPX options are based on the index, while SPY options are based on an exchange-traded fund (ETF) that tracks the index.

    By Mark Wolfinger,

    • 0 comments
    • 6,894 views
  • Yes, We Are Playing Not to Lose!

    There are many trading quotes from different traders/investors, but this one is one of my favorites: “In trading/investing it's not about how much you make, but how much you don't lose" - Bernard Baruch. At SteadyOptions, this has been one of our major goals in the last 12 years.

    By Kim,

    • 0 comments
    • 4,190 views
  • The Impact of Implied Volatility (IV) on Popular Options Trades

    You’ll often read that a given option trade is either vega positive (meaning that IV rising will help it and IV falling will hurt it) or vega negative (meaning IV falling will help and IV rising will hurt).   However, in fact many popular options spreads can be either vega positive or vega negative depending where where the stock price is relative to the spread strikes.  

    By Yowster,

    • 0 comments
    • 6,540 views
  • Please Follow Me Inside The Insiders

    The greatest joy in investing in options is when you are right on direction. It’s really hard to beat any return that is based on a correct options bet on the direction of a stock, which is why we spend much of our time poring over charts, historical analysis, Elliot waves, RSI and what not.

    By TrustyJules,

    • 0 comments
    • 3,802 views
  • Trading Earnings With Ratio Spread

    A 1x2 ratio spread with call options is created by selling one lower-strike call and buying two higher-strike calls. This strategy can be established for either a net credit or for a net debit, depending on the time to expiration, the percentage distance between the strike prices and the level of volatility.

    By TrustyJules,

    • 0 comments
    • 4,921 views
  • SteadyOptions 2023 - Year In Review

    2023 marks our 12th year as a public trading service. We closed 192 winners out of 282 trades (68.1% winning ratio). Our model portfolio produced 112.2% compounded gain on the whole account based on 10% allocation per trade. We had only one losing month and one essentially breakeven in 2023. 

    By Kim,

    • 0 comments
    • 9,440 views

  Report Article

We want to hear from you!


In the backtest example I can't understand results.. It looks like 1 year (last) was 5 winning streak of 1280$ each, excluding commissions. 

But that is strange, as this put spread looks like a 7 point-spread, so you can't gain as much on 1 contract strategy..... So what am I missing here? 

Share this comment


Link to comment
Share on other sites

@Kim
I see, but I cannot understand the entry dates either, as I can suppose that changing the entry dates sequence on the same 90 days bull put 50/30 delta, it change entirely the result, right ?
wk 1, 2 , 3 or 4.. ?

Share this comment


Link to comment
Share on other sites

I'm thinking you would have blown out, or lost 100% of the trade had you put on 3 month long put spread in Jan 2018.  We can see the price of the underlying doubled between Jan and Feb.  All it would take is probably a 20% move in VXX to lose 100% of your money in the long spread. It's okay because you will have black swan events and the steamroller will eventually come from trying to take on a leveraged trade every month.  It is still a better strategy than buying calls on SVXY, which would have ended in disaster.  You would still be okay in the long run as you'd still be up a lot from the last 5 years of Fed induced stimulus, suppressing vol for the longest.  Still, you can tweak this strategy using statistics and timing market tops by buying a protective put on SPY during periods which you think vol on the SPX will rip higher (and hence market will tank).  Timing tops is a whole other discussion and I have my own proprietary model, but I'd have to charge to tell people how to spot intra-year tops. You can look at the VIX curve to see when it is flattening and appearing like it will head toward backwardation.  That is the yellow light that the market is topping and may be headed for a fall. During those times you can just close our your trade so as not to be exposed, and wait for the market to drop, and then short VOL subsequent, or you can stay in the trade and hedge with a protective put on the indexes or protective collars on your short VIX position. 

Share this comment


Link to comment
Share on other sites

As mentioned in the article:

"The average percent return per losing trade was -72.4% (in 90 days)."

So yes, the trade makes money 80% of the time, but when it loses, the losses are significant. This is why position sizing is the key as usual.

It is not really related to the Fed policy, it is just a result of the VIX contango, and as a result, VXX price drifting lower. Can it be timed? Possibly, but you would also miss some gains. I would be very comfortable to maintain constant exposure to a vehicle that goes down 80% of the time, without the need to time it.

Share this comment


Link to comment
Share on other sites
Guest James

Posted

What is the settlement process in VXX? Is it the same as VIX?

Share this comment


Link to comment
Share on other sites

James,

Unlike VIX options, VXX options are NOT cash settled. If you let an in-the-money call expire they will be automatically exercised by your broker. Also if they become deep ITM close to expiration, you might be assigned any time. It is probably better to close them prior to expiration.

Share this comment


Link to comment
Share on other sites

Have you tried a bear call spread in VXX instead of a bear put spread? If so, what would be your reasoning for choosing the bear put spread over the bear call spread?

I was thinking that having theta on your side would be helpful if vxx does not move enough, which in this case is found in the bear call spread and not the bear put spread. I know both spreads will lose if volatility spikes but from what I know, it seems that the bear call spread would also be favorable in a high IV environment.

Share this comment


Link to comment
Share on other sites

It seems that the back test results are no longer available. I was wondering when are the options put on during the year, at the beginning of each quarter? Given the availability of weekly options, would opening a new position each week generate a higher annualized return? 

Share this comment


Link to comment
Share on other sites


Create an account or sign in to comment

You need to be a member in order to leave a comment

Create an account

Sign up for a new account. It's easy and free!


Register a new account

Sign in

Already have an account? Sign in here.


Sign In Now

Options Trading Blogs