
tastytrade tried to Put The Nail In The Coffin On Buying Premium Prior To Earnings. They did it several times, and we debunked their studies several times.
Kirk Du Plessis from OptionAlpha conducted a comprehensive study backtesting different earnings strategies. This is the part that is relevant to our pre earnings straddle strategy:
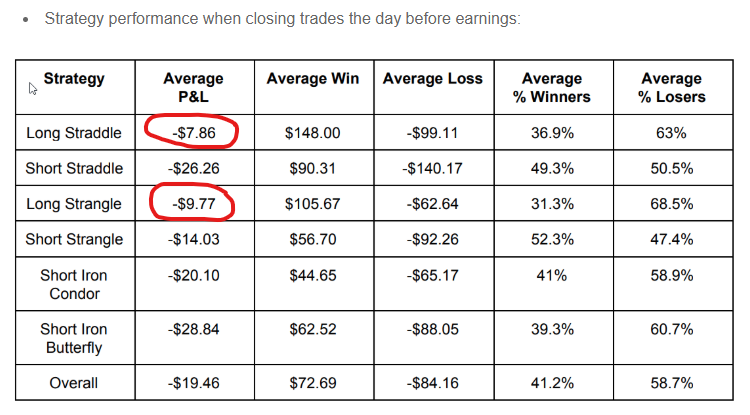
The conclusion is that buying long straddle (or strangle) and closing the day before earnings is a losing proposition. The backtest included different entry days from earnings: 30, 20, 10, 5, or 1 day from the earnings event.
Our real life trading results are very different:
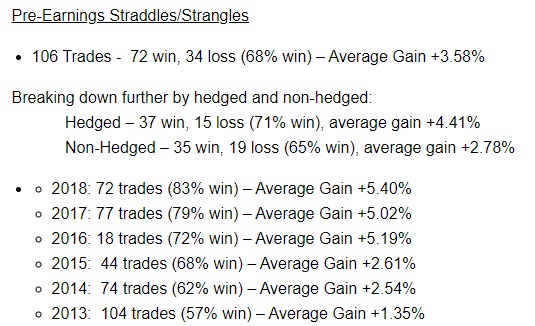
You can see full statistics here.
The question many people ask us: are all those studies wrong? How their results are so different from our real life trading performance?
The answer is that the studies are not necessarily wrong. They just have serous limitations, such as:
-
The studies use the whole universe of stocks, while we use only a handful of carefully selected stocks that show good results in backtesting.
-
The studies use certain randomly selected entry dates, while we enter only when appropriate.
-
The studies use EOD (End Of Day) prices while we take advantage of intraday price fluctuations.
- The studies exit a day before earnings while we manage the trades actively by taking profits when our profit targets are hit.
This makes a world of difference.
If you are not a member yet, you can join our forum discussions for answers to all your options questions.
Here is a classic example how real trading is different from "studies".
On March 2 2:30pm we entered CPB straddle:
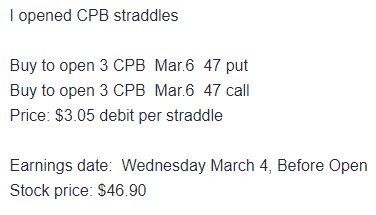
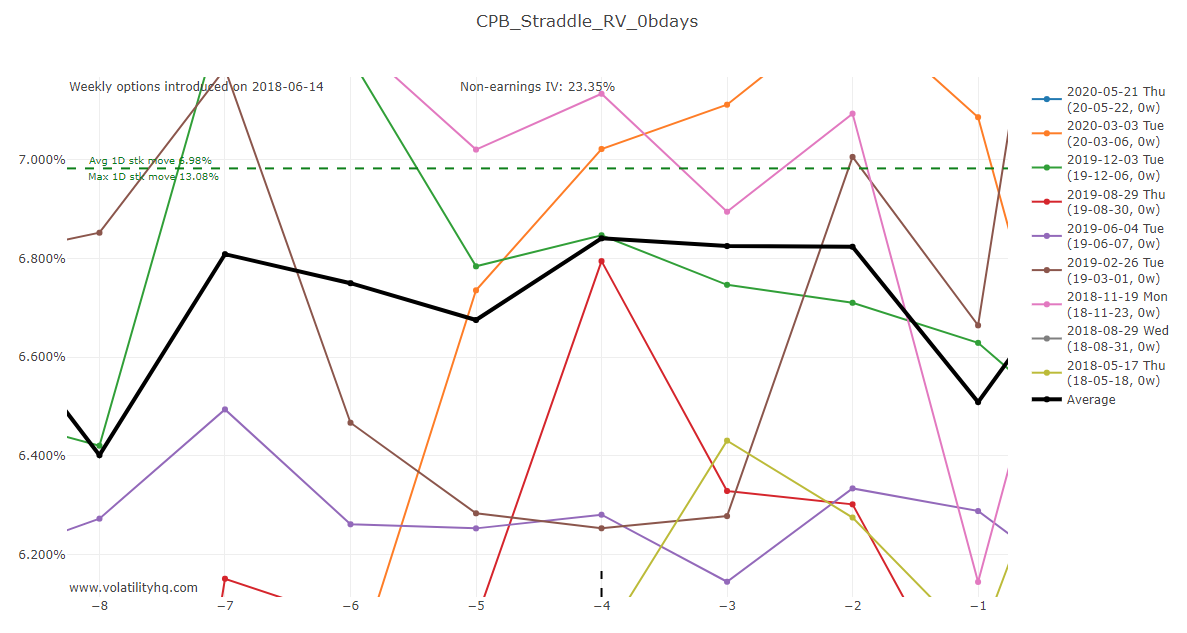
The price was 3.05 or 6.5% RV. When considering a trade, we look at the straddle price as percentage of the stock price. We call it RV (Relative Value). We based our entry on the CPB RV chart:
We exited the trade on March 3 10:05am for $3.45 credit, 13.1% gain
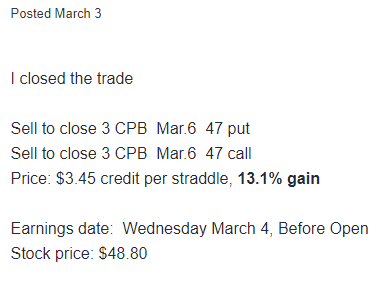
EOD price on March 2 was 3.40 and EOD price on March 3 was 2.95. The study using EOD prices would show 13.2% LOSS while our real trade was closed for 13.1% GAIN.
Two points that contributed to the difference:
-
We have a very strict criteria for entering those trades. In some cases we might wait weeks for the price to come down and meet our criteria. Based on historical RV charts, we would not even be entering this trade at 3.40.
- On the last day, we did not wait till the EOD and closed the trade in the morning when it reached our profit target.
This is just one example how a "study" can show dramatically different results from real trading.
On a related note, using a dollar P/L in a study is meaningless - this alone disqualifies the whole study. The only thing that matter is percentage amount. Why? Because in order to get objective results, you need to apply the same dollar allocation to all trades.
For example, lets take a look on stocks like AMZN and GM. AMZN straddle can cost around $200 and GM straddle around $2. If AMZN straddle average return was -10% or -$20 and GM average return was +50% or $1, the average return should be reported as +20%. In the study, it would be reported as -$9.5.
Don't believe everything you read. Use your common sense and take everything with a grain of salt.
I have a great respect for Kirk. He is one of the most honest, professional and hardworking people in our industry, but even the greatest minds sometimes get it wrong.
Related articles:


There are no comments to display.
Join the conversation
You can post now and register later. If you have an account, sign in now to post with your account.
Note: Your post will require moderator approval before it will be visible.