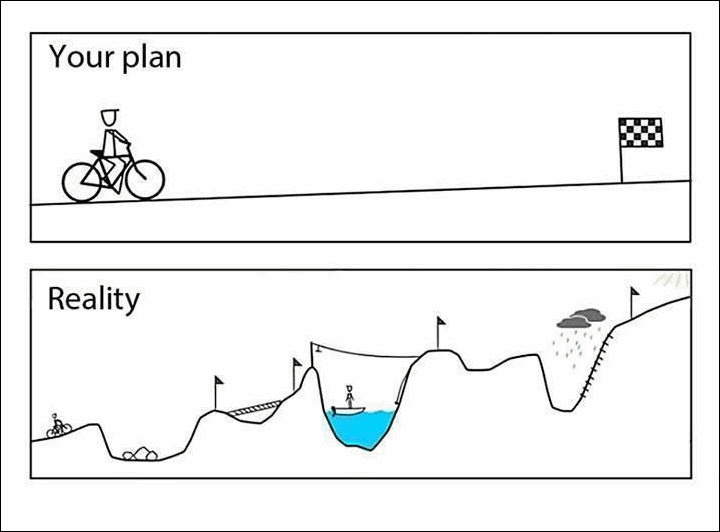
"A lot of folks just look at the return side of the equation," says Wasif Latif, vice president of equity investments for USAA Investments in San Antonio. "But how smooth was your ride to get to that return?" The Sharpe ratio puts those two pieces together.
When building a portfolio, the objective is to merge your plan with reality. We want all the return with none of the risk, and it's why a fraud like Bernie Madoff fooled investors for decades. We desperately want to believe in fairy tales, often self-sabotaging our own returns by pursuing unproven complexity over proven simplicity. It's the triumph of hope over experience.

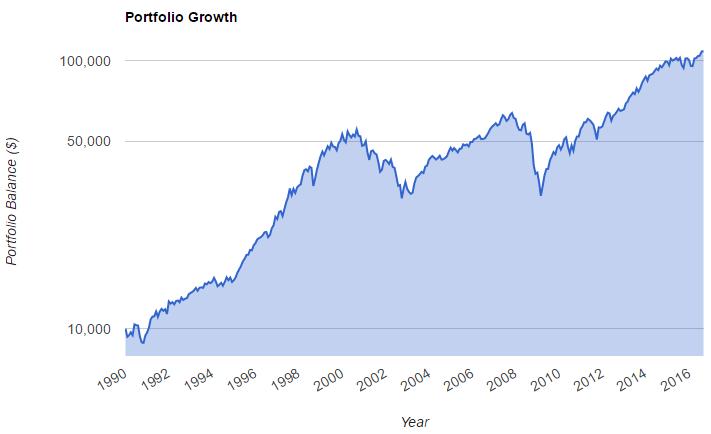
For perspective, a Sharpe Ratio of 1 over a long period of time (decades) is extremely rare for any investment or investment portfolio. Just go out and try to find them. Be skeptical of anyone suggesting they can achieve, or have achieved, extraordinarily high Sharpe Ratio's. Here's an example of the Sharpe Ratio of the S&P 500 since 1990:
Annualized Return: 9.36%
Risk Free Rate (T-bills): 2.87%
Annualized Volatility: 14.61%
Sharpe Ratio: 0.44
And here's a picture of that reality, from www.portfoliovisualizer.com.

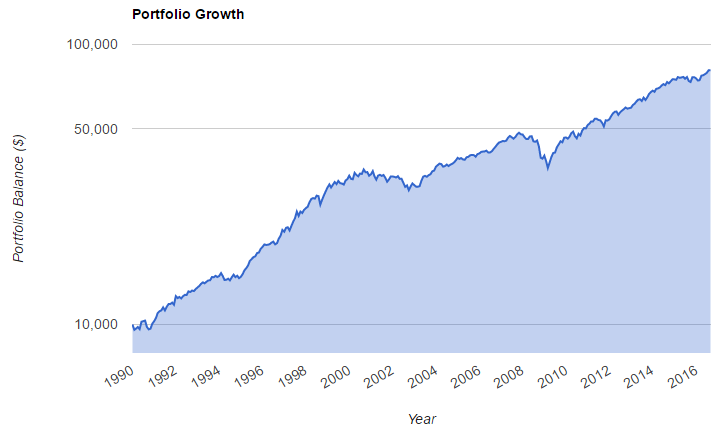
One simple way to increase your portfolio's Sharpe Ratio is with diversification. For example, moving half of a portfolio into a bond index fund, and rebalancing annually, has done a nice job of improving your Sharpe Ratio from 0.44 to 0.70 since 1990. Note how much smoother the portfolio growth would have been. Investors would be well served if the finance industry would start showing people a track record instead of simply providing numbers. Just giving investors a bunch of numbers doesn't help them understand the good, the bad, and the ugly of long term investing.

At this point, sophisticated investors could get creative and utilize concepts such as synthetic longs with option combos and momentum filters to further maximize risk-adjusted returns, but those are topics for another post and a point to discuss with a competent investment advisor. The point here is to help you think beyond returns to risk-adjusted returns the next time you review your portfolio or a potential investment. The Sharpe Ratio is one proven way to measure how much pain you've historically had to endure in order to achieve a certain gain. Sharpe ratios work best when figured over a period of at least three years, advisers say.
Taking our Steady Condors strategy, you might ask yourself: is 17% CAGR (Compounded Annual Growth Rate) a good return? Well, the answer is - it depends. When this return is achieved with only 15% annual volatility - then yes, it's an excellent return. In fact, it is much better than 25% CAGR with 40% annual volatility.
Our Performance Page presents Sharpe Ratios for all three our services. We encourage you to check it and compare our Sharpe Ratios to other services (assuming you can even find this info at other services).
Related Articles:
Are You EMOTIONALLY Ready To Lose?
Why Retail Investors Lose Money In The Stock Market
Are You Ready For The Learning Curve?
Can you double your account every six months?
If you are ready to start your journey AND make a long term commitment to be a student of the markets:


There are no comments to display.
Join the conversation
You can post now and register later. If you have an account, sign in now to post with your account.
Note: Your post will require moderator approval before it will be visible.