
Still, it takes a much smaller price move for reverse iron condors to profit than straddles or strangles.
Elements of the Reverse Iron Condor
Market-Neutral Strategy
The reverse iron condor is a vega positive strategy and aims to profit from increases in volatility. The spread profits from hefty price moves in underlying, regardless of direction. Buyers of reverse iron condors don't care if the market goes up or down as long as it makes a large enough move in either direction to show a profit.
Long Premium
Conversely to the iron condor spread, the reverse iron condor is net long options, meaning traders must pay a net debit to enter the position.
Defined Risk
The reverse iron condor is a defined-risk strategy with a predefined maximum loss.
Negative Theta
Because the reverse iron condor spread is net-long options, it suffers from theta decay. The spread will lose a little bit of money every day as it gets closer to expiration.
Reverse Iron Condor Structure: Spread Legs
The reverse iron condor is composed of the following options, all with the same expiration date:
- BUY: 1 out-of-the-money (OTM) put option
- SELL: 1 out-of-the-money (OTM) put option (lower strike)
- BUY: 1 out-of-the-money (OTM) call option
- SELL: 1 out-of-the-money (OTM) call option (higher strike)
Here is a visual representation of the reverse iron condor:
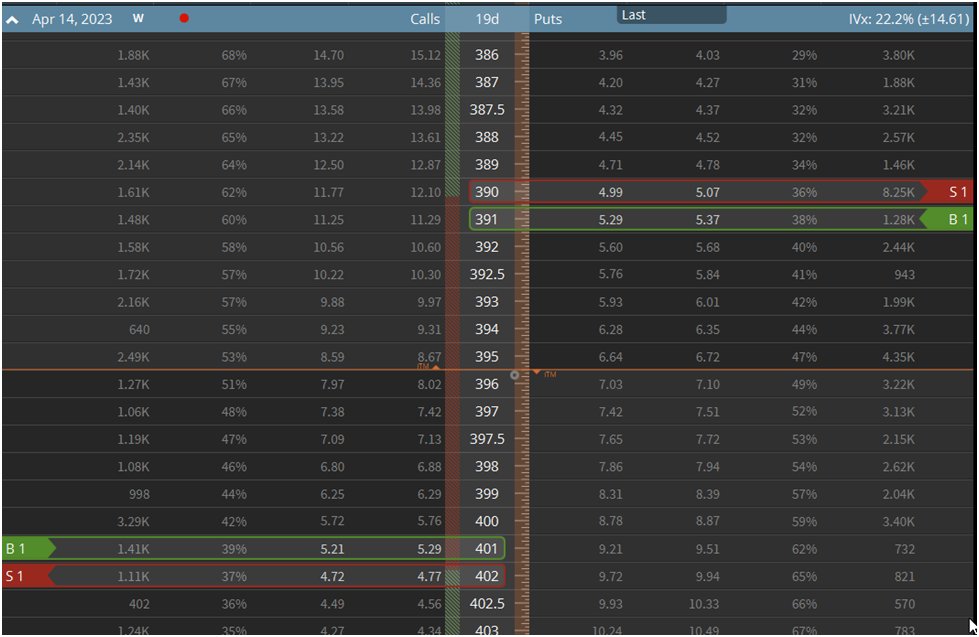
A reverse iron condor consists of buying an out-of-the-money bull call debit spread above the stock price and an out-of-the-money bear put debit spread below the stock price with the same expiration date.
Reverse Iron Condor: P&L Potential and Payoff Diagram
Now let's calculate various payoff scenarios for the reverse iron condor. While most modern options trading platforms do this for you, you must intuitively understand the trades you're making.
Often, these platforms can be a crutch for novice traders who don't truly understand the nature of the trades they're making. Simply running through the math in your head allows you to contextualize your trades beyond simply looking at max profit and loss figures.
Reverse Iron Condor Breakeven Points
The upper breakeven price of a reverse iron condor equals the long call strike plus the net premium paid. In contrast, the lower breakeven price equals the long put strike price minus the net premium paid.
Let’s translate that to English and use a diagram to make things easier. Going back to our visual graphic of the reverse iron condor from before:
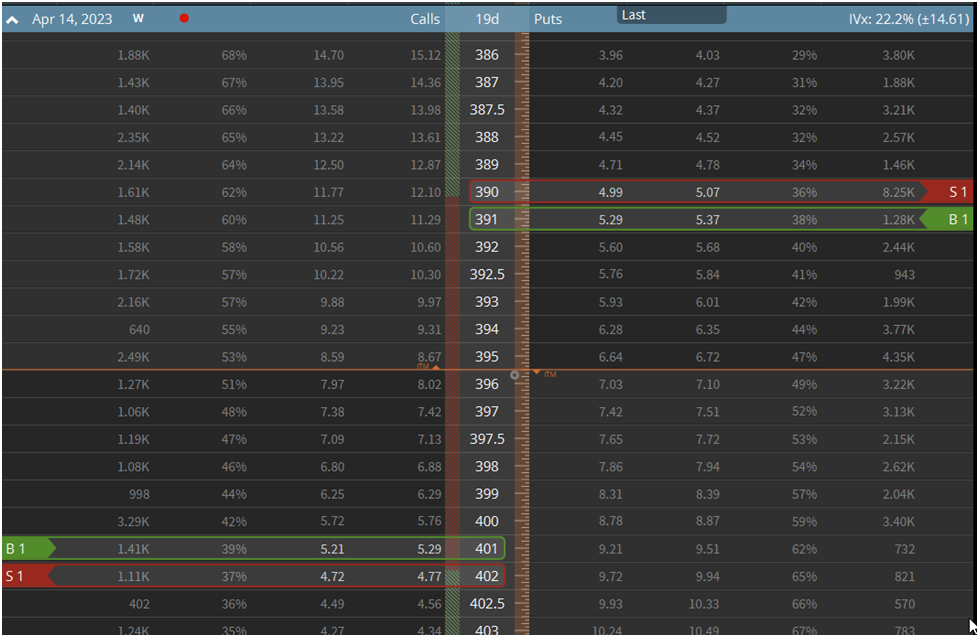
In this example, the long call is $401, and the long put is $390. So the only other piece of information we need to calculate our breakeven prices is our net premium paid. For this trade, that is $0.81.
Now the calculation is as simple as:
- Upper strike break-even price: $401 + $0.81 = $401.81
-
Lower strike breakeven price: $390 - $0.81 = $389.19
Reverse Iron Condor Maximum Loss
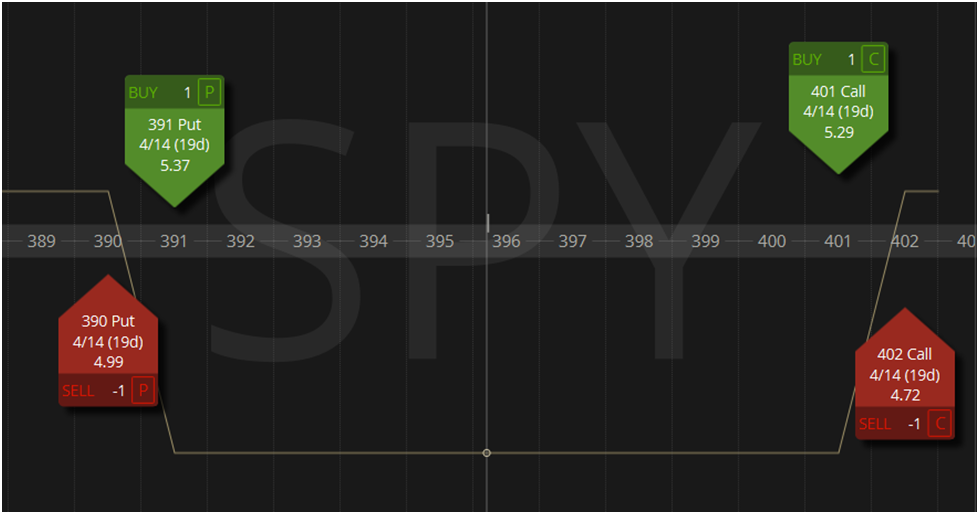
Calculating your maximum loss for a reverse iron condor trade is the net premium you pay to enter the position. In the case of our example, that is $0.81, making our max loss $0.81.
The max loss in a reverse iron condor trade is reached when the underlying trades between the two middle strikes. Here's a diagram to visualize it:
Reverse Iron Condor Maximum Profit
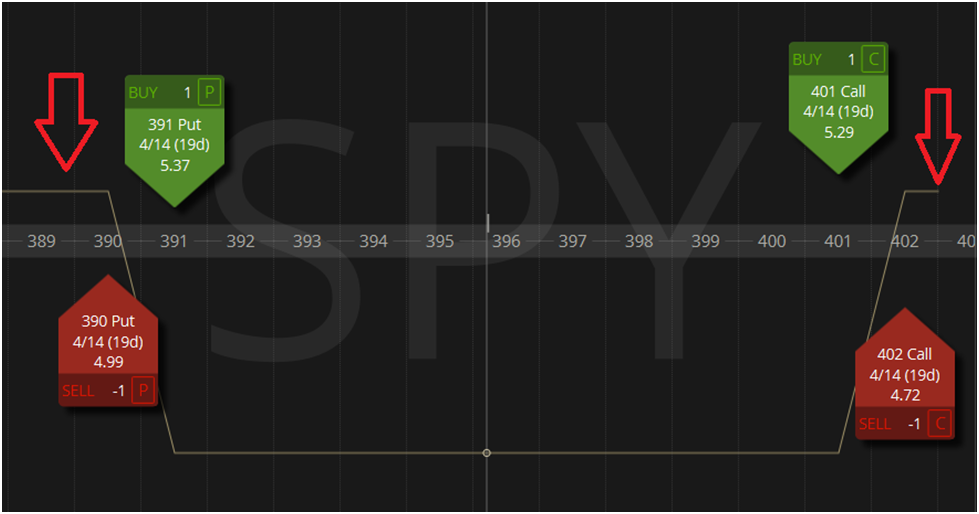
The maximum profit of a reverse iron condor spread is achieved when the underlying is above the short call strike or below the short put strike at expiration. Going back to our graphic, I've marked the max profit levels with arrows:
Reverse Iron Condor Payoff Diagram
An options spread's payoff diagram is one of the most important things to understand about a spread. There's so much noise in the options world about one spread being better than the other, that it's easy to lose sight that your market view should dictate your spread choice, not ideology or dogma.
When you have a fleshed-out market view, it's easy to look at a payoff diagram and decide if it accurately summarizes that view.
Keep that in mind when looking at this payoff profile of a reverse iron condor:
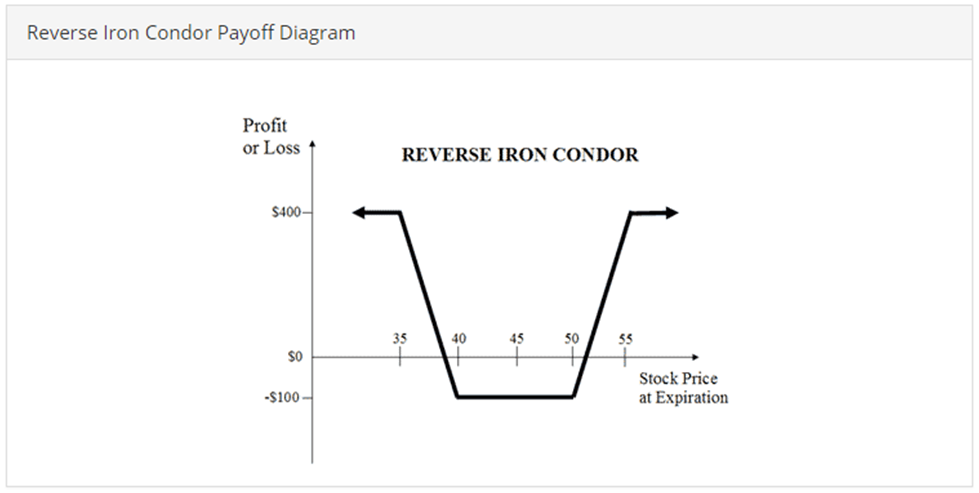
You can manipulate a reverse iron condor by the distance between the puts and calls, widening the distance between the short and long strikes, and moving the spread around the options chain.
But it'll still look like some version of the above. There's a defined range in which you lose your entire premium. You make the maximum profit if the underlying expires anywhere outside of that range.
Matching Options Trade Structure With Your Market View
One thing we're trying to nail home in this reverse iron condor primer is the importance of matching your market view to the correct options spread. As an options trader, you're a carpenter, and option spreads are your tools. If you need to tighten a screw, you won't use a hammer but a screwdriver.
So before you add a new spread to your toolbox, it's crucial to understand the market view it expresses. One of the worst things you can do as an options trader is structure a trade that is out of harmony with your market outlook.
This mismatch is often on display with novice traders. Perhaps a meme stock like GameStop went from $10 to $400 in a few weeks. You're confident the price will revert to some historical mean, and you want to use options to express this view. Novice traders frequently only have outright puts and calls in their toolbox. Hence, they will use the proverbial hammer to tighten a screw in this situation.
In this hypothetical, a more experienced options trader might use a bear call spread, as it expresses a bearish directional view while also providing short-volatility exposure. But this trader can be infinitely creative with his trade structuring because he understands how to use options to express his market view appropriately.
The nuances of his view might drive him to add skew to the spread, turn it into a ratio spread, and so on.
What Market Outlook Does a Reverse Iron Condor Express?
A trader using a reverse iron condor expects an increase in implied volatility and has a neutral directional view while maintaining a defined maximum risk.
So the trader is bullish on volatility but not bullish enough to buy a long straddle. This becomes useful when a trader expects a modest increase in volatility and it doesn't make sense for the unlimited upside provided by a straddle.
For instance, this spread might come in handy for volatility mean reversion trading. Perhaps a stock's implied volatility is at the very low-end of its historical range. A volatility trader who buys volatility in this situation isn't expecting the stock to skyrocket. Instead, he expects volatility to increase modestly and revert to its historical mean.
When To Use a Reverse Iron Condor
Binary Event Trading
Events like FDA drug approval decisions, Federal Reserve meetings, or significant court rulings are highly binary, unlike earnings that allow for more open-ended interpretation of results.
The FDA either approves a drug or it doesn't. Depending on the outcome, a stock could crater or skyrocket. But the looming possibility is the ultimate decision was largely priced-in, and the stock barely moves. This is a nightmare for a trader who owns a straddle, which is highly likely to be significantly underwater due to the high implied volatility he paid for it.
The same goes for Fed meetings and court decisions.
Volatility Mean Reversion
The "standard" volatility model in the quantitative finance world is the GARCH (Generalized Autoregressive Conditional Heteroskedasticity) model. One of the core tenets of the model is that volatility is mean-reverting. It's generally accepted in the volatility trading world that volatility tends to revert to its historical mean following short-term spikes.
As a result, many volatility traders focus on selling volatility when its historically expensive and buying it when volatility is below its mean.
A volatility trader making a mean reversion trade often doesn't expect a massive spike in volatility but rather a modest increase in line with its historical mean. For this reason, trade structures like straddles and strangles often don't make sense. Some volatility traders aren't looking for convexity but are just trading volatility back in line with its mean.
While there are a lot of big words in there, the concept is almost the same as a trader buying a stock when it has a very low RSI (relative strength index) reading, as it indicates the current price is relatively low compared to history.
Earnings Volatility Trading
In a similar sense to volatility mean reversion trading, sometimes you might think that the options market underestimates a stock's post-earnings move. Perhaps the stock's post-earnings realized volatility has outpaced implied volatility for several consecutive quarters, or maybe you think the market is missing an element of change within the company that will be explained in the earnings report.
Whatever that may be, sometimes a straddle or strangle doesn't fit your view of how implied volatility will evolve over the life of the trade. Perhaps you expect a modest increase in volatility, or perhaps you're trading a high-flying stock with very expensive options, and you'd prefer to make your bet more cheaply.
Risk Aversion
Most options traders cut their teeth selling volatility and have had the idea that "implied volatility is often overstated" drilled into their head. Some traders like to make bets on volatility but can't stomach paying out the heft premiums associated with buying a straddle. The risk aversion associated with buying options alone is one reason some traders will turn to reverse iron condors.
Reverse Iron Condor Trade Example
For instance, let's go back in time to 2016 when Google (GOOG) reported its Q1 2016 earnings. The options market was pricing in a $41 or 5.3% move following the earnings release.
You had a few options if you wanted to take the "over" on the market's implied volatility estimate. Let's compare the straddle, the standard-bearer for earnings-related volatility trades, and the reverse iron condor.
Google (GOOG) At-The-Money (Weekly) Straddle:
- Buy 1 760 Put
- Buy 1 760 Call
- Trade Cost: $41 debit
In this case, a trader who was long the straddle needed Google to move $41 just to break even on the trade. However, he would also have unlimited profit potential if the stock moved significantly. A slightly less-than-expected earnings move would've shown a small loss.
Now let's look at the equivalent reverse iron condor:
Google (GOOG) (Weekly) Reverse Iron Condor:
- Buy 1 745 Put
- Sell 1 750 Put
- Buy 1 775 Call
- Sell 1 780 Call
- Trade Cost: $1.75 net debit
The reverse iron condor only required a $20 move to break even (above $780 or below $740) to make money.
Following the report, Google (GOOG) stock moved $40 and closed at $719. So even though Google's earnings move was in line with market expectations, this reverse iron condor still made a 43% gain because Google closed at $719, below the 740 short put strike.
The Risks of Reverse Iron Condors
The biggest drawback of the reverse iron condor is that when you’re long volatility, the underlying stock needs to move more than your “hurdle rate,” which is the net debit you pay for the options spread.
This drawback is especially evident when it comes to earnings volatility trades. Implied volatility will significantly decline if the stock doesn't move enough after an earnings release. This phenomenon is called IV Crush. It refers to the tendency for implied volatility to decrease significantly when an earnings release concludes.
How Options Gurus Mislead Traders About Iron Condors
So, losing all of your premium is entirely possible when trading these, despite what options trading gurus might claim. Unfortunately, many gurus present both iron condors and reverse iron condors as nearly risk-free strategies, completely ignoring the genuine risks.
For instance, a Seeking Alpha contributor suggested the following trade in a past Google earnings release when Google was trading at $632:
- Buy twenty (20) April Week 2 $610.00 put options
- Sell twenty (20) April Week 2 $600.00 put options
- Buy twenty (20) April Week 2 $650.00 call options
- Sell twenty (20) April Week 2 $660.00 call options
Rationale behind the trade:
"Google is a notorious big-mover after reporting. I am completely confident that the trade recommendation I am writing about will work like a charm."
This writer failed to recognize the risks of options trading. Following the Google earnings release he was betting on, Google closed at $624, and the trade lost 100%. As our contributor Chris (cwelsh) mentioned in the comments section:
"Earnings are wild and unpredictable. A careful analysis and you can improve your odds, but you always have to factor in position sizing and potential loss into any trade. My entire point of my posts was that I think a discussion of risks should always be included in any article that discusses huge potential gains."
Here's another example of gurus failing to educate readers on the genuine risks associated with reverse iron condors:
"The Debit Iron Condor is used primarily on stocks that have a long history of big moves when announcing their quarterly earnings. We have a very good idea of how big the move will be, in one direction or the other. And the amazing thing about studying history is that history truly repeats itself, and that means a big percentage of wins. The magic works when the Debit Iron Condor is combined with big moves from stocks on earnings day."
Yet again, this shows a fundamental misunderstanding of trading. While it's true that reverse iron condors often have a very high probability of success, the losing trades tend to be multiples of your average winning trade. So it's not a foolproof strategy. The balancing act between win rate and risk/reward requires the same amount of attention as it does when you're trading an ordinary stock trading strategy.
Reducing the Risk of Implied Volatility Crush in Earnings Trades
One way to reduce the risk of reverse iron condors when making earnings trades is to focus on more distant expirations. While much of the literature on trading earnings with reverse iron condors focuses on weekly options, those are the options that IV Crush punishes the most.
Options trading is very much about tradeoffs with respect to time. When you're a net-buyer of options, you'd prefer to have as much time for the market to work in your favor as possible. However, additional time to expiration can come at a steep cost. On the other hand, expirations in the range of 20-40 days won't feel the brunt of IV Crush as much as weekly options.
Hedged Reverse Iron Condor
One way to reduce the risk of Reverse Iron Condor is to hedge it. This would involve adding a calendar spread in the middle of the long and short strikes, basically hedging the "weak spot" of the Reverse Iron Condor. This is how the trade looked like:
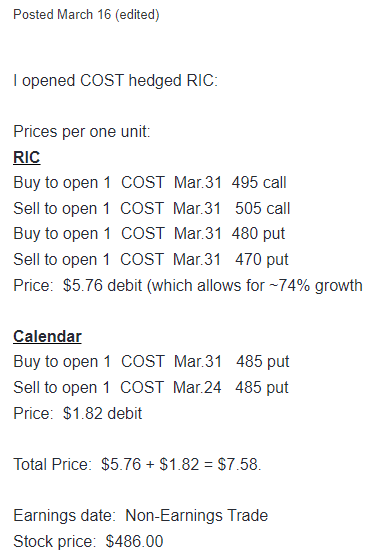
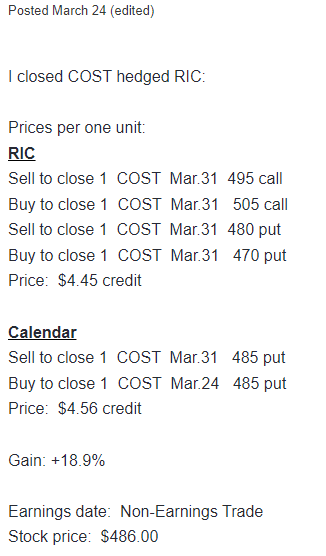
The trade was opened on March 16 and closed 8 days later for 18.9% gain. The stock price basically remained unchanged, Reverse iron Condor alone would lose 23%, but calendar gains far exceeded the RIC losses.
Bottom Line
The reverse iron condor options spread is an excellent choice for situations where you expect the stock to make a significant price move but you don't want to make a directional price bet. Because the maximum profit and loss of the spread are predictable, it makes it far easier to adjust strikes based on your market expectations.
This options spread can be successfully used for trading stocks with a history of significant earnings moves that the options market tends to underestimate. The trick is identifying these stocks in real-time rather than after the fact when everyone has caught on.
Subscribe to SteadyOptions now and experience the full power of options trading at your fingertips. Click the button below to get started!
Join SteadyOptions Now!


Join the conversation
You can post now and register later. If you have an account, sign in now to post with your account.
Note: Your post will require moderator approval before it will be visible.