
At IVolatility, we’ve committed to bridging this gap. We’ve committed to building powerful and easy-to-use tools at prices that average investors can afford. So clearly, when SteadyOptions decided our tools were a good fit for your community, we were excited. Since, we’ve partnered with the SteadyOptions team to bring these tools, at no additional cost, to SteadyOptions subscribers. This article is the first in a four-part series on how you can use IVolatility tools to better your bottom line and make the murky pools of options trading just a bit clearer.
Greeks
IVolatility tools work on a simple principle: that options prices are influenced by measurable, predictable, and publicly available variables; and using these variables, we’re able to build a deep understanding of what contracts are over or undervalued, which way underlyings will trend, and where an option will finish. But before we can get into the software itself, we need to understand the metrics used to measure the factors that influence options prices: the Options Greeks.
Delta
Options Delta is an estimate of the theoretical change in the price of an option for a small change in the price of the underlying stock, ETF or futures contract expressed as a percentage of the underlying. Delta estimates how much the value of an option is likely to change for a one-point change of the underlying with values ranging from zero to 1. For call options delta is positive so when the price of the underlying advances the option will gain value.
Alternatively put options have negative delta and decline in value as the underlying advances. Options closest to the current price, called at-the-money ATM, have deltas close to .50, +.50 for calls and -.50 for puts. Out-of-the money OTM calls, those with strike prices higher than the price of the underlying have deltas less than .50 and in-the-money ITM calls, those with strike prices below the current underlying, have deltas greater than .50. Out-of-the-money puts, those with strikes below the price of the underlying have deltas less than .50 while in-the-money puts, those with strike prices above the price of the underlying, have deltas greater than .50.
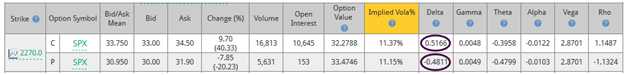
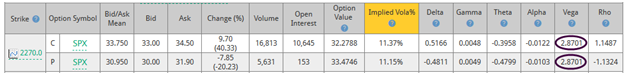
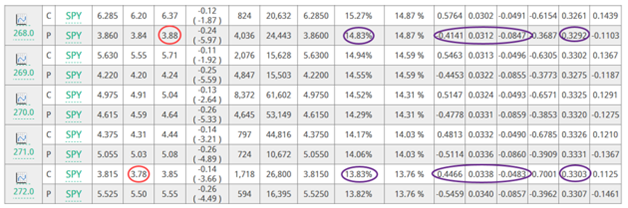
Option strategies, from a single call or put to complex positions with multiple combinations will always have some degree of delta. Since a single option represents 100 shares of the underlying, an at-the-money call represents the equitant of 50 shares (100 x .50 = 50). A long call spread, long one call and short another will have some positive delta depending upon the strike prices selected. Alternatively, short call spreads will have negative delta. For the 2270 at-the-money the call, the delta is .5166 while the put is -.4811.
Gamma
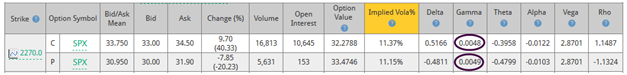
Options Gamma is the estimate of how rapidly delta changes as the price of the underlying changes since it measures the rate of change of delta for a small change of the price of the underlying. Often referred to as curvature it measures the degree of responsiveness to price changes, with at-the-money options, both calls and puts being the most responsive to changes in the price of the underlying. Both have positive values for long options (negative values for short options) that reach their maximums at-the-money and decline for both ITM and OTM options. Here the call gamma is .0048, while the put is .0049.
Theta
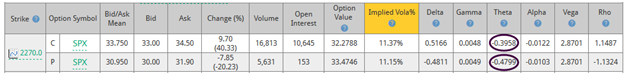
The next column, called theta is the rate of declining option value each day, referred to as the rate of time decay until the option expires. Out -of -the money options without intrinsic value, or the difference between the current price of the underlying and the strike price, have higher theta than ITM money options with intrinsic value. As expiration approaches, the rate of time decay or theta increases noticeably from about 21 days before expiration. Accordingly, weekly options with high theta are favorites for those selling options that expire at the end of the week. Because theta for both calls and put are negative, one way to mitigate time decay is to sell other options against long options such as vertical spreads, ratio spread or Butterfly spreads. Here the call Theta is -.3958 while the put is -.4799.
Alpha
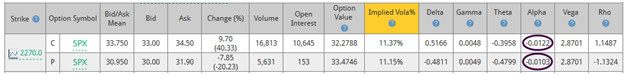
Alpha is the ratio of Gamma over theta, or the amount of Gamma for a given amount of time decay. Distinguished here from the more common use of Alpha that measures the additional return of a portfolio from its benchmark like the S&P 500 Index, option Alpha attempts to maximize the amount of Gamma for a given amount of time decay. The call Alpha is -.0122 and the put is -.0103
Vega
Although not a Greek letter, Vega represents the theoretical rate of change an options price for a 1% change in implied volatility. Since higher priced stocks and ETFs have higher priced options, the amount an option price will change as implied volatility changes will also be higher.
In addition, at-the-money options will have higher Vega than both in-the-money and out-of the money options, In dollar terms in-the-money and out-of the money options will be less sensitive to changes in implied volatility. In addition, options with more time to expiration will have higher Vega since with more time there is a greater probability for the price of the underlying to change. The call Vega is 2.8701 while the put is also 2.8701.
Because Vega values for both calls and puts are positive one way to mitigate changes in implied volatility is to sell other options against long options such as vertical spreads, ratio spread or Butterfly spreads similar to offsetting time decay.
Rho
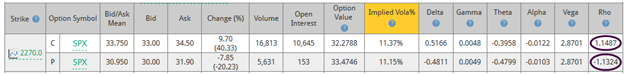
Back to the Greek letters, again in the last column for Rho, the theoretical rate of change in the value of an option for a 1% change in interest rates. Since interest rates have been historically low this Greek received little attention, but that may begin to change. Here the differences are noticeable with the call at 1.1487 and the put at -1.1324.
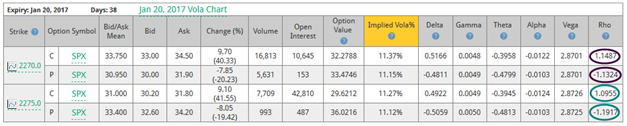
Although unlikely, should interest rates suddenly increase 1% the at-the-money call would increase by 1.1487 while the put would decrease by 1.1324. Notice the out-of-the-money call would increase less 1.0955 vs. 1.1487 while the out-of-the-money put would increase more. The relationship is reversed for in-the-money options, the calls increase more while the puts increase less as interest rates rise, see the green ovals in the data table below.
Strategy
For the S&P 500 Index, a combination of resistance at the 200-day Moving Average made it unusually sensitive to any negative fundamental news—that news arriving Thursday, February 2nd, on a report of declining German exports, resulting in a revised lower Eurozone growth forecast. The combination created a gap lower opening that ended the short-term uptrend from the December 26 low, thereby increasing the chances for a meaningful retest of the low. Accordingly,we are going to try and take advantage of market conditions with a collar strategy for SPY, the details of which you can find below.
As long as the S&P 500 Index remains above the downward sloping trending from the October 3 high and breadth continue to improve, odds favor the bulls. However, last Thursday's gap open lower suggests it may be prudent to hedge longs. Advanced Options provides the data needed to determine just how much of a hedge can be provided by using a collar.
SPDR S&P 500 ETF (SPY) 270.47 gained .41 points or +.15% for the week including +.33 points Friday. Interestingly, unlike the SPX it briefly advanced above its 200-day Moving Average last Tuesday, but gapped back below Thursday.
Assuming a 100 share long position at Friday's closing prices, how much protection can be expected by using a collar?
As a reminder, a collar consists of a long stock or ETF position and short call with a long put.
Advanced Options
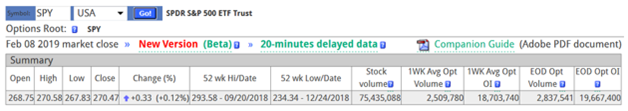
The top section of the data table shows "Feb 09 2019 market close" data has been selected. "The New Version (Beta)" will be looked at another time. The green "20-minutes delayed data" displays updates during the day. Additional details are also provided in the "Companion Guide."
The price data includes the 52 wk high and low while stock volume shows there is plenty of liquidity here along with the end of day options volume (EOD Opt Volume) and week average options volume (1WK Ave Opt Volume), with similar data for high open interest.
The next section displays volatility data, first implied volatility then historical volatility. Since most analysis uses 30 days for the term they are market with blue arrows.
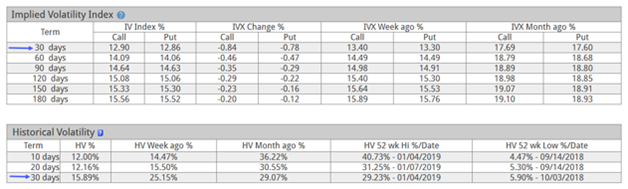
Relative to the 30-day historical volatility at 15.89% (calculated using the annual rate of change method) that has declined from 25.15% the prior week, both the mean call implied volatility index (IV Index %) at 12.90% and the put implied volatility index at 12.86% suggest options are reasonably priced compared to a month ago.
The next section with the graphs requires considerable explanation so we’re going to skip it, but if you want more info, check out the "Companion Guide" available on the application page.
Since the next monthly expiration will be Friday February 15, going out to March 15 for this trade plan allows more time. SPY has weekly options many so other expirations could be used. The available selections are in this next section with explanations at the “?” marks.

Next the heading for the selected March 15 data page.
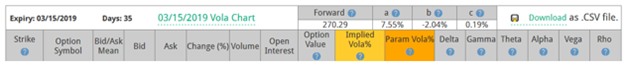
Once again details are provided at the blue “?” marks.
This example focuses on the Greeks: Delta, Gamma, Theta and Vega.
Starting at-the-money 270 with two strikes below and two above with option prices circled in red and the Greeks in purple.
Collar combination:
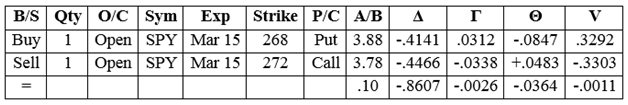
Results are .10 debit, -.8607 negative delta, with the other Greeks mostly offsetting, where Δ = delta, Γ= Gamma (rate of delta change), Θ = Theta (time decay), V = Vega (implied volatility change).
For a small debit about 86% of the long ETF risk can be hedged. By selecting other strike prices, the debit amount and Greeks will change.
The trade plan should also consider adjustments when the price of SPY changes beyond the selected strikes. Since the objective of this plan was to hedge some portion of a long position should SPY quickly decline to the lower strike near 268 a vertical put spread would add additional downside protection. For example, long a 268 put and short a 260 put. Typically, collars are used to protect gains already made by the stock or ETF, an alternative is to just sell the 272 call for a 3.78 credit an create a covered call. All the data needed for vertical spreads or any other combination are available in Advanced Options.
Summary
The short-term uptrend from the December 26 low ended last Thursday after news of slowing growth in Europe combined with solid resistance at the 200-day Moving Average the day before turned the S&P 500 Index lower increasing the probability of at least a partial retest of the December 26 low. Collars and other combinations can hedge some portion of the expected pull back.
That concludes our investigation into the Advanced Options, but we’ll be back soon. In the next few weeks, we’re going to apply a similar (albeit shorter!) analysis to the rest of our tools.


There are no comments to display.
Create an account or sign in to comment
You need to be a member in order to leave a comment
Create an account
Sign up for a new account. It's easy and free!
Register a new account
Sign in
Already have an account? Sign in here.
Sign In Now