

SteadyOptions is an options trading forum where you can find solutions from top options traders. Join Us!

We’ve all been there… researching options strategies and unable to find the answers we’re looking for. SteadyOptions has your solution.

A Case Study in SPX Put Writing


I've written about writing naked puts on multiple occasions, as I find it to be an attractive way to gain long exposure to the underlying asset class. It doesn't have to be a decision of one vs. the other (meaning, is it better to sell puts or own the underlying asset directly?), as there are advantages and disadvantages to both.

And the same is true with determining which strikes to use when selling puts. As it turns out, over a relatively long period of time risk and reward are related, as we would expect. 

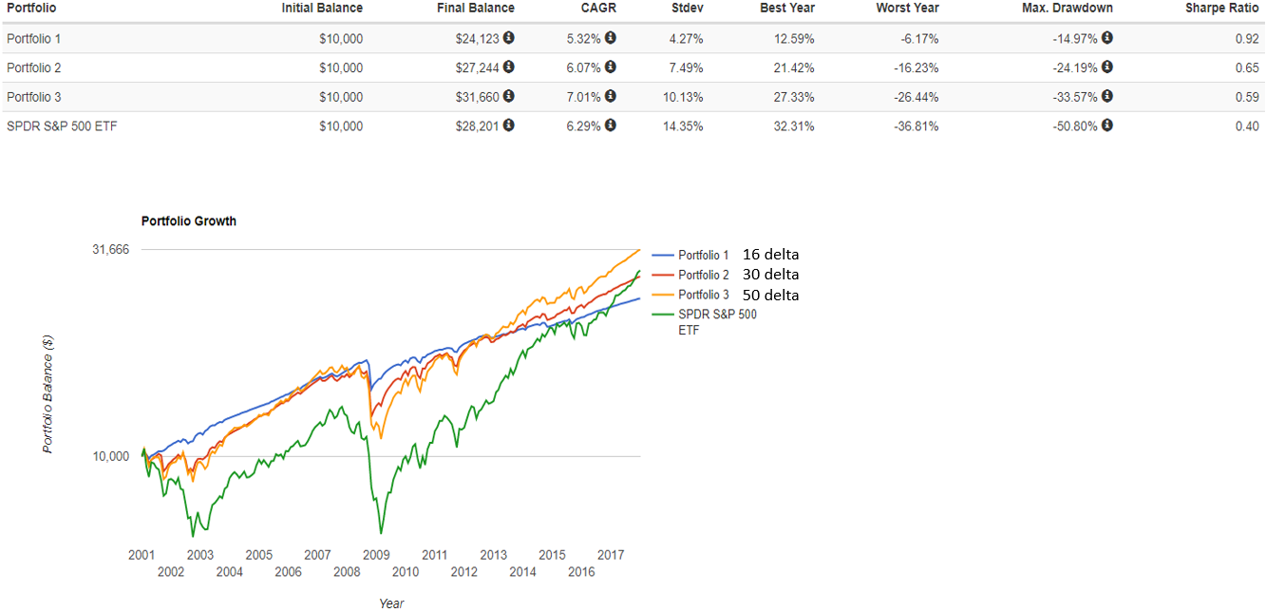
Below are the results of three backtests simulating the monthly sale of SPX put options from 2001-2017 at various delta levels (16, 30, and 50). Each test assumes you enter approximately one month from expiration and exit approximately 3 days prior to expiration (results have minimal variation if entries and exits are slightly modified). No active trade management is involved.

My tests also assume no leverage is being used, with cash fully secured by 1 month T-bills. In other words, the returns of put selling can be thought of as the yield on cash plus the net results of the option trades. No commissions, slippage, or taxes are included, so real results would be slightly lower. Given the size of the SPX contract and its liquidity, this isn't a serious issue. The strategy passes the test of real world investability.


Click on the image for greater clarity
Picture1.png


Several interesting observations can be seen:


1. All strikes deliver returns similar to the underlying asset (using SPY as a proxy). The at the money strike (50 delta) even slightly outperformed SPY. It should be noted that every backtest is sensitive to the start and end point, and if we started our test in 2009 SPY would substantially outperform. This is what we would expect given the limited profit potential of put selling. CBOE has data going back to 1986 showing that at the money put writing has delivered returns comparable to owning the underlying.


2. All strikes delivered less risk than the underlying asset, measured with standard deviation and max drawdown. This results in higher Sharpe Ratios. The Sharpe Ratio is one way to measure how well we are being compensated for the risk taken, and a higher number is better. Put selling having lower risk than owning the underlying asset is something that we can expect to persist in the future. This is often counter to the perception that many have about selling options being "risky". Leverage is what creates risk, not product/strategy. 


3. The farther out of the money strikes deliver higher Sharpe Ratio's, with 16 delta options producing an extremely high 0.92 Sharpe. This could be noise in the data that may not be likely to continue out of sample, but many other researchers have found similar results on additional data and underlying assets leading us to believe it's not random. Those who believed this will continue to persist may choose to modestly lever their notional exposure to produce higher returns instead of selling strikes that are closer to the money. 


4. If you look closely at the chart, you can see that put selling can make money even in a declining market (especially with further out of the money options, of course). For example, during the 2001-2002 bear market, 16 delta put selling was continuing to put in new equity highs. This was also the case during the first several months of 2008 where the market was declining, but not too far/too fast. When the crisis hit in the fourth quarter, the speed and magnitude of stock market losses was too great for any of the strikes to endure. No surprise there, as insurance must pay off from time to time to attract buyers. 


5. After a crisis period like 2008, put selling recovered quickly as option premiums were substantial. SPY didn't reach a new high until 2013, while put selling recovered it's drawdowns in 2010. This is important given the nature of our human discomfort with losses and our ability to stick with a strategy. 


You may even draw additional conclusions of your own from this data. So with all this being said, which strike should you sell? I don't think a binary decision needs to be made here anymore than a binary decision on if you should sell puts or just buy the ETF directly. There are advantages and disadvantages of both, but hopefully this has made it clear that put selling is worthy of at least a partial allocation for a particular asset class like US large cap equity. 

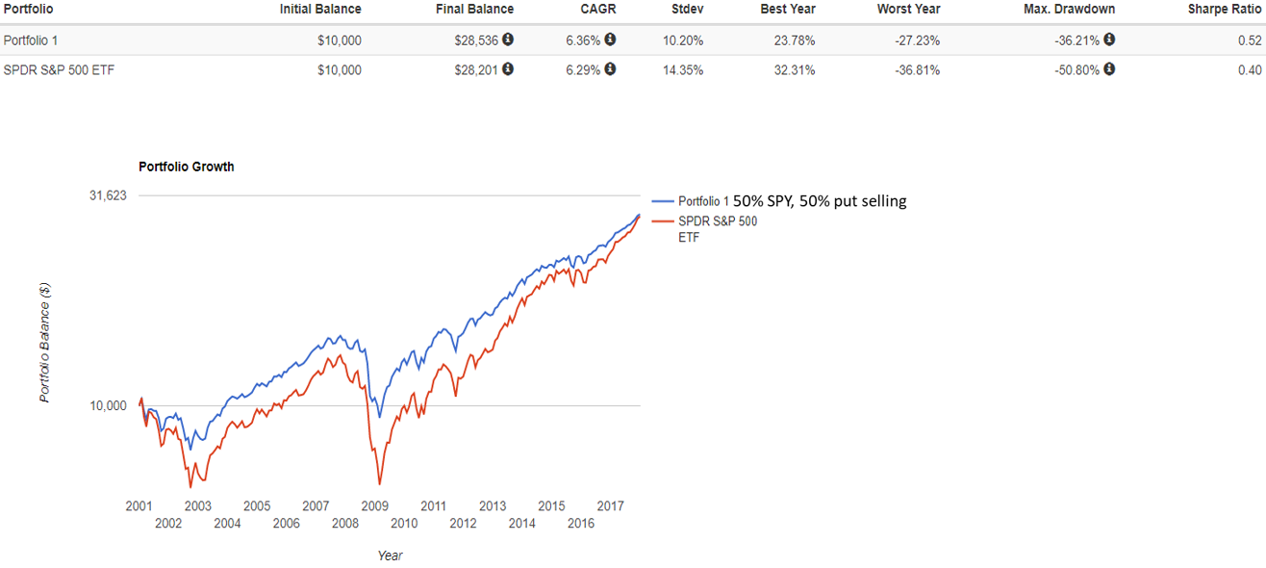
Below I'll present one additional chart that is 50% SPY, and 50% put selling with equal allocation to our three strike levels (in other words, about 16.66% each), rebalanced monthly. Given the certainty of our uncertainty about which method will be best in the future, as well as the simplicity and tax efficiency of a traditional ETF allocation, this approach could be ideal for many sophisticated investors.


Click on the image for greater clarity
Picture2.png


Jesse Blom is a licensed investment advisor and Vice President of Lorintine Capital, LP. He provides investment advice to clients all over the United States and around the world. Jesse has been in financial services since 2008 and is a CERTIFIED FINANCIAL PLANNER™ professional. Working with a CFP® professional represents the highest standard of financial planning advice. Jesse has a Bachelor of Science in Finance from Oral Roberts University. Jesse oversees the LC Diversified forum and contributes to the Steady Condors newsletter. 

What Is SteadyOptions?

12 Years CAGR of 114.5%

Full Trading Plan

Complete Portfolio Approach

Real-time trade sharing: entry, exit, and adjustments

Diversified Options Strategies

Exclusive Community Forum

Steady And Consistent Gains

High Quality Education

Risk Management, Portfolio Size

Performance based on real fills

Subscribe to SteadyOptions now and experience the full power of options trading!
Subscribe

Non-directional Options Strategies

10-15 trade Ideas Per Month

Targets 5-7% Monthly Net Return

Visit our Education Center

Recent Articles

Articles

  • Delta-Neutral Options Strategies for Earnings

    Most options trading starts with a directional guess: you think a stock goes up, so you buy calls. But some of the most reliable earnings strategies don't require you to be right about direction at all. They're built to profit from volatility itself — from how much a stock moves, or from the collapse of implied volatility after the report — while staying largely indifferent to which way it goes.

    By krisbee,

    • 0 comments
    • 1790 views
  • The Last 14 Minutes: Why We Stopped Looking at Options Closing Prices

    Here is a puzzle from our own earningsstudy charts. On Thursday, August 6, the ADBE one-week put calendar — the same 260 strike, the same September 11/18 expirations — was worth $1.425 at 3:46pm and $2.60 at the 4:00pm close. Nothing happened to the trade in those fourteen minutes.

    By krisbee,

    • 1 comment
    • 4806 views
  • Expanded Trading Hours for Select Equity Options

    The Cboe Options Exchange will start offering expanded trading hours for select high-liquidity single-stock equity options. The schedule features a morning Global Trading Hours (GTH) session from 7:30 a.m. to 9:25 a.m. ET and an afternoon Curb session from 4:00 p.m. to 4:15 p.m.

    By Kim,

    • 0 comments
    • 1160 views
  • How LEAPS Differ From Short-Term Options

    LEAPS stands for Long-Term Equity Anticipation Security. Which is just a long-dated option, typically referring to those with expirations more than a year out. There’s no technical difference between LEAPS and shorter-term options other than the expiration date. They’re traded on the same exchanges and have the same rules surrounding margin and whatnot.

    By Pat Crawley,

    • 0 comments
    • 31796 views
  • Why Not to Hold Strangles Through Earnings

    In my previous article, I described a strategy of buying a long strangle a few days before earnings and selling them just before earnings. In this article, I will show why it might be not a good idea to keep those strangles through earnings.

    By Kim,

    • 0 comments
    • 6503 views
  • Pre-Earnings Entry Price: What 31,000 Cycles Say

    Every card in the scanner carries a block called How expensive is this entry? It compares what you would pay today against what the same setup cost on the same ticker at the same point in past cycles. I built that block in August. It reads well. But a reading that looks sensible and a reading that predicts something are different things, and until last week I had only the first.


    By Romuald,

    • 3 comments
    • 1329 views
  • Expensive Compared to What?

    A trader looks at a pre-earnings straddle and asks whether it is expensive. It is the right instinct and the wrong question, because the word carries no meaning on its own. Expensive against what? A $12 straddle on a $200 stock is not expensive or cheap. It is $12.

    By Romuald,

    • 0 comments
    • 999 views
  • Beyond Strategies: What Options Traders Should Know

    Options education almost always begins with structures. Traders learn vertical spreads, calendars, butterflies, condors, covered calls and straddles, study the expiration diagrams, work out maximum profit and loss, and build a sense of the conditions each structure is supposed to suit. That foundation is necessary and there is no way around it.

    By Kim,

    • 0 comments
    • 1728 views
  • SPX vs SPY Options: Which One Should You Trade? (2026 Guide)

    Both SPX and SPY options give you exposure to the S&P 500. They track the same 500 stocks, move nearly tick-for-tick, and offer the same core strategies — credit spreads, iron condors, butterflies, and 0DTE trades. Yet the two products settle differently, are taxed differently, and carry very different assignment risks.

    By krisbee,

    • 0 comments
    • 6118 views
  • Strike Price Effects Or Pinning Revisted

    Loyal readers of this blog will recall my post from 2019 “Pinning Down the ‘Option Pinning’”. If you have not heard of pinning have a look at that article as – spoiler – everything in it as well as Jeff Augen’s observations in his books which are referenced is still valid.

    By TrustyJules,

    • 0 comments
    • 2878 views

  Report Article


We want to hear from you!


Its funny how many different opinions there are on put-writes on SPX.   If you look at the Wisdom Tree PUTW etf it has not held up so well since its launch a few years ago (granted we have been in a bull market until recently).  I also came across some scholarly articles bashing the CBOE indexes and claiming under-performance vs. SPX since they were first published.


Today I read this: https://seekingalpha.com/article/4210320-selling-puts-good-bad-ugly which seems to advocate selling puts on the weeklies but if the underlying moves down, do not lower your strike and hold the same strike until price returns (which could be years).  


What do you think about adding some trend filters?  For example, when SPX is below 200 sma use the 16 delta and when above the 200 day sma use 50 delta or just hold the underlying?  


Share this comment


Link to comment
Share on other sites

23 hours ago, FrankTheTank said:

Its funny how many different opinions there are on put-writes on SPX.   If you look at the Wisdom Tree PUTW etf it has not held up so well since its launch a few years ago (granted we have been in a bull market until recently).  I also came across some scholarly articles bashing the CBOE indexes and claiming under-performance vs. SPX since they were first published.


Today I read this: https://seekingalpha.com/article/4210320-selling-puts-good-bad-ugly which seems to advocate selling puts on the weeklies but if the underlying moves down, do not lower your strike and hold the same strike until price returns (which could be years).  


What do you think about adding some trend filters?  For example, when SPX is below 200 sma use the 16 delta and when above the 200 day sma use 50 delta or just hold the underlying?  


I wrote about adding trend to put selling in Feb 2017, you can read the article HERE. 

Share this comment


Link to comment
Share on other sites

1 minute ago, Jesse said:


I wrote about adding trend to put selling in Feb 2017, you can read the article HERE. 

I think I am you but 10 years in the past.   Almost every idea I have I found you already have a post and research on it.

How does the future look?  :)  

Edited by FrankTheTank

Share this comment


Link to comment
Share on other sites

2 minutes ago, FrankTheTank said:

I think I am you but 10 years in the past.   Almost every idea I have I found you already have a post and research on it.

How does the future look?  :)  


I feel that way about others in finance as well! I'm confident that the future for basic put selling will be good because the basic intuition of a sustainable risk premium is pretty solid. Sellers are taking on the risk that other market participants are looking to insure, and in an efficient market, that produces a positive expected return over time for the seller. I think the ideal approach is to diversify that risk across symbols, strikes, and expirations as much as is reasonably possible. 

Share this comment


Link to comment
Share on other sites


Join the conversation

You can post now and register later. If you have an account, sign in now to post with your account.
Note: Your post will require moderator approval before it will be visible.

Guest
Add a comment...

×   Pasted as rich text.   Paste as plain text instead

  Only 75 emoji are allowed.

×   Your link has been automatically embedded.   Display as a link instead

×   Your previous content has been restored.   Clear editor

×   You cannot paste images directly. Upload or insert images from URL.

Loading...