
Leaderboard


Popular Content
Showing content with the highest reputation on 08/17/26 in all areas
-
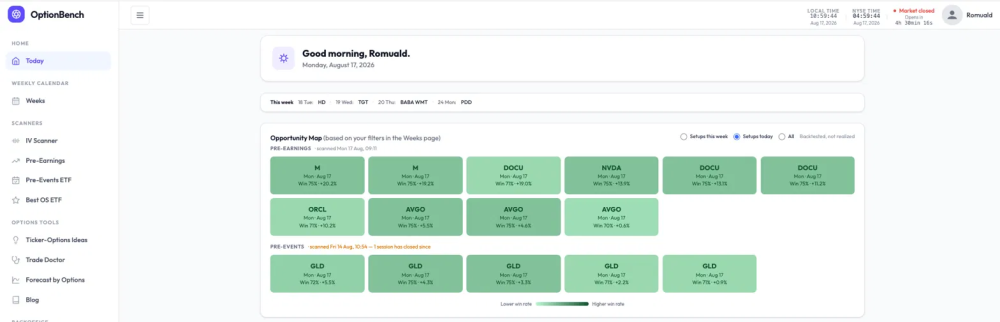
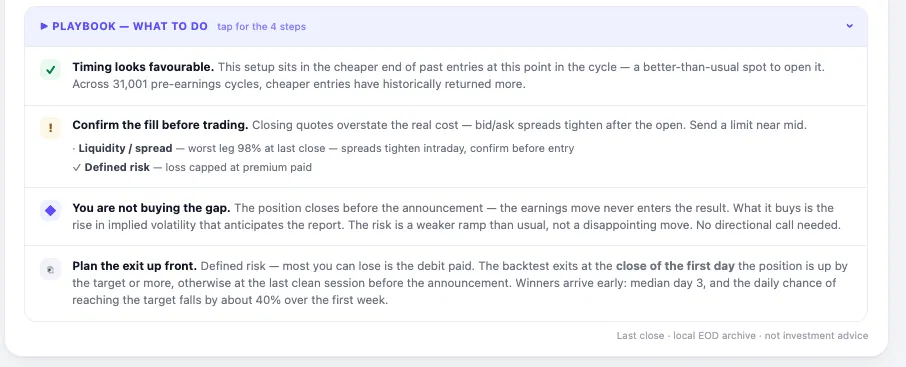
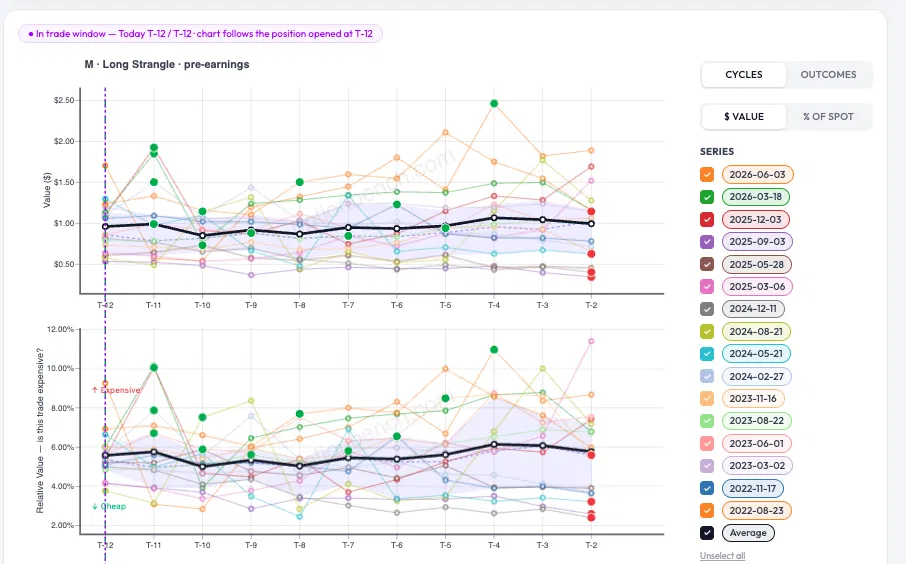
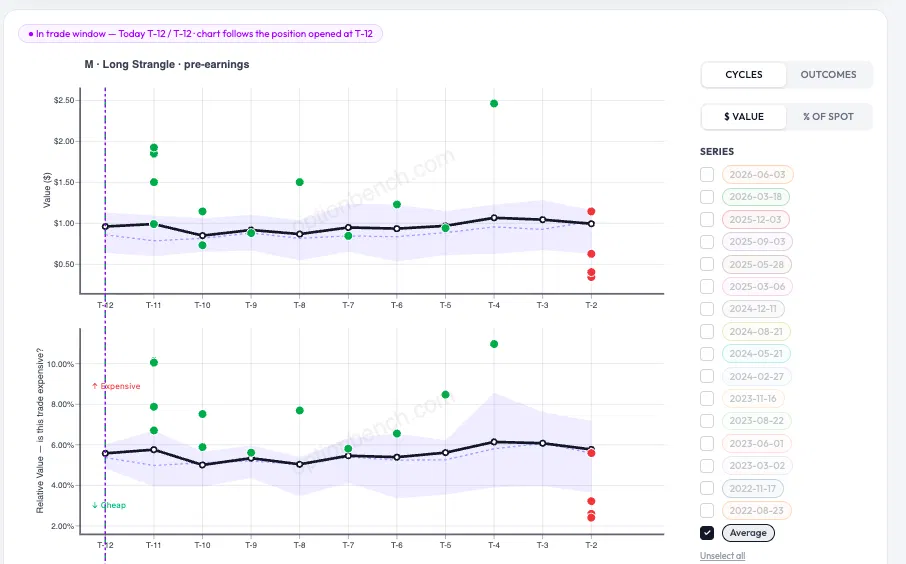
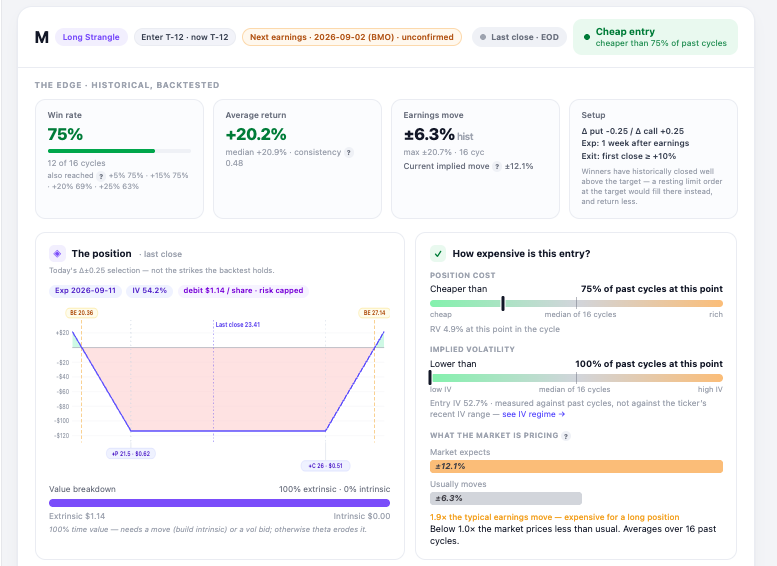
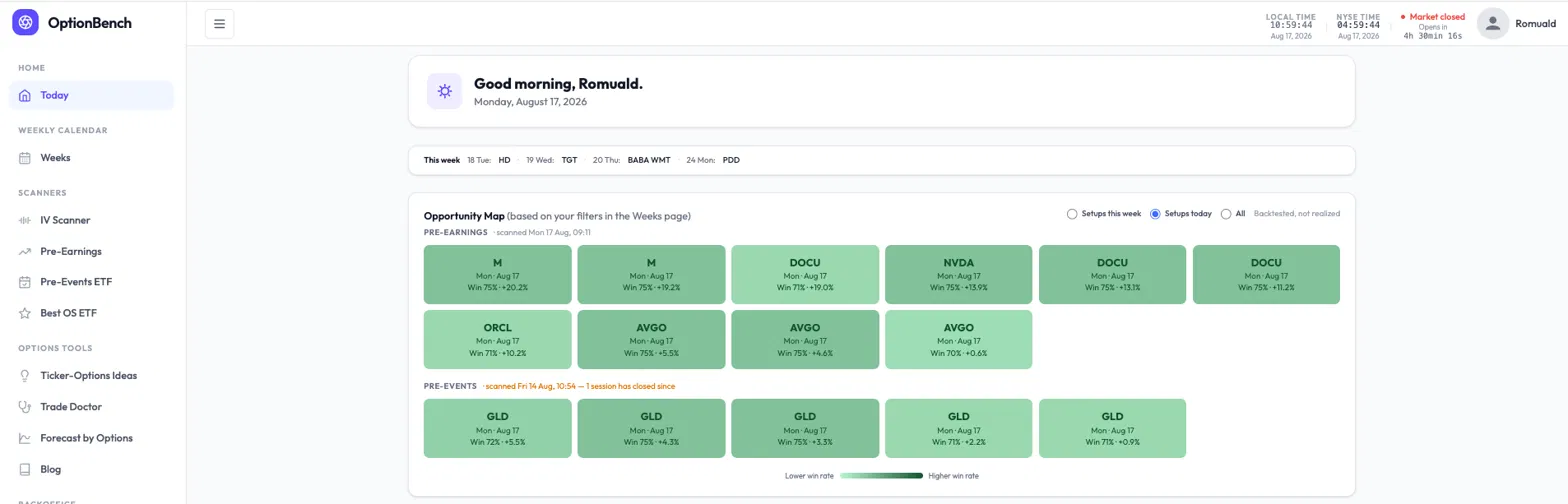
What a Monday morning looks like on OptionBench Someone asked what the workflow actually feels like rather than what the features are. Easiest way to answer is to walk through this morning. You land on Today. No search, no setup — the Opportunity Map is already there, showing what's in its entry window. One radio button switches between setups opening today and setups opening this week. Tiles are shaded by win rate, and each one carries the ticker, the entry date and the historical return. Markets are still closed as I write this, and the card says so — pre-earnings scanned this morning at 09:11, pre-events still on Friday's data. That's deliberate: you should always know which session you're looking at. Macy's caught my eye, so I clicked the tile and the row opened. The top strip is the backtested edge: win rate over 16 cycles, average and median return, the size of the move this name usually makes on earnings, and the exact rule the statistics were measured under — Δ±0.25, one week out, exit on the first close at or above +10%. Underneath, two things worth separating. On the left, the position as it prices right now — strikes, debit, and the fact that it's 100% extrinsic, which means it needs a move or a vol bid or theta gets it. On the right, whether that entry is expensive: cost cheaper than 75% of past cycles at this same point, implied vol at the bottom of its own range. Both needles sit left of the median, which is the reading you want. Below that, what the market is pricing against what the stock usually does: ±12.1% implied versus a ±6.3% average earnings move. Nearly twice the usual — which matters when you're buying. The playbook is four steps, collapsed by default. Timing, execution, what the trade is actually buying, and how it exits. The third one is the part most people get wrong: the position closes before the announcement, so the earnings move never enters the result. You're buying the ramp in implied volatility, not the gap. And the history. Every past cycle, value and relative value, with the current cycle overlaid. Green dots hit the target, red didn't. It gets busy fast, so you can strip it to the average band and read the shape instead. That's the whole loop: land, scan, open one row, decide. Free to look at — https://optionbench.com Not investment advice. The tool describes what setups have done historically; your broker's chain is where you check what actually fills.
 1 point
This leaderboard is set to New York/GMT-04:00