
Leaderboard

Popular Content
Showing content with the highest reputation on 09/21/26 in all areas
-
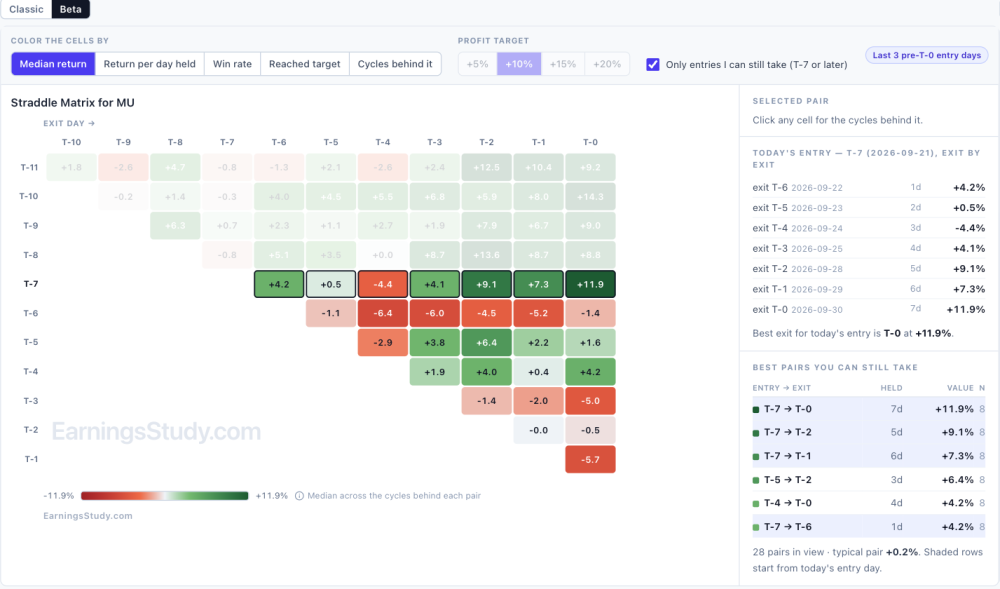
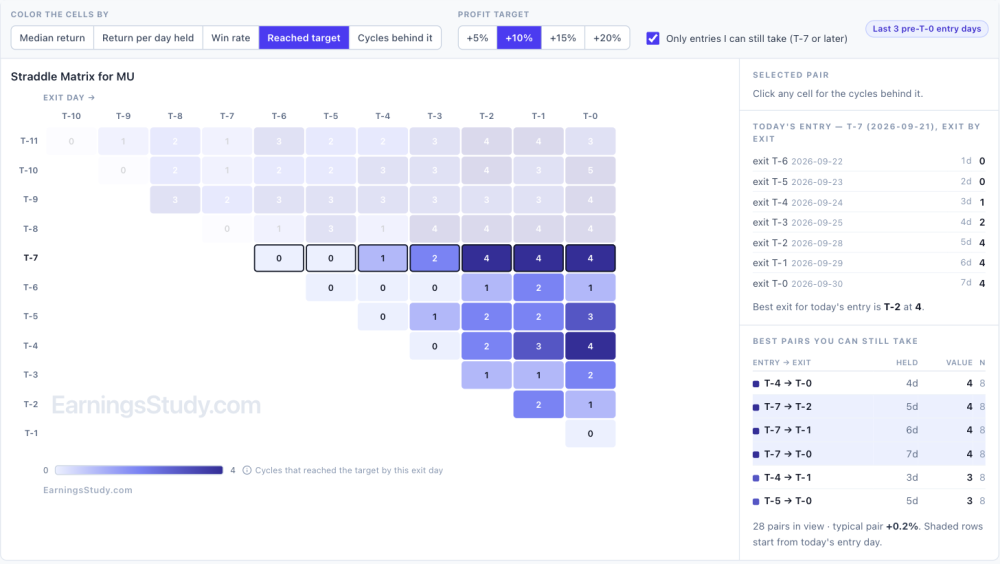
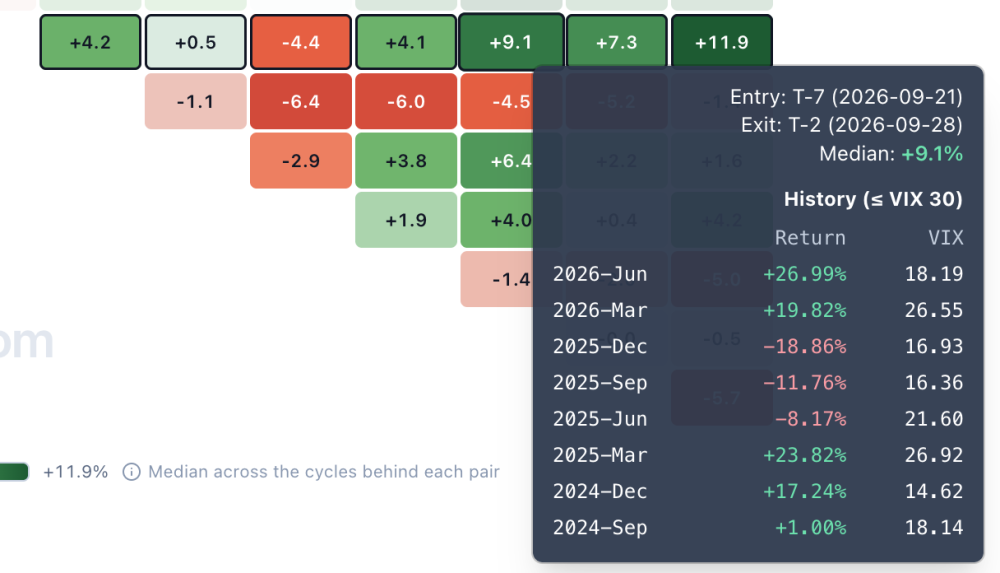
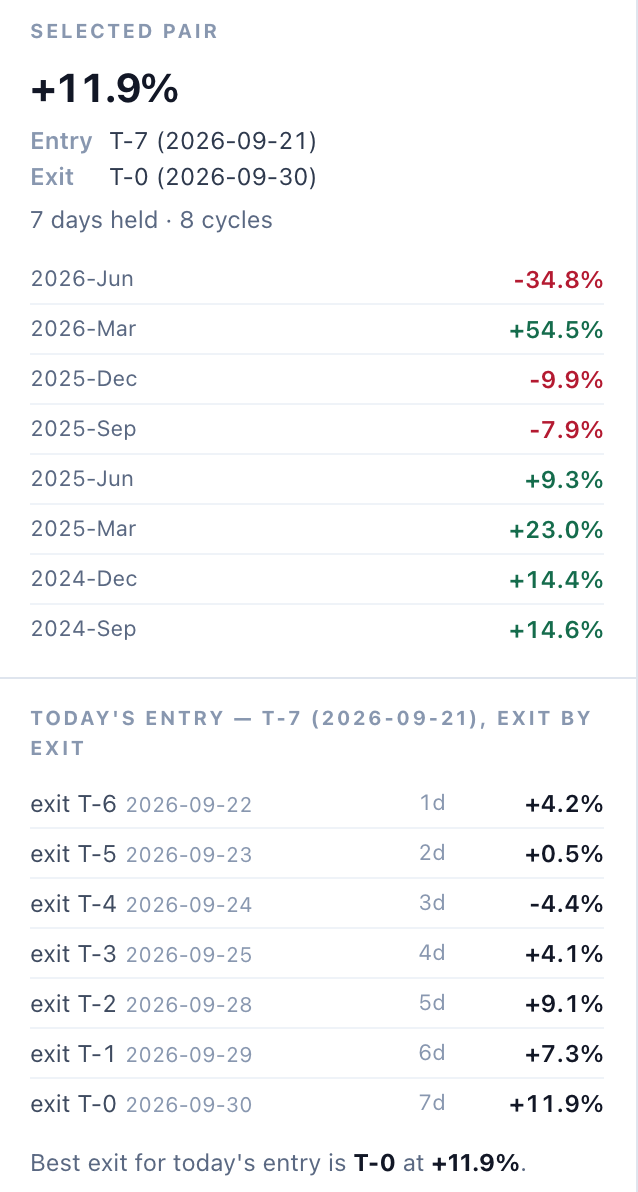
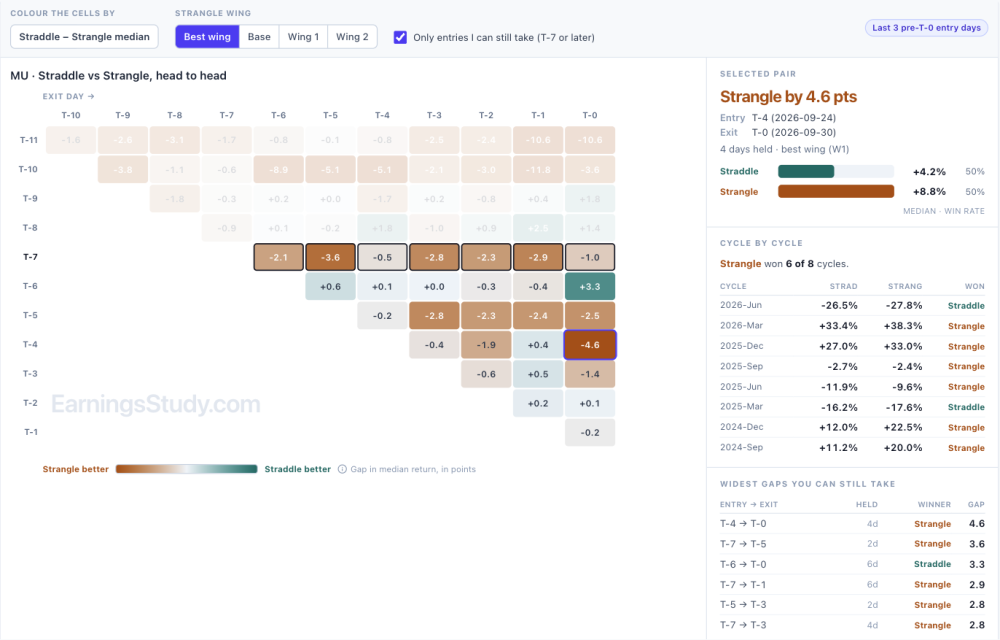
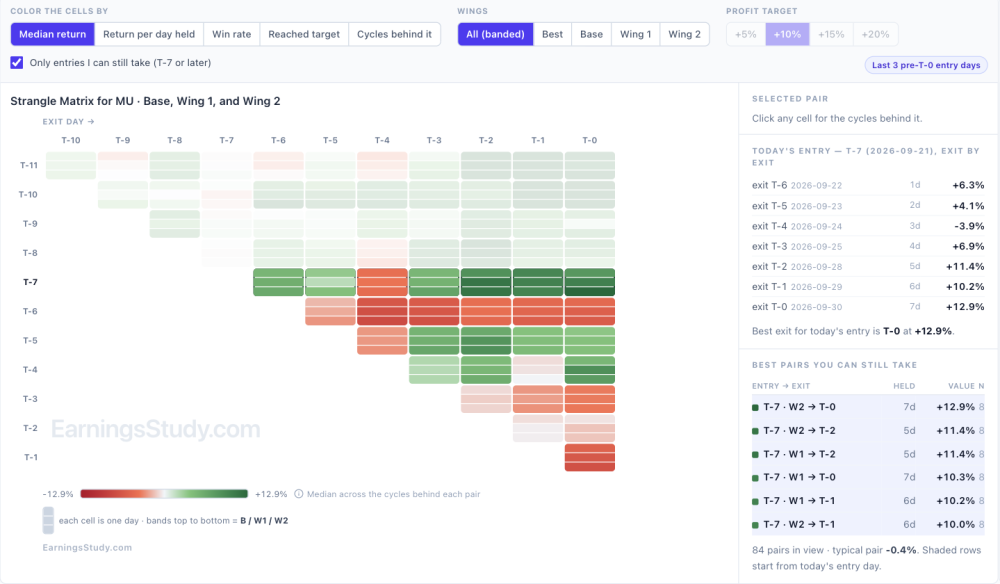
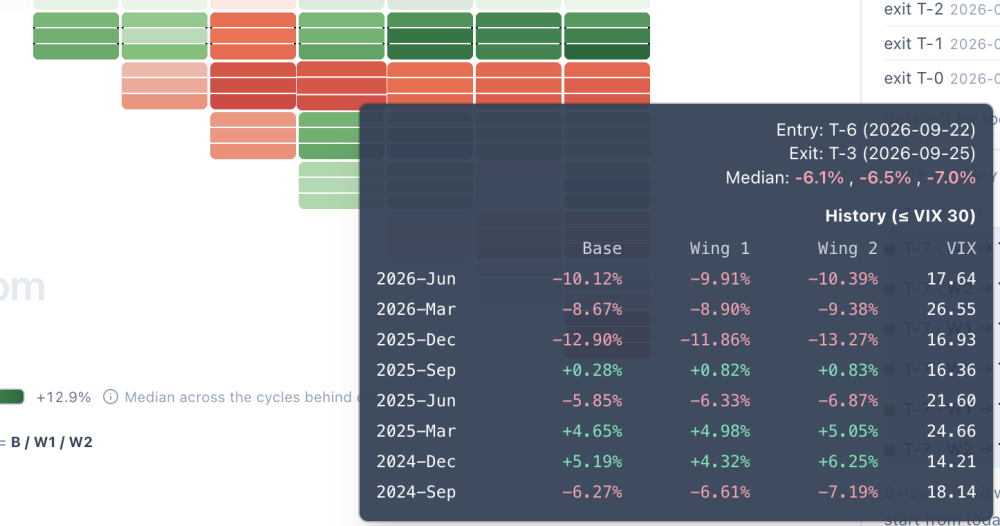
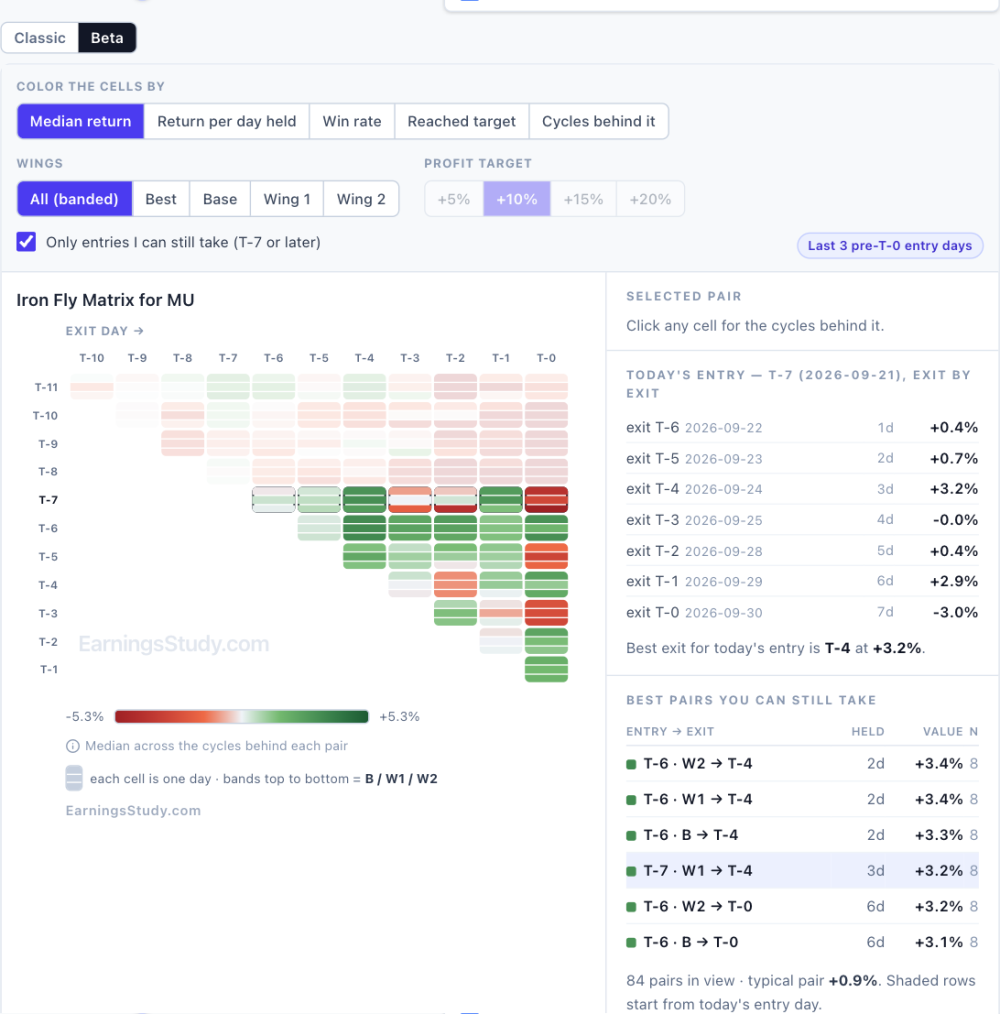
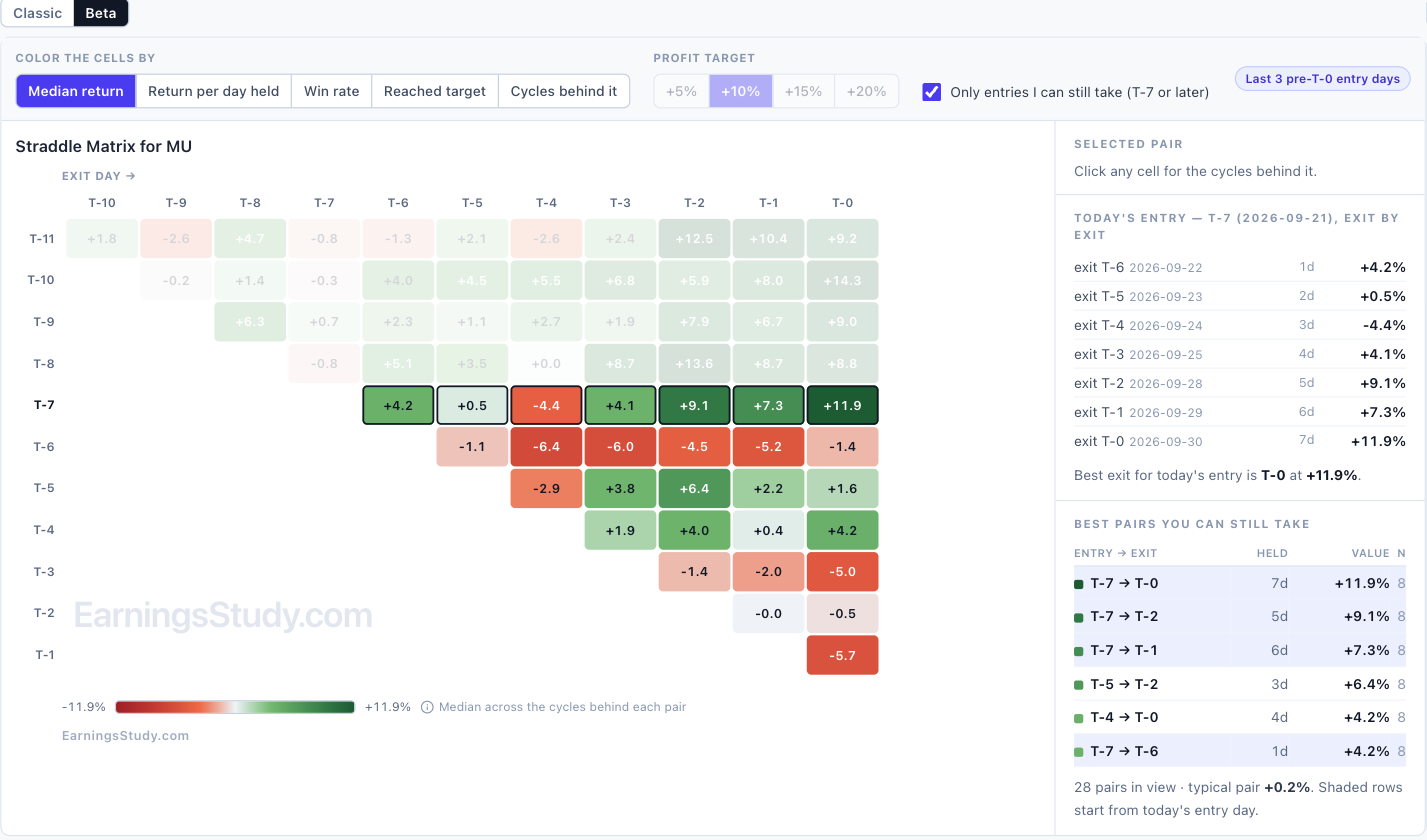
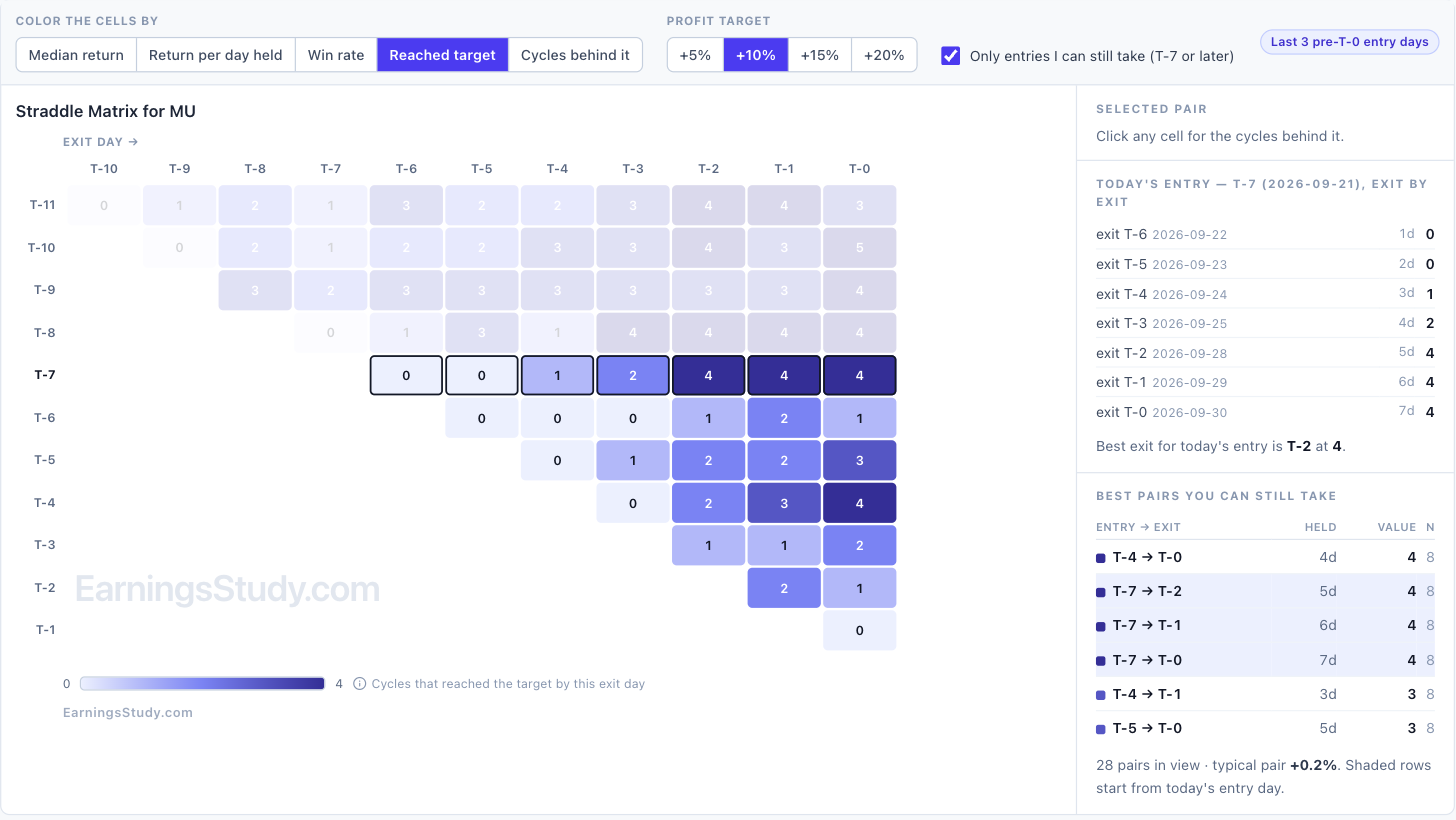
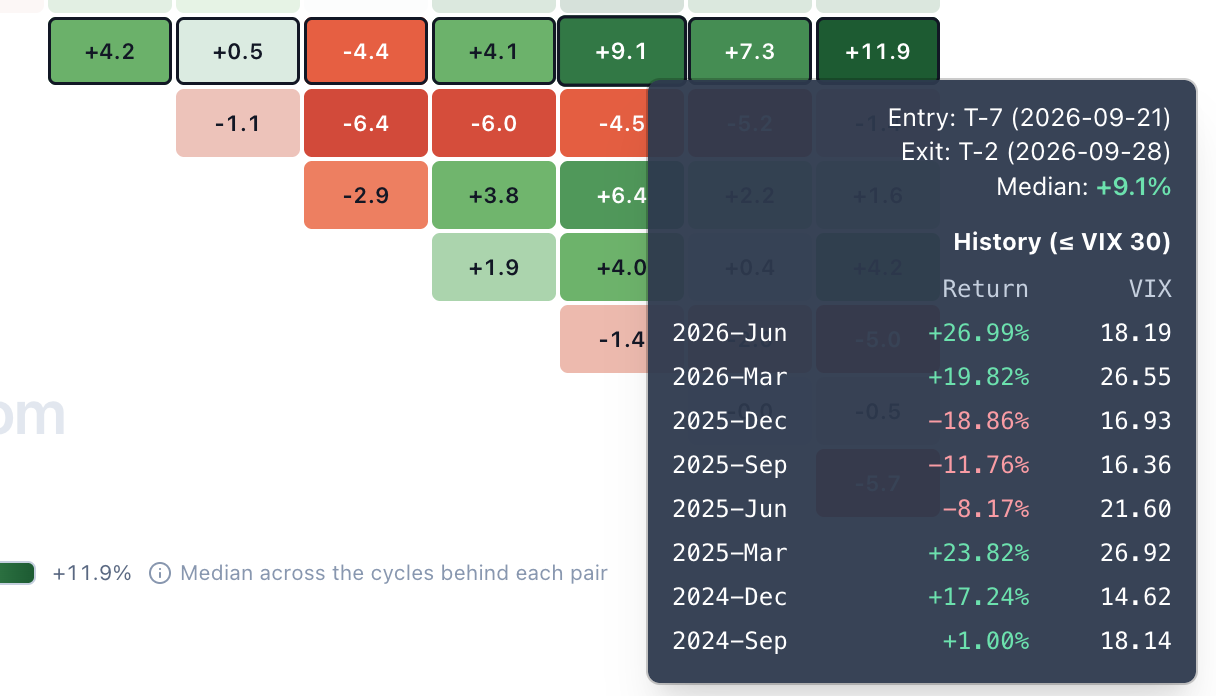
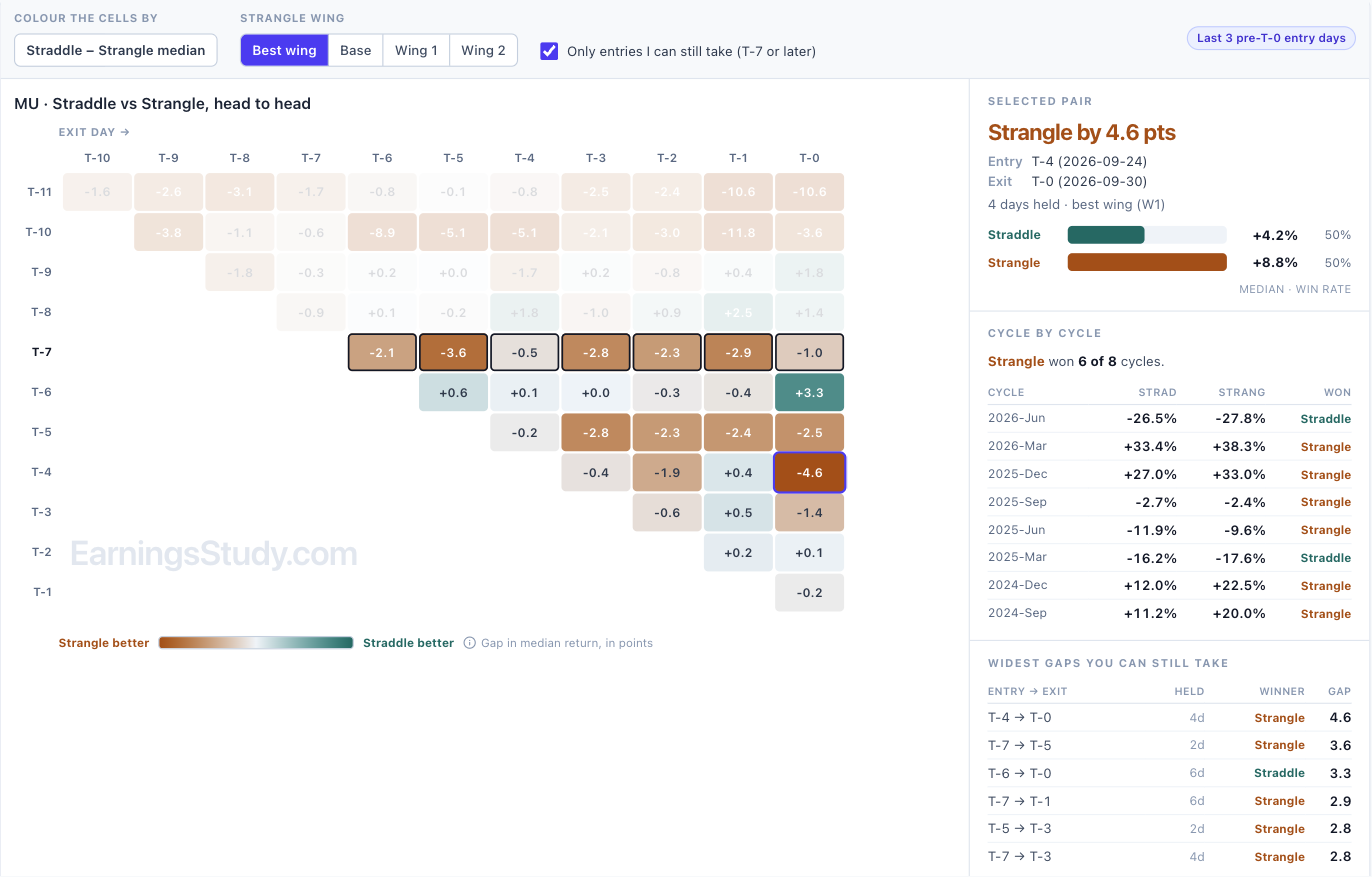
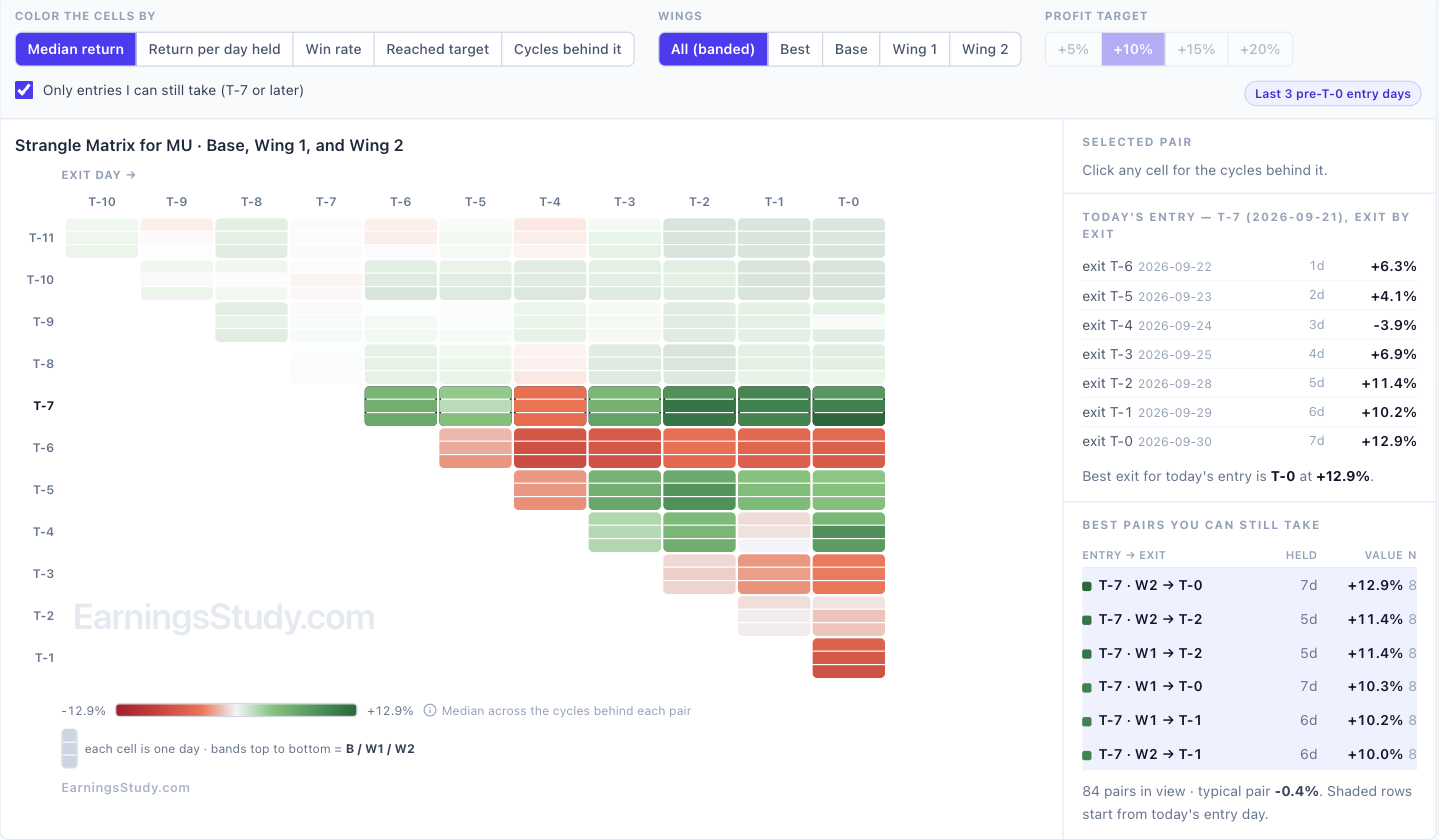
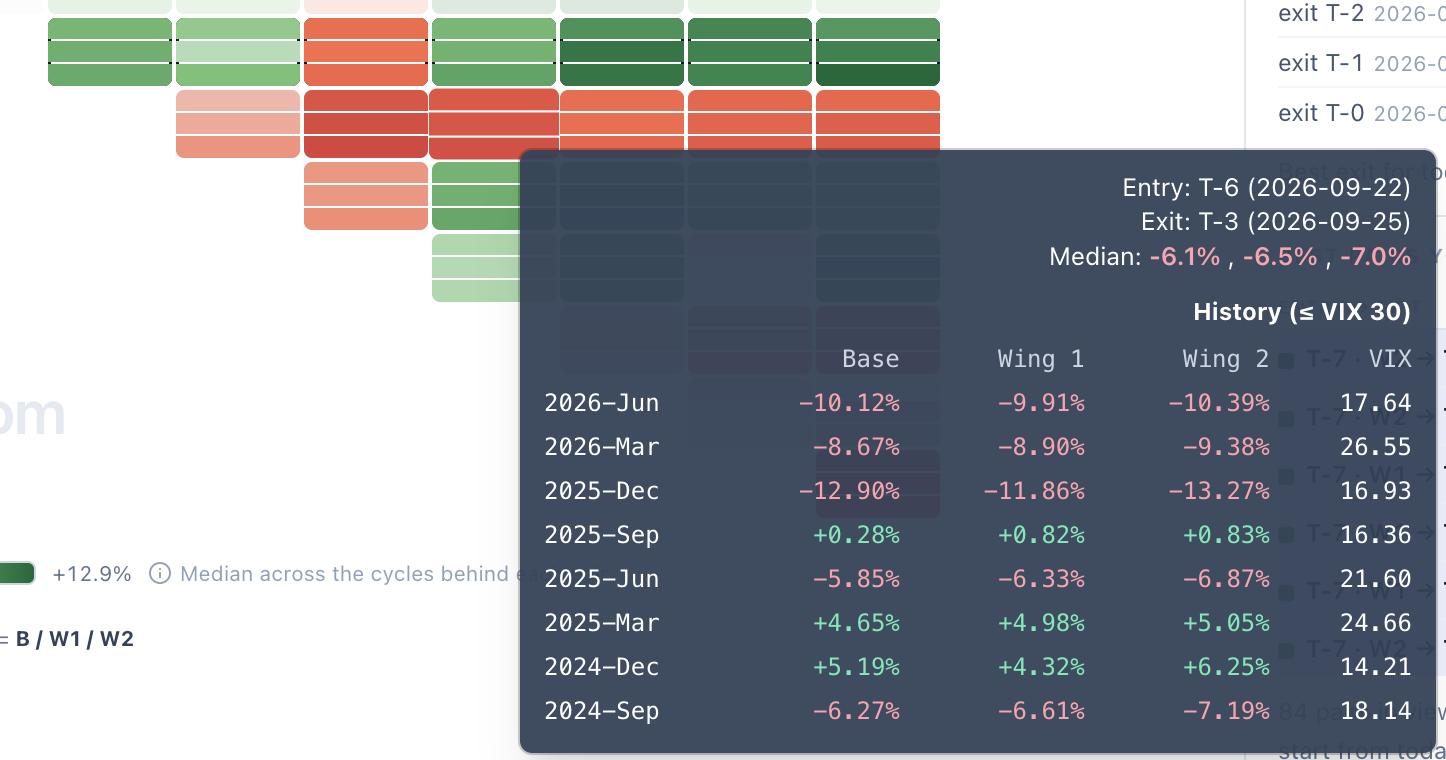
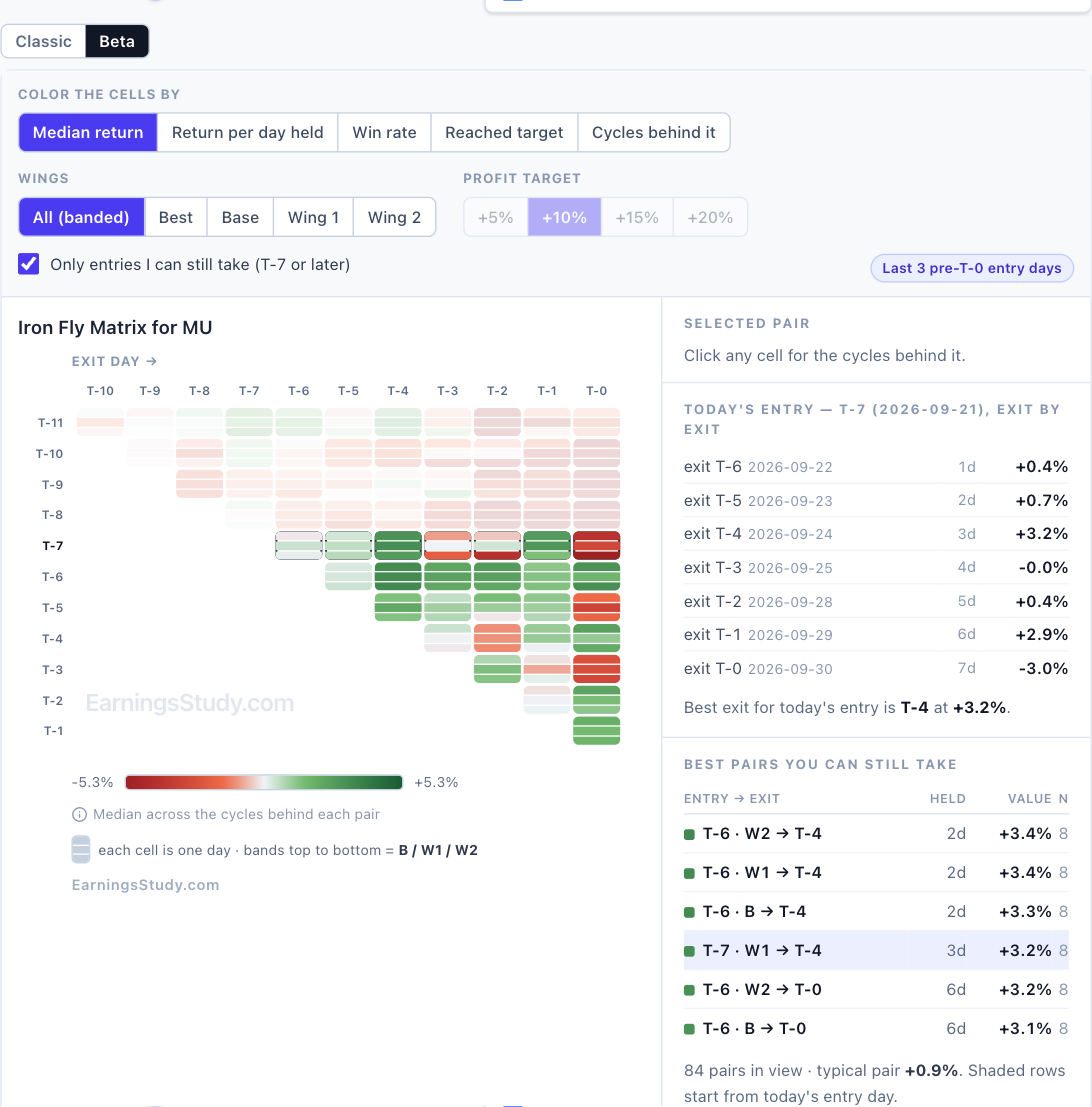
One grid, five questions — the new return matrix (Beta) The return matrix has always answered one question: what does the median cycle pay for every entry/exit pair? That is a good question. It is not the only one worth asking, and the same grid can answer the others without changing shape. The Beta matrix lets you change what the color means. Same entry × exit triangle, same history behind it, five different questions. It is live on every pre-earnings strategy page: Calendar, Straddle, Strangle, Iron Fly, Double Diagonal, Long Options, Call Debit Spread, etc., Screenshot 1 — MU straddle, colored by median return. Today’s entry, T-7, is the boxed row. The five questions Color the cells by The question it answers Median return What does a typical cycle pay? This is the Classic view. Return per day held Which pairs pay fastest? Median return divided by days held, so a two-day hold and a seven-day hold are compared on equal terms. Win rate How often did the pair finish positive at all? Reached target How many cycles reached +5%, +10%, +15% or +20% by that exit day? Cycles behind it How much history is each number actually built on? Reached target is the one I would look at first. Screenshot 2 — Same grid, now counting cycles that reached +10% by each exit day. On MU, a T-7 straddle reached +10% in 4 of 8 cycles by T-2 — and holding on to T-0 added no new ones. Those last two days bought more exposure, not more hits. The median view cannot tell you that; this one says it in a glance. The rows you can actually trade Half the triangle is entry days that have already passed. Only entries I can still take is on by default and fades them, so the ranking on the right lists only trades you can still put on today. It also makes the grid easier to read honestly. Look at the T-6 row in screenshot 1: one day later than today’s T-7 entry, the same straddle is red across the board. Every number opens up A median over eight cycles hides a lot. Hover any cell and you get every cycle behind it with the VIX that ruled it — gains in green, losses in red. Click it and the side panel pins the cycle list, with the actual calendar dates of your entry and exit. Screenshot 3 — Hover a cell: every cycle, its return and its VIX. Screenshot 4 — Click a cell: the side panel pins it, with real entry and exit dates. That is the honest read on MU’s best pair. T-7 → T-0 has a +11.9% median, but the individual cycles ran from −34.8% to +54.5%, and five of the eight were winners. A real edge with wide dispersion — size accordingly. Straddle vs Strangle, head to head Two matrices side by side ask you to subtract two colour scales in your head — and they were never on the same scale. In Beta, Compare with Strangle draws one grid instead: each cell is Straddle minus Strangle, teal where the straddle wins and amber where the strangle does. Click a cell for the cycle-by-cycle scorecard. Screenshot 5 — MU, T-4 → T-0: the strangle leads by 4.6 points (+8.8% against +4.2%) and won 6 of 8 cycles. The scorecard is the part two separate grids can never show. A small median edge that came from one lucky cycle looks identical to one that held up in six of eight — until you count them. It works the other way round from the Strangle page, and the wing selector lets you compare against a specific wing or the best one. Three wings, one row Strangle, Iron Fly and Double Diagonal each have three wings, which used to mean three rows per entry day and a matrix three times taller than the rest. Beta folds them into one row: each cell is split into three bands — Base, Wing 1 and Wing 2 from top to bottom. A third of the height, all three wings visible at once. Pick a single wing, or Best, and the numbers come back into the cells. Screenshot 6 — MU strangle: one row per entry day, one band per wing. Hover a banded cell and the three wings line up cycle by cycle: Screenshot 7 — MU strangle, T-6 → T-3: every wing lost in the same five cycles. When all three wings agree like that, the wing is not the problem — the timing is. Screenshot 8 — The same banded view on Iron Fly. Double Diagonal work the same way. How to turn it on Open any pre-earnings strategy page and load a symbol. Above the History Matrix, click Beta. Classic is one click away, and your choice is remembered. The VIX filter, earnings cycles and “3 days before current day” settings all carry over. It is labelled Beta because I want your feedback before it replaces anything. Tell me which view you end up using — and which question you wish the grid could answer that it cannot yet.
 3 points
This leaderboard is set to New York/GMT-04:00