
Leaderboard


Popular Content
Showing content with the highest reputation on 08/16/26 in all areas
-
Thank you @Kim — and welcome to everyone who registered this week. A few of you asked what's actually inside. Fair question — the screenshots only ever show a corner of it. Here's the full picture, same platform for both paths: free with the All-services bundle for as long as you keep it, or $39.99/month at the introductory rate, grandfathered at whatever price you join at. The scale of it first, because it's the part you can't see from a screenshot. This isn't one strategy with a win rate on top. The platform models 27 distinct strategy variants on every name: Calendars — put and call, each at monthly or 1–5 weeks: 10 variants Strangles — ATM, ATM+1, ATM+2 wings Iron Flies — base, wing 1, wing 2 Double Diagonals — base, wing 1, wing 2 Long options — 40Δ and 90Δ, calls and puts Straddles and call debit spreads Few more strategies to be opened for public soon Every variant gets its own full return matrix — entry day × exit day, median historical return per path, every underlying earnings cycle preserved. Across 2,000+ symbols with backtested history, that comes to over 191 million backtested entry-to-exit outcomes sitting behind the screens — recomputed as new cycles complete, refreshed every trading day. When a tile shows you "Win 88%", the cycles behind it are one click away, with the VIX each one happened under. No summary stat without its receipts. How you actually use it, day to day: The Summary page — type a symbol, get the whole picture on one screen: next earnings date, current setup, where today's relative volatility sits against that name's own history, and the suggested structure. It's the "should I even look closer?" page. The Daily Screener — every name opening an entry window, across all variants at once, filterable by median return, win rate, strategy, weeklies, and spread. Liquidity (NBAS) is one gate among several, not the headline — probability and consistency do the ranking; the spread column just keeps the backtest honest about fills. The return matrix — the deep dive. Compare entering T-12 vs T-5, exiting before the print vs holding through it. Click any cell for the cycle-by-cycle history. Holding through the print — the matrices don't stop at T-0. The T-0 → T+1 paths show what historically happened when a position was held through the release — for every variant, every name. Whether holding through earnings has historically paid or punished on your specific setup isn't a debate; it's a column. Post-earnings outcome analysis — after each print, see how the setups you were watching actually resolved, so the review loop is built in. Peer earnings view — read HD's print against TGT and WMT before they report. Read-through weeks are half the season. Macro events calendar — FOMC, CPI, PPI [+GDP/PCE/JOBS if live] next to the earnings calendar, because some weeks the vol you're buying isn't earnings vol. And it's not just a calendar: the same backtest engine runs on macro events too — 130,000+ backtested outcomes on straddles and strangles entered around scheduled macro releases. Watchlists, favorites, and setup tracking — pin a setup, watch its pricing and expected move evolve daily through the print, review it after. Every tracked setup becomes a lesson. And it keeps moving. Check the What's New page: 8 additional features shipped in the last 4 weeks (we are not even 2 months after go-live) — the spread filter, peer earnings date overlaying on RV charts, macro events overlaying on charts...— nearly all of them because someone here asked. Lately the pace has been one to two releases a week, and the roadmap is mostly this thread's questions, ranked. If something's missing or confusing, DM @Kim or @krisbee — that's how the product gets built. Everything in the platform is historical/educational analysis, not trade recommendations or financial advice. Options trading involves substantial risk.2 points
-
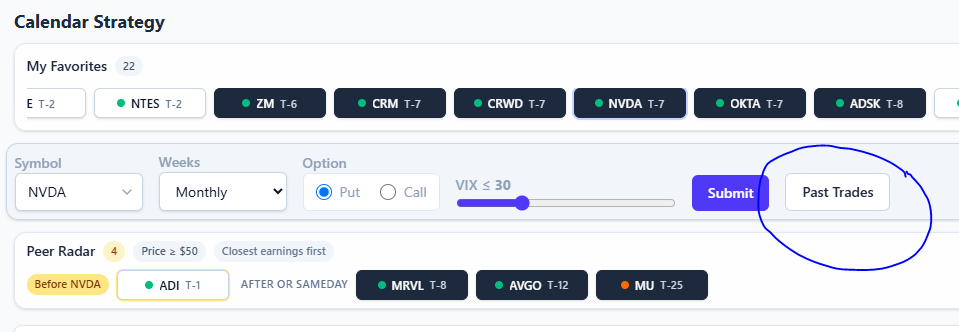
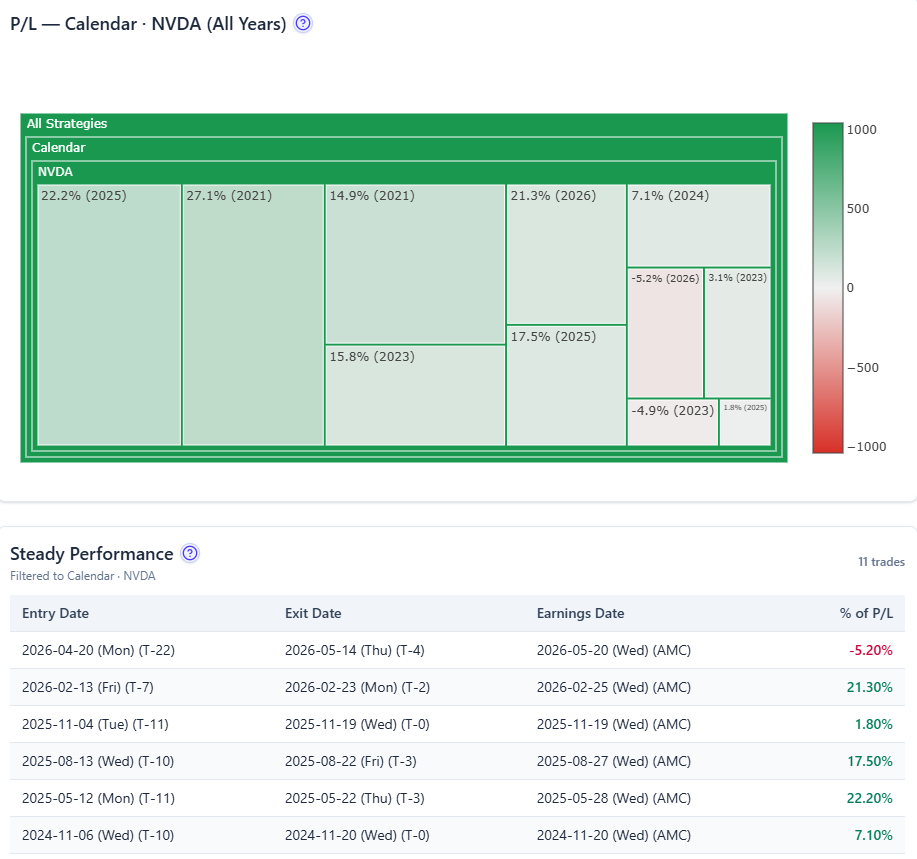
Here is another cool feature. Say you consider NVDA calendar, and you want to see how it performed in the past. It is one click away:
 1 point
This leaderboard is set to New York/GMT-04:00