
Leaderboard


Popular Content
Showing content with the highest reputation on 08/15/26 in all areas
-
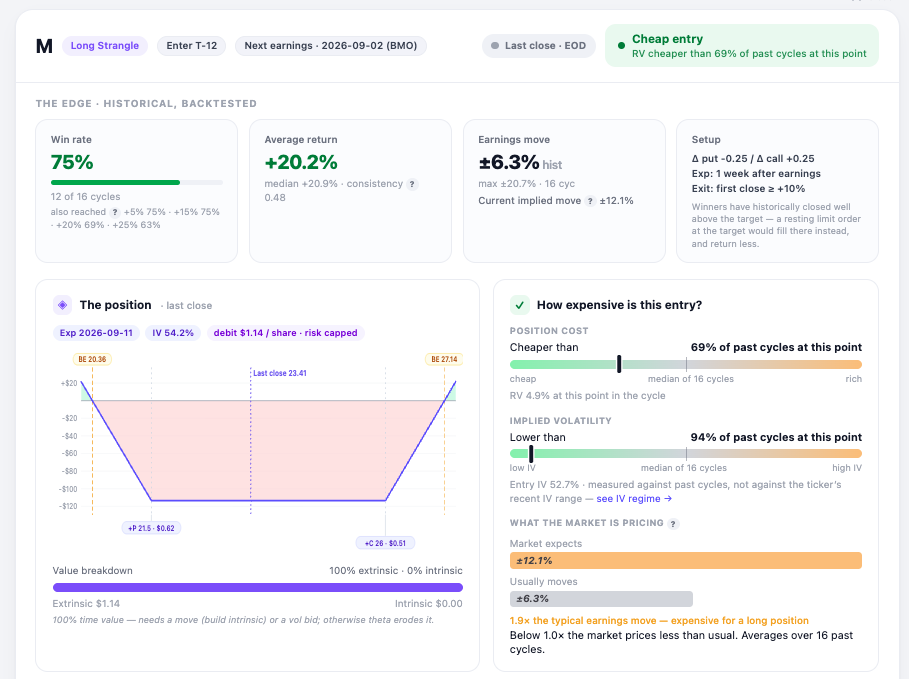
What a pre-earnings card looks like now Several people asked what the scanner actually shows once you open a row, so here is one from Friday — Macy's, long strangle, entry window opening at T-12. Two things I reworked this week. The entry readings now sit on a fixed scale. Cheap on the left, rich on the right, needle where this setup falls against its own history at the same point in past cycles. Position cost is a little below the median of 16 cycles; implied vol is near the bottom of the range. Before, the bar filled from the left in both cases and you had to read the label to know which direction it meant. Below that, what the market is pricing against what the stock usually does: ±12.1% implied versus a ±6.3% average earnings move. Roughly twice the usual — which matters, because this position is bought, not sold. The line worth pointing at, though, is on the setup tile. The exit rule is "first close at or above +10%", and a close is not the threshold — it is wherever the market happened to finish that day. Across the backtest history the median winner books well above the target. So a resting limit order at +10% would fill at +10% and return less than the numbers on the card. Worth knowing before you place the order. Free to look at: https://optionbench.com Not investment advice — the tool describes what setups have done historically, your broker's chain is where you check whether it fills.
 2 points
 -
We see your account. Next steps, please check your email.1 point
This leaderboard is set to New York/GMT-04:00