
Leaderboard




Popular Content
Showing content with the highest reputation on 08/13/26 in all areas
-
thanks @Romuald I need to spend more time poking around the pre-event screener and this will help - just not comfortable with it yet to make an informed decision1 point
-
Good question, and it's two separate things: one is a deliberate decision, one is a gap. The deliberate part. On earnings I show a third line in the entry block: the ATM straddle against the stock's average past earnings move. I measured it on events yesterday and it doesn't transfer. Across the nine live event combos, that ratio runs 3× to 7×, against a 1.72 median on earnings. The reason isn't calendar randomness, it's that a one-week straddle prices a full week of ordinary sessions, and on earnings the gap dominates that price while an ISM PMI moves GLD about 1.1%. So the same number means something completely different, and published with the earnings thresholds it would read "expensive" on every line, permanently. It's absent rather than wrong. The honest version would be a self-referential one — "event premium richer than X% of past cycles here", same grammar as the two lines above it. That needs the ATM straddle history per cycle, which I don't store yet. It's on the list. The gap. You're right that the implied move is missing from the tile itself. On pre-earnings the move tile shows "Current implied move ±X%" alongside the historical average; on pre-events it only shows the historical. That's an oversight rather than a choice, and it's the cheaper of the two to fix. Thanks for spotting it, the tile and the block are different questions and I'd conflated them.1 point
-
@Romuald nice will add GLD to my to do list DOCU is already there1 point
-
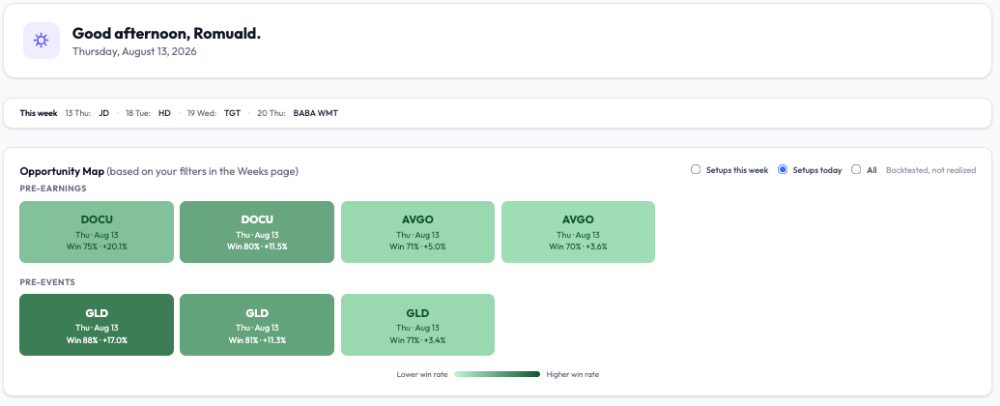
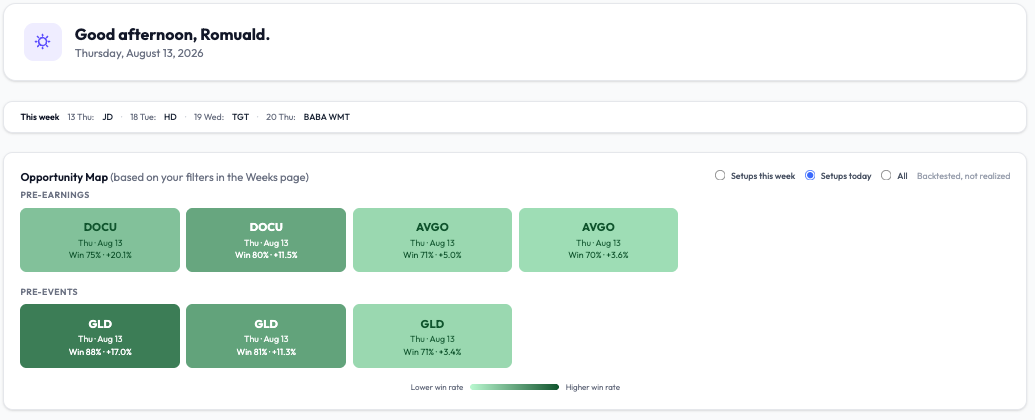
Today's entry windows Three names open an entry window today on the scanner. My filters: win rate ≥ 70%, positive average return, at least 20 earnings cycles of history, at least 2 years on events, and liquidity B or better. The 20-cycle floor matters more than the win rate itself. A 100% win rate on four cycles tells you nothing, and my own scanner flags those rather than showing them off. But everything above is backtested history : win rate and average return across past cycles. It says nothing about whether today's entry is priced well or not. That part only exists once the options data comes in, roughly half an hour after the open, and it's the part that decides the trade. What I'd look at on each card once quotes are live: — Entry cost against its own history. Am I buying early or late in the volatility ramp? — Entry IV against its own history. How much ramp is left to build? — Earnings premium. The ATM straddle against what the stock has actually delivered across past reports. This is the only one whose denominator is something real. Those three can disagree, and the disagreement is usually the interesting bit. A setup can read cheap against its own history while still pricing more move than the name typically produces. Yesterday's example: three earnings names cleared the same filters and all three came back rich on cost, IV and premium at once. Good history, wrong price. I didn't take any of them. The reasoning behind those three readings is here if it's useful: https://optionbench.com/blog/expensive-compared-to-what Happy to answer methodology questions — those are the ones I enjoy. Romuald - optionbench.com
 1 point
This leaderboard is set to New York/GMT-04:00