
Leaderboard




Popular Content
Showing content with the highest reputation on 08/12/26 in all areas
-
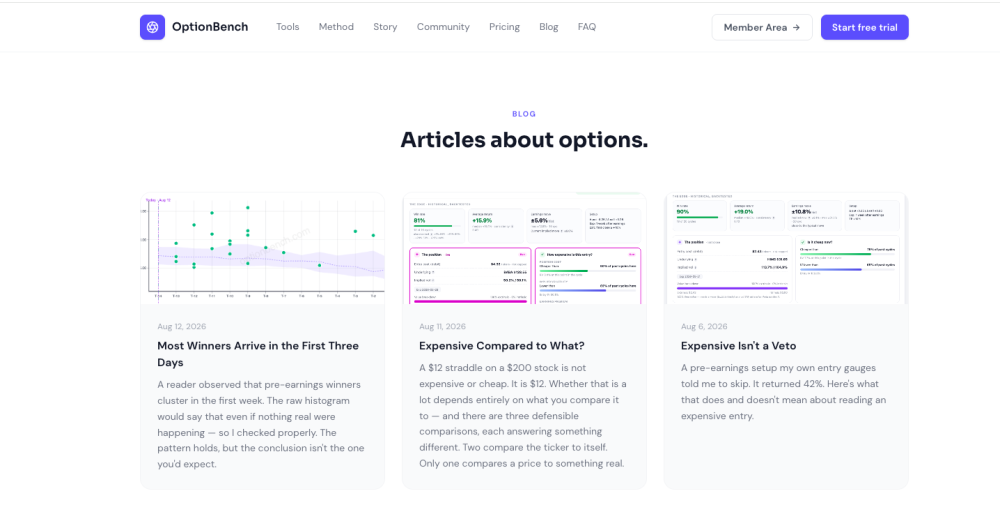
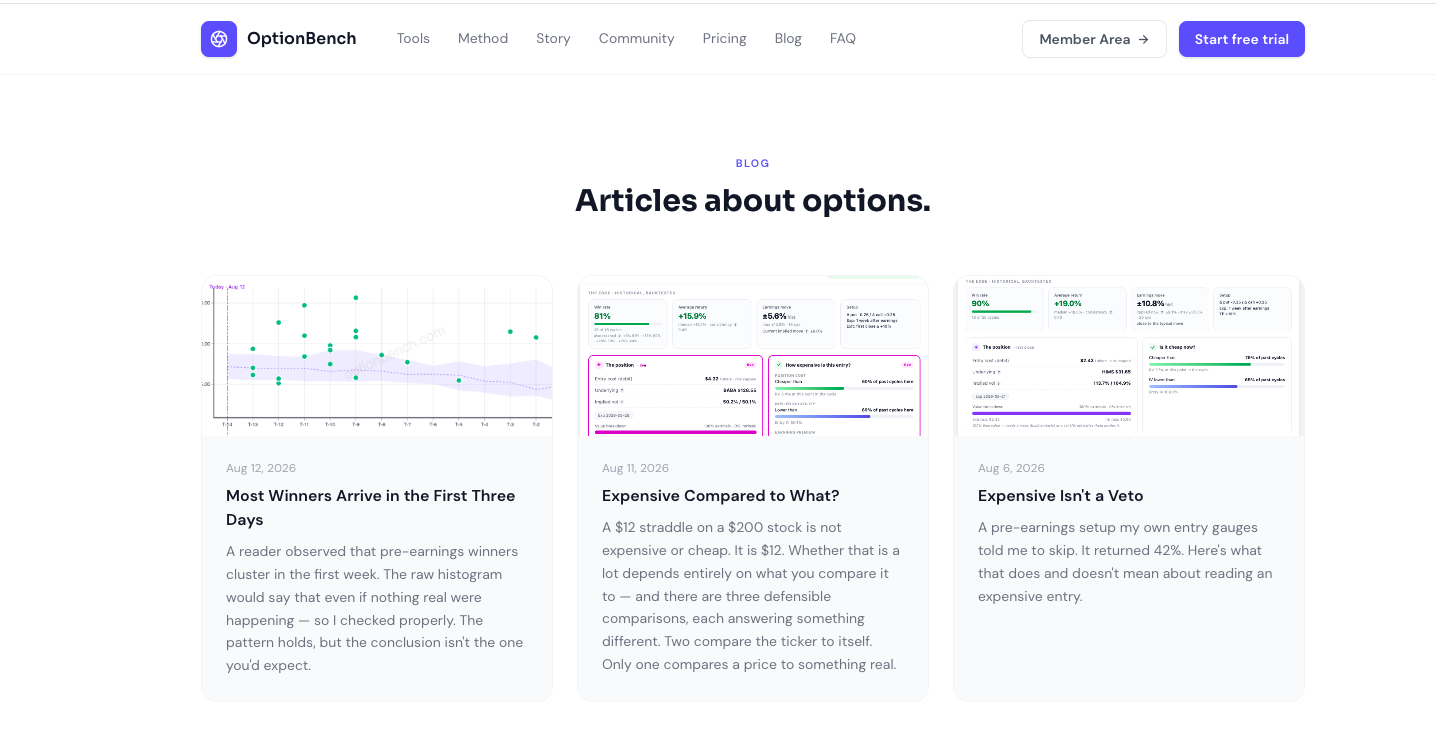
A blog, and what's in it I've added a blog to my site optionbench.com — mostly write-ups of things I had to measure while building the scanners, rather than marketing pieces. The latest one came directly out of a conversation here. Yowster noticed that on the scatter charts, most cycles reaching the P&L target do so within the first week. I ran it across all 46,717 completed backtest cycles: he's right, median day 3, 87.5% within seven sessions. But the raw count would look like that even if nothing real were happening — a cycle that hits on day 3 leaves the pool. The proper test is the hazard rate among positions still alive, and that one does decay, from 10.2% on day one to about 6% from day eight. The part I didn't expect: there's no time stop worth using. Cutting a position that hasn't worked by day seven saves 0.4 points versus holding it. The loss is already there by the time you can see it isn't working. https://optionbench.com/blog/winners-arrive-early Two earlier ones on what "expensive" means for a pre-earnings entry, and why comparing a straddle to its own history isn't the same as comparing it to what the stock actually delivers. For anyone who wants to look at the tool itself, the first seven days are free at optionbench.com. Happy to answer methodology questions here: in fact, those are the ones I enjoy Happy trading, Romuald
 1 point
 -
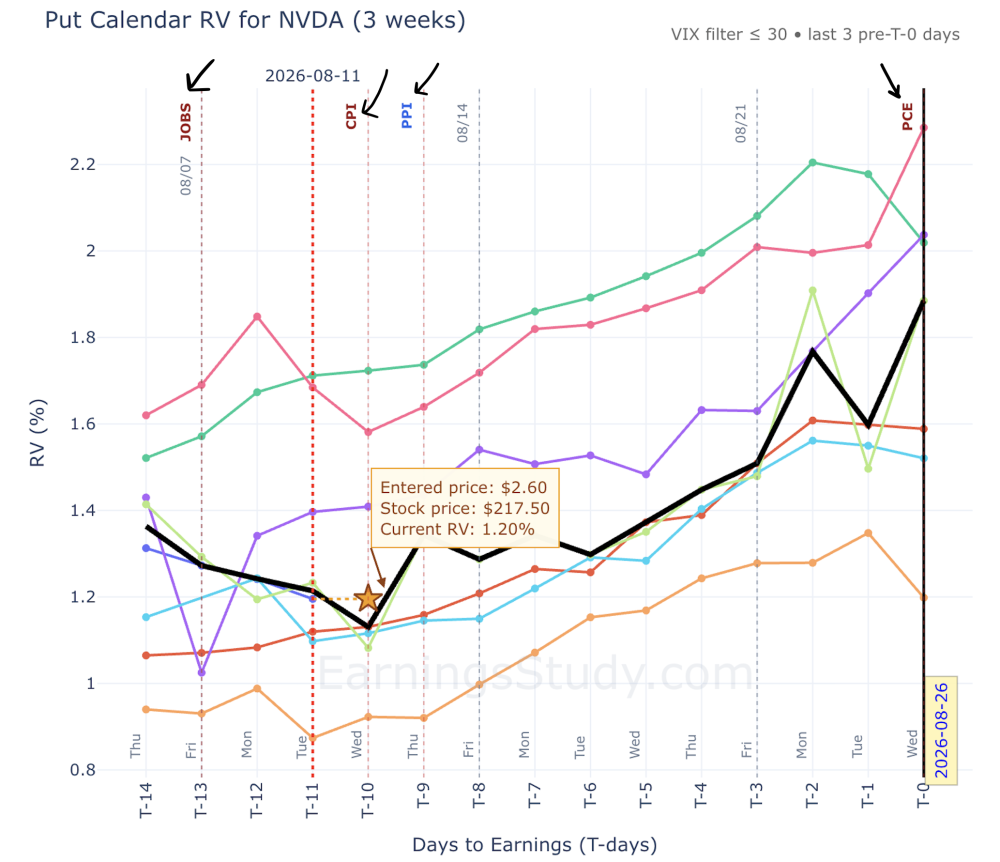
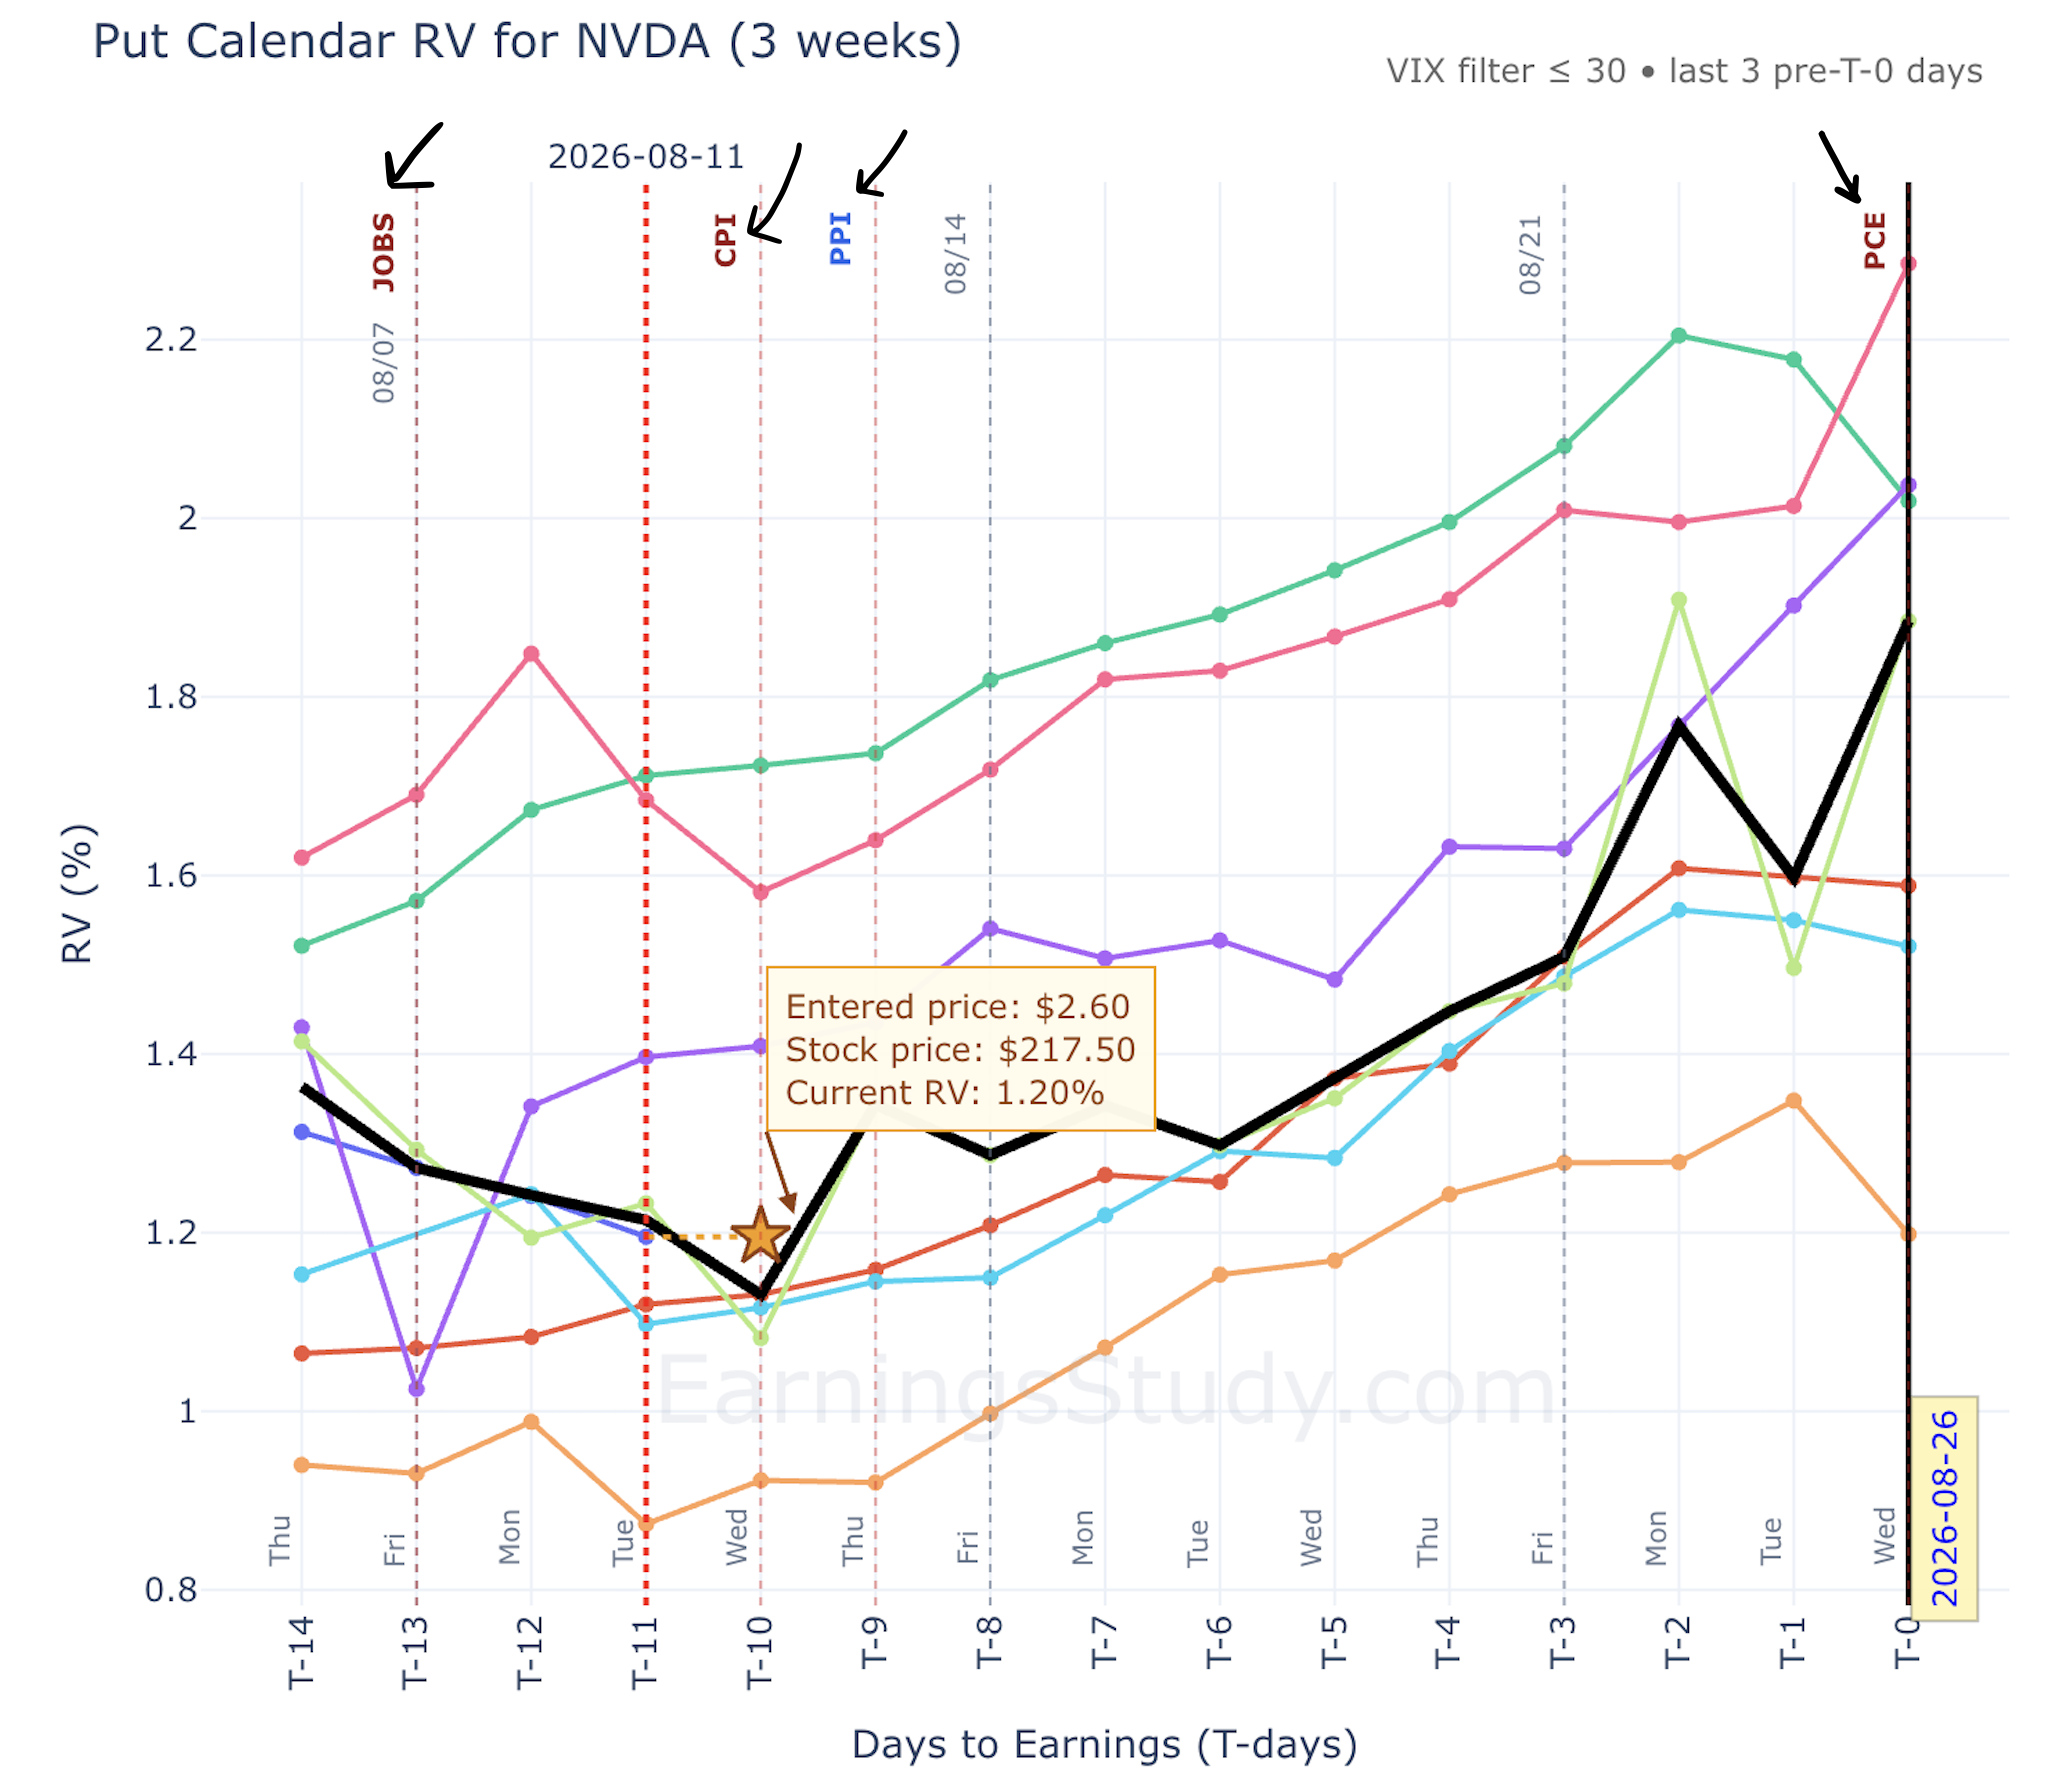
Thanks @krisbee for adding the macro events to the charts. One thing to note, and it's an obvious thing but deserves to be noted - the macro events are for this cycle only, the prior cycles have no such ties to those event on a given T-x day.1 point
-
Macro events are now drawn on the charts themselves — CPI, PPI, FOMC, JOBS, GDP, PCE Quick feature note, because this one changes how the charts read. You've had the macro events calendar next to the earnings calendar in the app for a while — FOMC, CPI, PPI, JOBS, GDP, PCE, laid out against the reporting slate. As of this week, those same events are also marked directly on the strategy charts: straddle, strangle, calendar, and long options pages all now show a marker on the exact trading day each macro event lands, both on the days already traded this cycle and on the days still ahead of the print. Why I wanted this on the chart and not just on a separate calendar page: 1. It explains the bumps you're already looking at. When the RV line kinks up mid-cycle, the first question should always be "was that earnings drift, or did CPI print that morning?" Before, answering that meant flipping between the chart and the calendar and counting days. Now the answer is sitting on the chart at the exact T-day it happened. 2. IV builds into known events — and your entry day might be one of them. Options premium tends to firm up going into a scheduled macro release and deflate after it passes. That means a position entered at T-5 the day before CPI is not the same instrument as one entered at T-5 the day after — even at the same distance from earnings. Part of what you're paying (or collecting) is macro vol, not earnings vol. Seeing the marker next to your intended entry day makes that visible before you commit, not after. 3. Event-on-event risk stops being a surprise. The screenshot below is [NVDA] — note [PCE] landing [right against T-0]. An earnings print with a major macro release stacked next to it is a different bet than a clean print: two catalysts, one position. That's exactly the kind of thing that's obvious on a chart and easy to miss on a list. 4. The days ahead are marked too, not just history. The chart shows the remaining trading days into the print with upcoming events already flagged — so if you're planning an entry at [T-x] and there's a [FOMC] marker two days before it, you can decide on purpose whether you want to be positioned through that release or enter after the dust settles. Usual caveat, because I'd rather over-say it: these markers are context, not signals. Nothing about a CPI flag tells you which way vol resolves. What it does is make sure that when you're reading a median path across [N] historical cycles, you know which of those days were carrying a second event — and whether your planned path is carrying one now. This came out of my own annoyance flipping between pages during CPI week — if there's an event type you'd want added, or you'd rather be able to toggle the markers off, say so here. That's how most of these features get built.
 1 point
 -
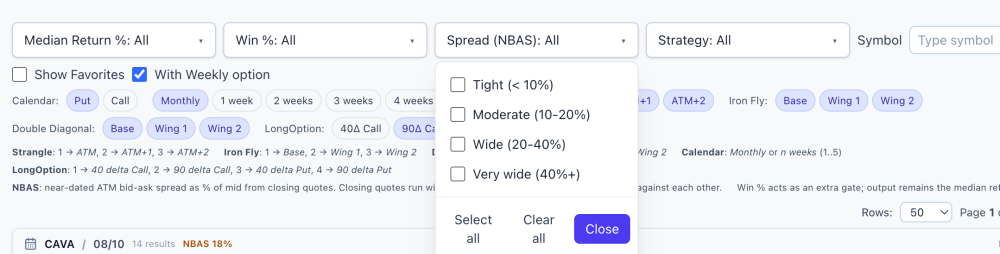
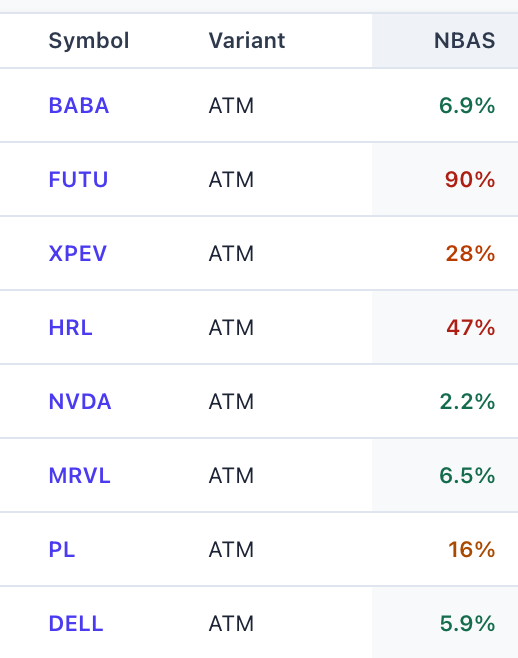
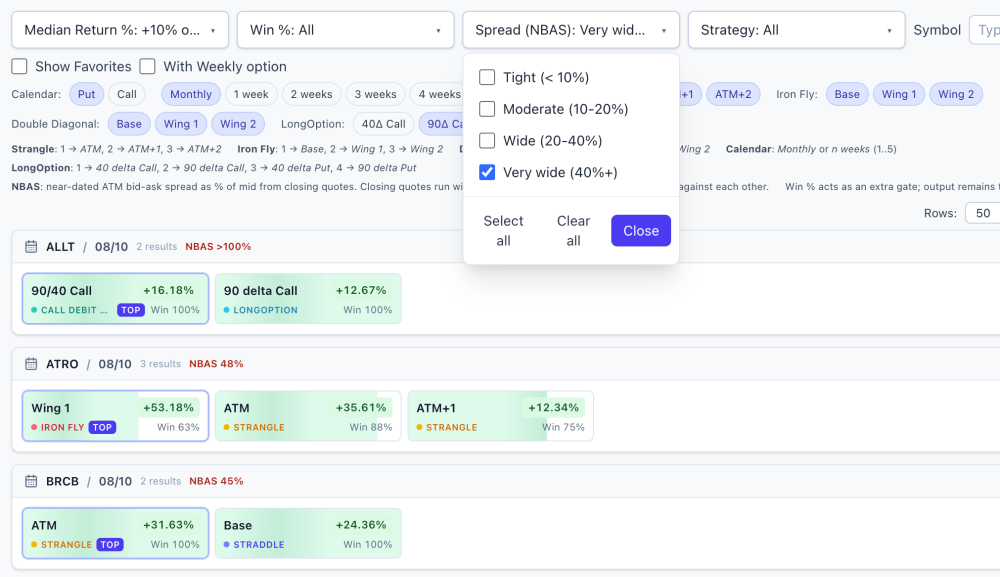
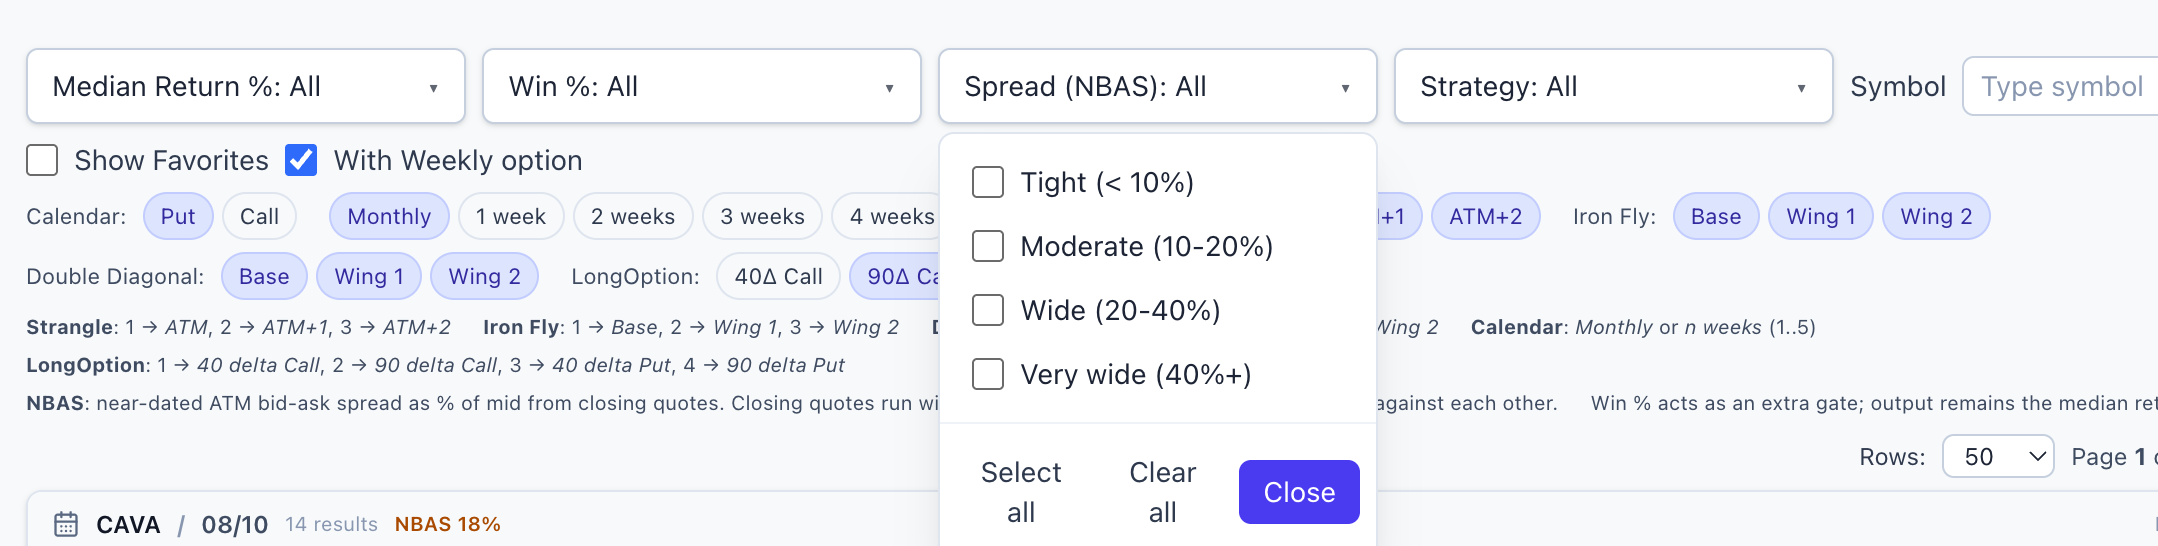
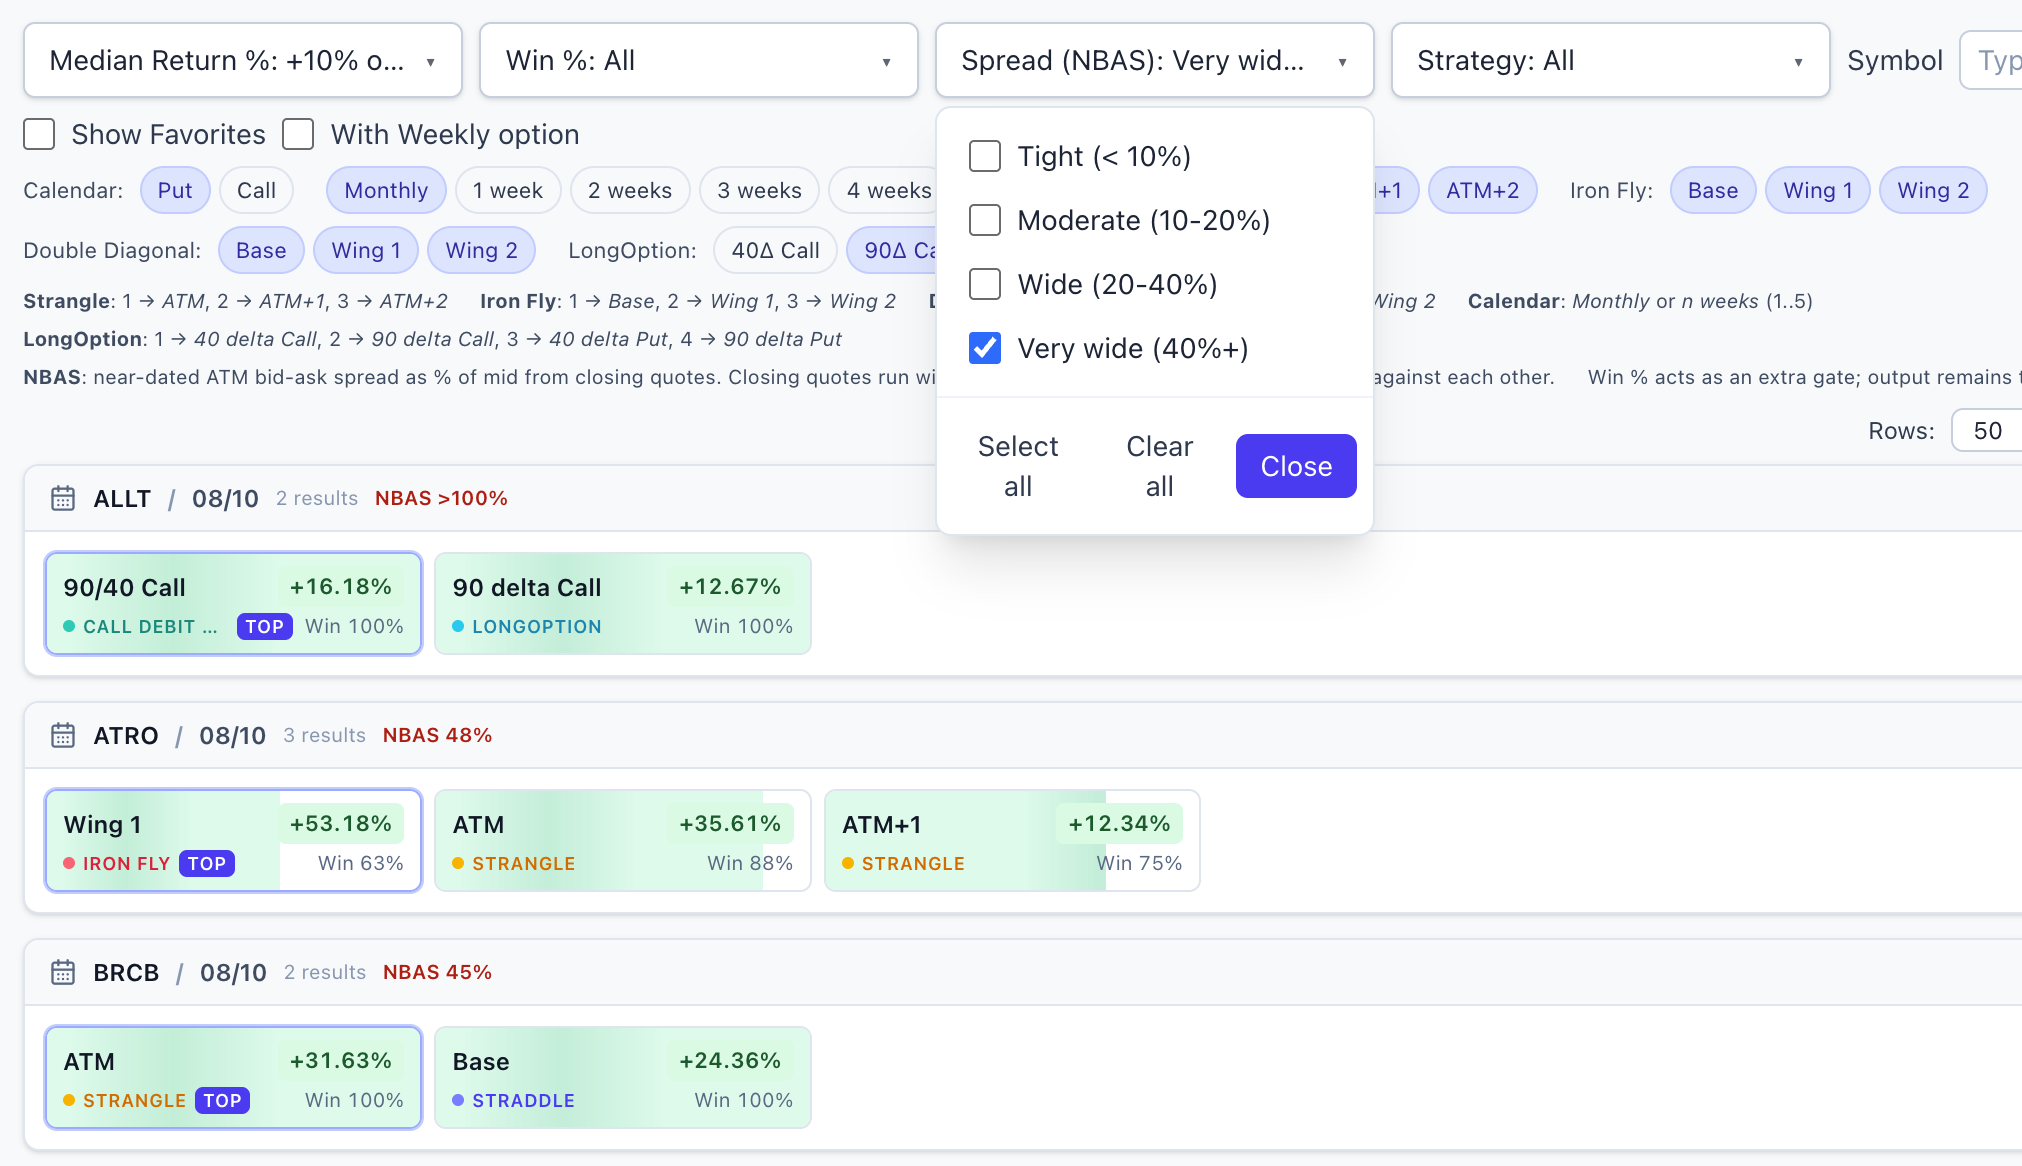
New on the Daily Screener: a liquidity check on every setup @FrankTheTank recently asked me a question that's harder to answer than it sounds: "How many of these setups could I actually get filled on?" It's the right question. A screener can show you a beautiful historical edge — high win rate, strong median return — on a name whose options trade so wide that the edge exists only on paper. The backtest gets a clean theoretical price; you get the spread. Wide bid-ask markets are how a good-looking backtest quietly becomes a bad live trade, and most tools simply don't warn you. So now the screener does. Every symbol on the Daily Screener carries an NBAS value — a normalized measure of how wide its options markets are, derived from the same market data the historical numbers are built on. Lower = tighter markets = the numbers on your screen are closer to something you can actually have. You don't need to know anything about how it's computed to use it: it's color-coded right in the table — green is tight, amber and orange are questionable, red is wide, and a "—" means the name had no measurable liquid options at all, which is its own answer. How to use it Next to the Return and Win % filters there's a new Spread (NBAS) dropdown. Select the tightest bucket and the board shrinks to names where the market is liquid enough that the historical numbers deserve your attention. When a spread filter is active, unknown-liquidity names are excluded too — if liquidity can't be measured, that's a caution flag, not a free pass. The honest part Building this taught me something I wasn't fully expecting, and I'd rather tell you than have you discover it the hard way: once you screen for liquidity honestly, a lot of the board falls away. Far more names than you'd guess carry markets too wide to trade well — including some with genuinely impressive historical stats. That's not a flaw in the backtests; it's the difference between an edge that existed in the data and an edge you can collect. This column exists to keep those two things from being confused. Two caveats so nobody over-reads the number: It's a relative ranking, not a fill forecast. The measurement comes from end-of-day data, and closing markets run wider than what you'll typically see intraday on liquid names. Use it to compare names against each other and against the backtest's own pricing basis — not as a prediction of your fill cost tomorrow morning. A tight spread is a prerequisite, not a signal. Green doesn't make a setup good — it just means the market will let you have it near a fair price. It filters out false edges; it doesn't create real ones. Before shipping, the values were cross-checked against independent live quotes on several names and lined up well. The number measures what it claims to measure. That screenshot is the whole reason this feature exists: a setup with strong historical stats that you should almost certainly never touch, because the market for it barely exists. Before this column, that row looked identical to a real opportunity. My updated morning routine Open the Daily Screener → set the Spread filter to the tightest bucket → then start reading win rates and medians. Liquidity first, edge second. An edge you can't collect isn't an edge, so there's no point evaluating it. This feature shipped because someone here asked for it — which is how most of the platform gets built. Curious about the methodology details? They're documented inside the app for members. And if there's a number you wish the screener showed, or a question you keep answering by hand, say so here or DM me. The fastest way to get a feature is to complain about its absence. Thanks to @FrankTheTank @Bhavan1986 for sparking the idea & and to my teammates @Kim @Yowster @TrustyJules for helping shape the app! How to access it Already using EarningsStudy? The Daily Screener is now in your sidebar — just sign in and open it. Not signed up yet? Register at https://earningsstudy.com/ with the same email you use on SteadyOptions, and you'll have it alongside the rest of the core platform. This is exactly the kind of thing we set out to do with this partnership: take the tools that were once behind an extra tier and put them in the hands of the whole community. More to come. — The SteadyOptions Team SO members on the ALL bundle: full core access to EarningsStudy is free through the partnership. Everything above is historical/educational analysis, not a trade recommendation or financial advice. Options trading involves substantial risk. Liquidity measurements are from end-of-day data and will differ from intraday markets.
 1 point
 -
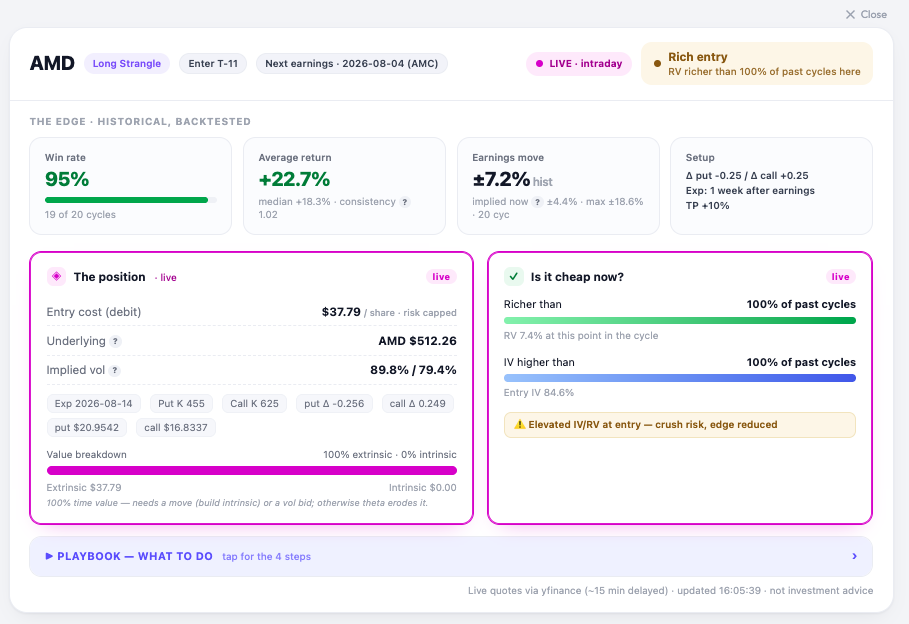
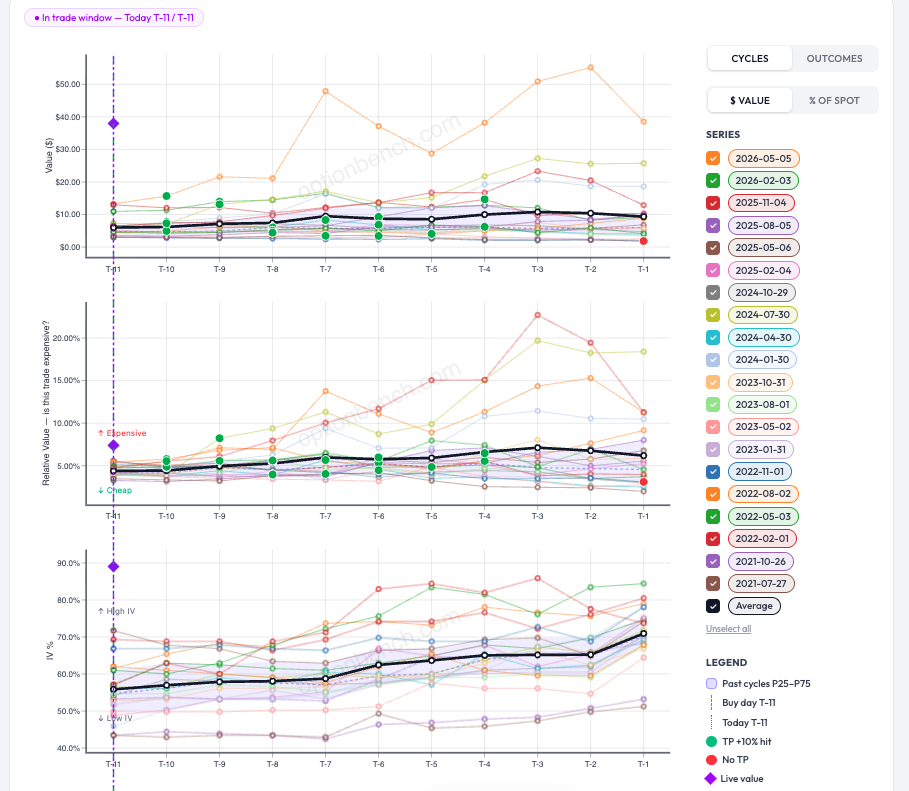
Update — at the open Markets opened, and here's AMD live: the strangle re-priced from $38.69 to $37.79, AMD gapped up to $512, and entry IV eased from ~87% to 84.6%. Marginally cheaper — but the verdict didn't budge: still "Rich entry," still richer than 100% of past cycles, still flagged for crush risk. On the charts, the live-value diamonds sit at the very top of every panel — value, relative value, and IV. Translation: the setup got a little bit cheaper, not cheap. It never dropped into its normal P25–P75 band, so the disciplined read is unchanged. Personnally I would pass, and let the backtest stay a backtest for this cycle. That's the tool doing its job: a 95% historical win rate is only worth having if you don't overpay to get in, from my POV. Romuald - OptionBench
 1 point
This leaderboard is set to New York/GMT-04:00