Leaderboard


Popular Content
Showing content with the highest reputation on 06/30/26 in all areas
-
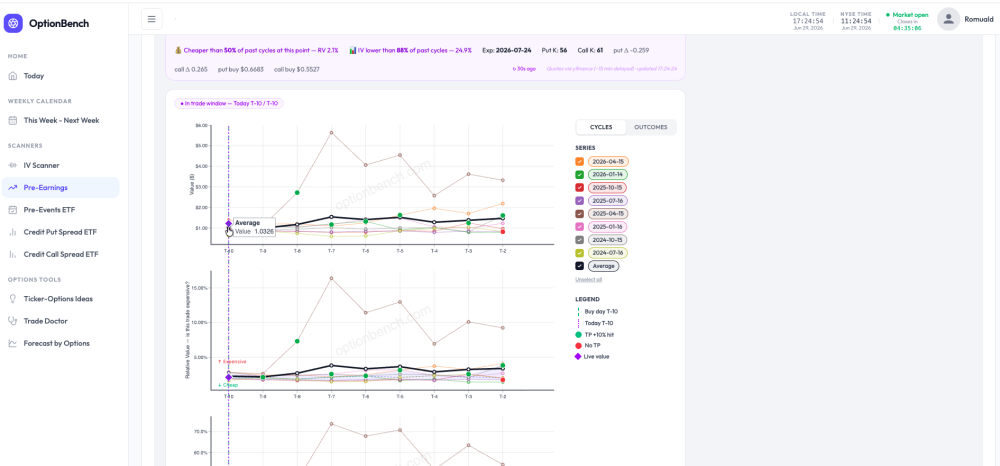
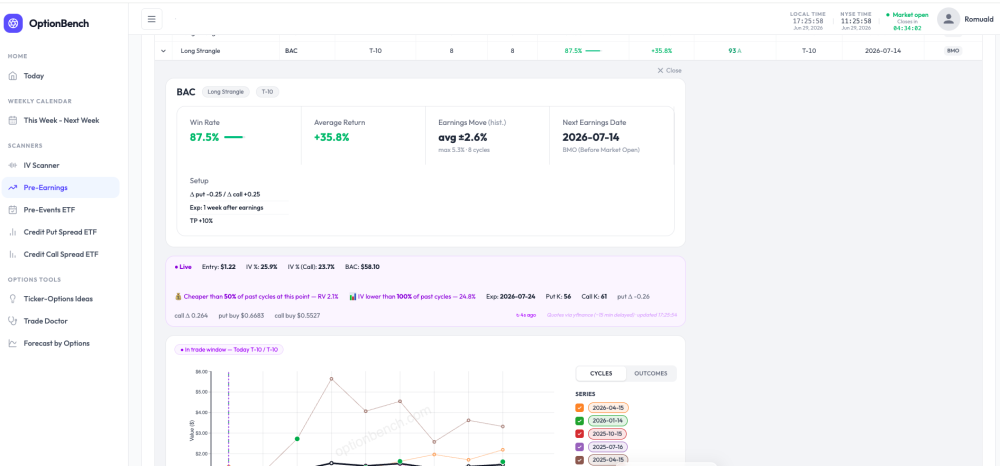
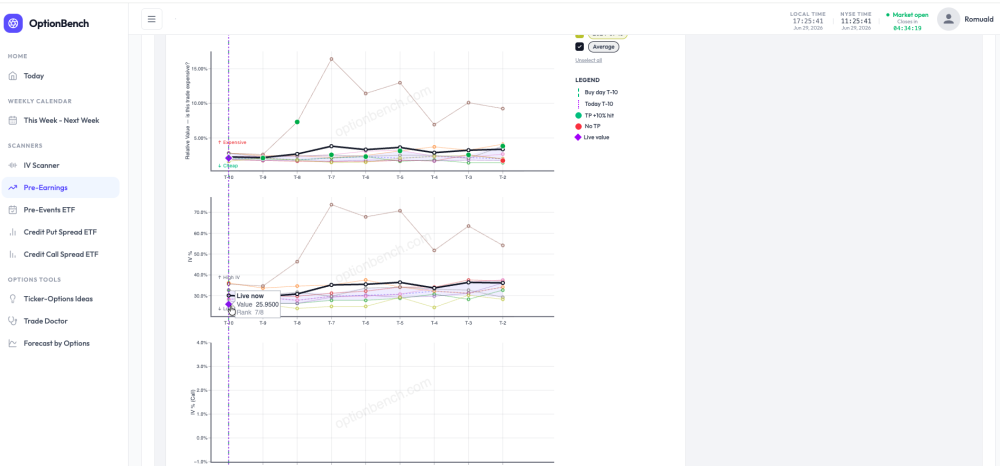
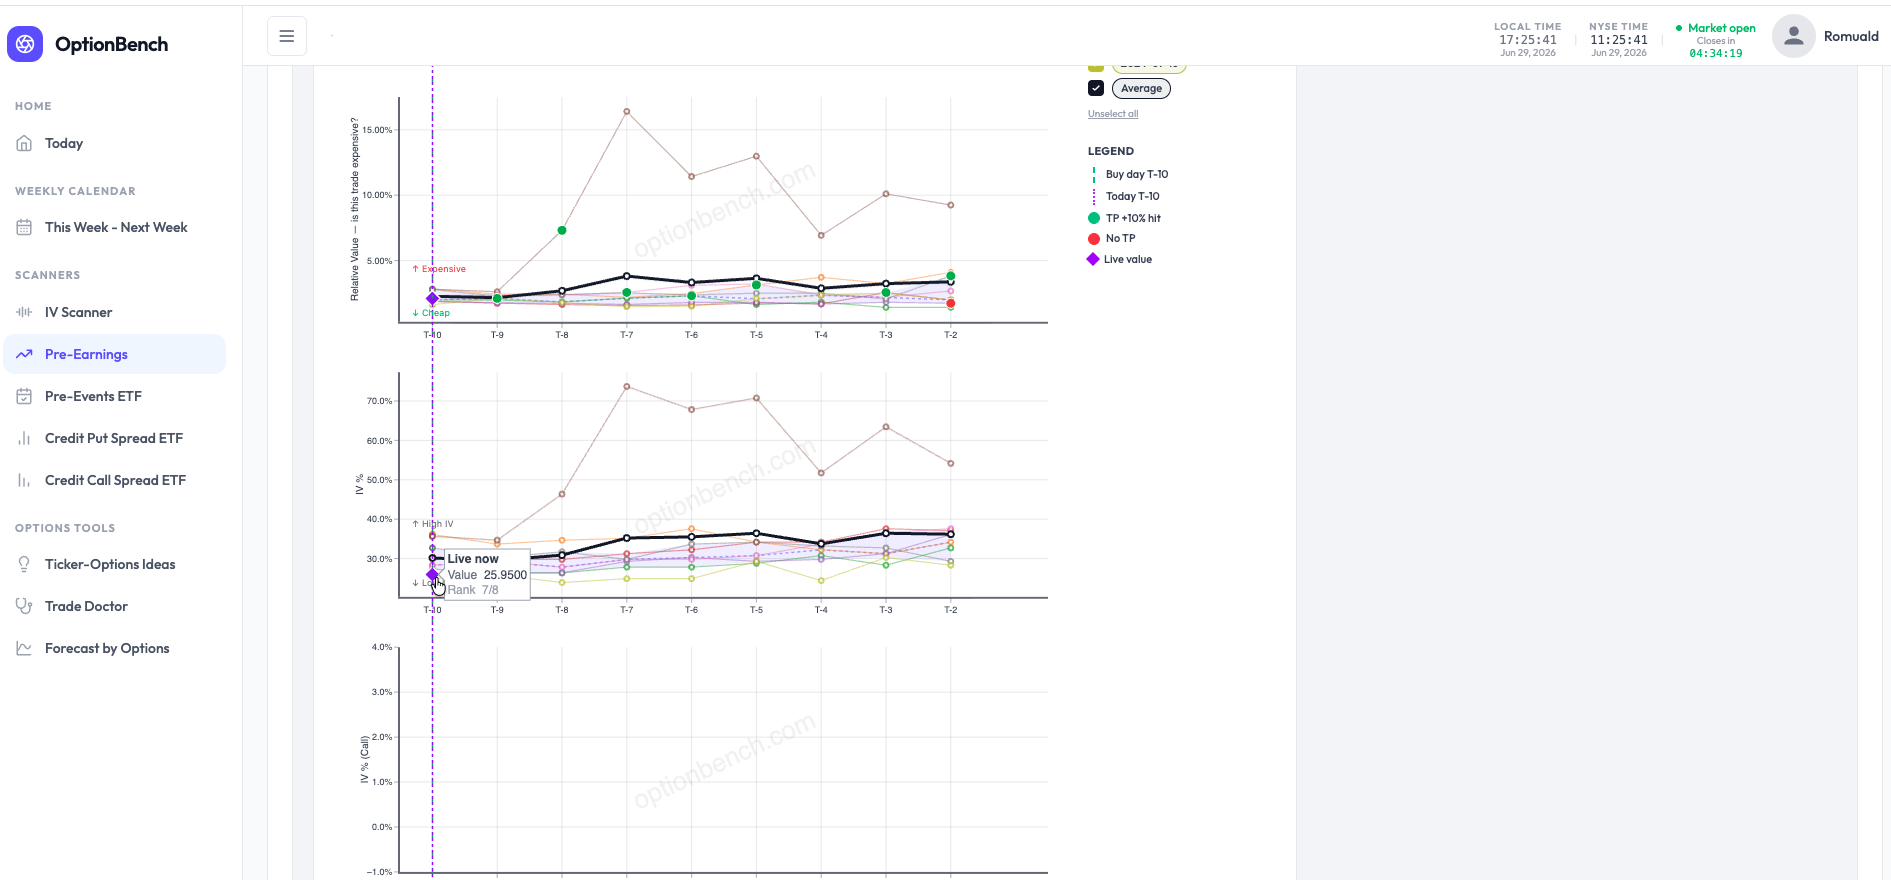
Building OptionBench with you, not just for you What three weeks of beta feedback changed When we opened the OptionBench beta a few weeks ago, the plan was simple: put the tool in front of real options traders and listen. Sixteen of you took us up on it. A handful have been relentless — sending detailed questions, catching things we missed, pushing back when something didn't add up. This post is a thank you to those of you who've been active, and a look at what your feedback actually changed. Because it changed quite a lot. The thread running through all of it is one idea: put yourself in the trader's seat. Not "here is some data" — but "here is what you need to see, at the moment you're deciding whether to take this trade." You questioned the live values — so we built entry context One of you noticed that the live value of a position on the chart didn't line up cleanly with the historical cycles plotted next to it. A small thing on the surface. But it pointed at a bigger gap: the chart showed you where past cycles went, but not where you stand right now relative to them. So we added it. When the market is open and you're inside the entry window, the live banner now tells you exactly how today's entry ranks against every past cycle at the same point in time: 💰 Cheaper than 50% of past cycles at this point — RV 2.1% 📊 IV lower than 88% of past cycles — 24.9% Hover the live marker on any sub-plot and you'll see its rank there too — Rank 2/8, 5/8, whatever it is — so you can tell at a glance whether you're getting in cheap, average, or rich versus the stock's own history. This is the part we're most happy with, because it's exactly what experienced traders already do by eye when they read a relative-value chart. We just made it explicit, and put a number on it. You asked how much the stock actually moves — so we measured it A recurring question: how much does this name typically move on earnings? It's the first thing you want to know before buying a straddle or a strangle into a report. We now compute the realized earnings move directly from each stock's history — the average and maximum one-day move of the underlying on its past earnings reactions, properly aligned to whether the company reports before the open or after the close. We cross-checked the numbers against two other websites on several names and they line up. It's shown as a plain historical fact — this is how the stock has moved — not a prediction. What you do with it is your call. You read the RV chart by eye — so we drew the distribution If you trade calendars or volatility setups on SteadyOptions, you already live in relative-value charts. The usual approach is to eyeball the average line and ask "am I above or below it?" That works, but it hides something: a single average line tells you nothing about how spread out the past cycles were. Being "below average" means very different things depending on whether the cycles were tightly clustered or all over the place. So each RV and IV sub-plot now shows the dispersion band — the middle 50% of past cycles (25th to 75th percentile) plus the median — at every point before the event: Now "cheap" isn't a guess. You can see the full range the stock has traded in at this point in its cycle, and exactly where today sits inside it. The common thread None of these are flashy. They won't promise you an edge or a win rate. What they do is the same quiet thing: make visible, at the moment you decide, what you used to have to estimate in your head. Where does today's entry rank against history? How much does this stock really move? How wide is the range I'm trading inside? Those are the questions a careful trader asks anyway. We're just trying to answer them on the same screen, while it still matters. That's what "putting ourselves in the trader's seat" means to us — and honestly, we've only been able to get close to it because you've been telling us, in detail, where we were getting it wrong. Keep it coming The beta is free until 31st of July, and the feedback loop is the whole point. If something looks off, if a number doesn't match what you expect, if there's a question the tool should answer but doesn't — tell us. The most useful changes so far have all started as a message from one of you. Thank you for building this with us. Romuald & The OptionBench team
 1 point


This leaderboard is set to New York/GMT-04:00