Leaderboard


Popular Content
Showing content with the highest reputation on 06/15/24 in all areas
-
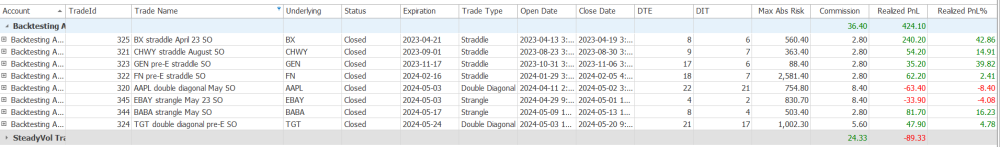
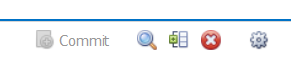
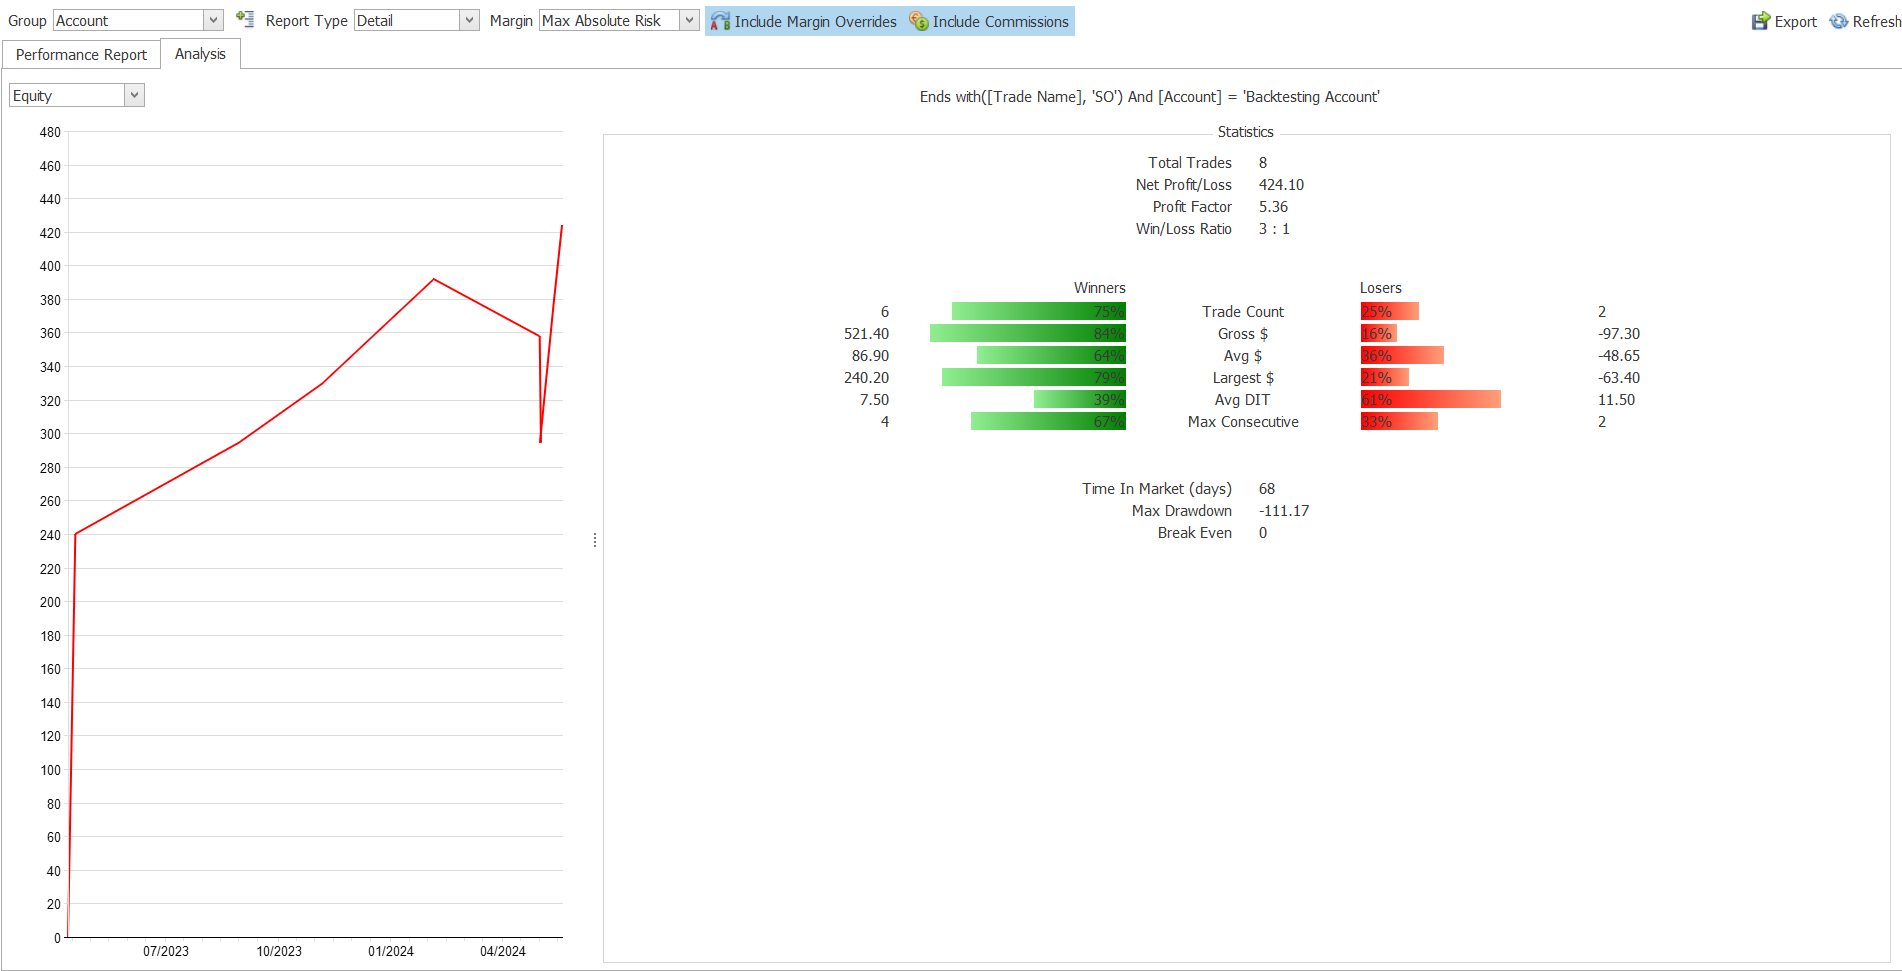
@Romuald regarding the performance plot here is one method I use to only report on certain trades ... for example I have backtesting account that I use to look at old trades to see how they worked out throughout the length of the trade .... I have attached a report I have to only show SO trades I have backtested ... you will see that I have ended the trade names with SO .... it hard to see but in the Trade Name column header there is a small upside down triangle which if clicked on opens up a window to filter report to only include certain trades .... there are quite a few filter options available and you can filter any or all columns ...once you set up a report to show only the trades you wanrt you can click on the Analysis tab to see the performance of the selected trade group
 1 point
 -
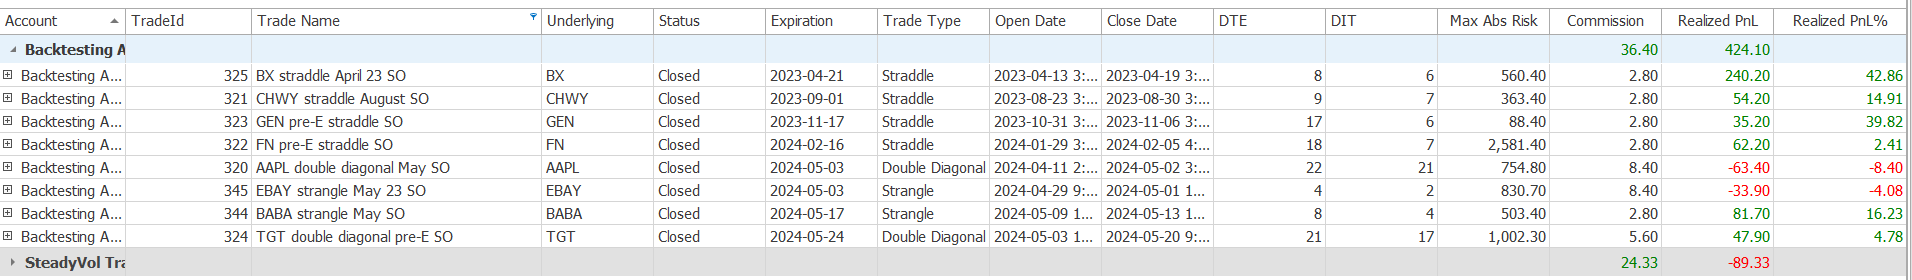
@Romuald I have been using ONE for about a year after OV shut down and fairly comfortable in using it ...... brand new SO member and I have "backtested" a few previous real trades to get a feel of they work as price, time and IV change throughout the length of a trade .... one comment and one answer for you you can close a trade with one click of the "grid" icon between the red X icon and the magnifying glass icon as shown below ... this will insert an entry in the model column offsetting the positions you have ... follow that up with clicking on the Commit icon and the closing trade is entered this statement is clipped for the ONE online manual the daily movement of the Position's overall value as the Underlying vehicles price fluctuates over the current trading day - shown by the scattering of green dots (which are based on actual intra-day prices throughout the trading session) - shows that there is a considerable amount of movement on a daily basis. in the case of a risk chart for a backtest I believe the dots are a scatter plot of trade's mid price at 5 min intervals throughout the day .... you will also see red dots in some cases ... the green dots are prices at which trade is positive and red dots are prices at which the trade is negative ... you will also see a slightly larger light blue dot and that is the price at the moment in time you are at as you step through the backtest hope this helps
 1 point

This leaderboard is set to New York/GMT-04:00