Leaderboard


Popular Content
Showing content with the highest reputation on 09/29/20 in all areas
-
@shipdriver I won't repeat everything that others mentioned earlier. I will just say that evaluating a service based on 2 months of experience is really not fair and not representative, especially for a service like SO. Especially considering the fact that those 2 months had returns significantly below historical our historical averages. And honestly, I now understand why many services have only yearly terms. Maybe this is what we need to do as well. Also, I'm sorry to say that, but those who "can't sustain ongoing losses" probably should not be in this business, and fees have nothing to do with the returns. You can pay hundreds of dollars per months for different tools (like ONE, cmlviz etc) and still lose money. As for your comparison to directional strategies (stocks or options), this is really not apples to apples comparison. I hear those comparisons all the time, but they always come after big market rallies, never after big market declines.. Most major indexes are up 35-40% since April, so it's not surprising that your long equity portfolio is up 45% since April. How this portfolio performs during market meltdowns is a more relevant question? How does it perform during periods of sideways markets? Like 2015 when the markets were flat and our model portfolio produced 200% return? Looking at returns alone is meaningless without considering the risk. P.S. This is taken from one of the options trading mentoring programs website: Plan on at least six to twelve months of paper trading and live trading to get to break even. Once you are not losing money, you can slowly start scaling your trading size up. Your doctor, attorney or pilot all started by hitting the books and then getting instruction from a current and qualified professional to teach them their trade. It is no different with option trading. It's a complicated skill set that needs a good amount of understanding before you start trading live. I guess I'm not the only one advocating this approach. btw, most mentoring programs are priced around $5-6k (5 years worth of SO membership). Usually people don't expect to get back their fee during their first year with the program, but for some reason they expect to get their SO fee back during their first few months..1 point
-
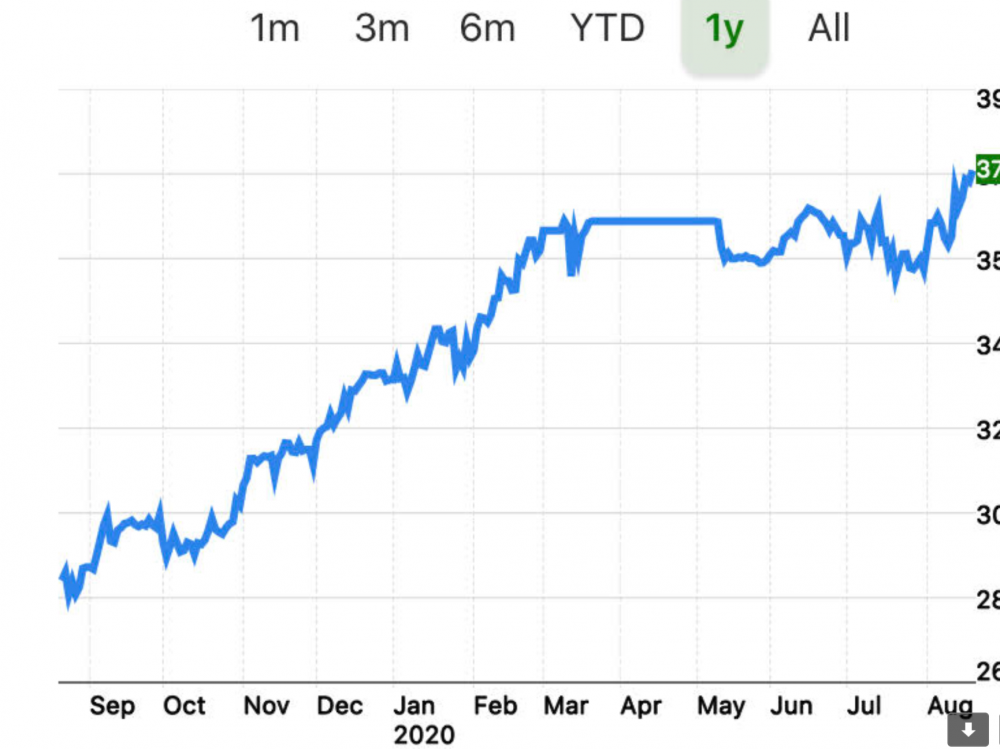
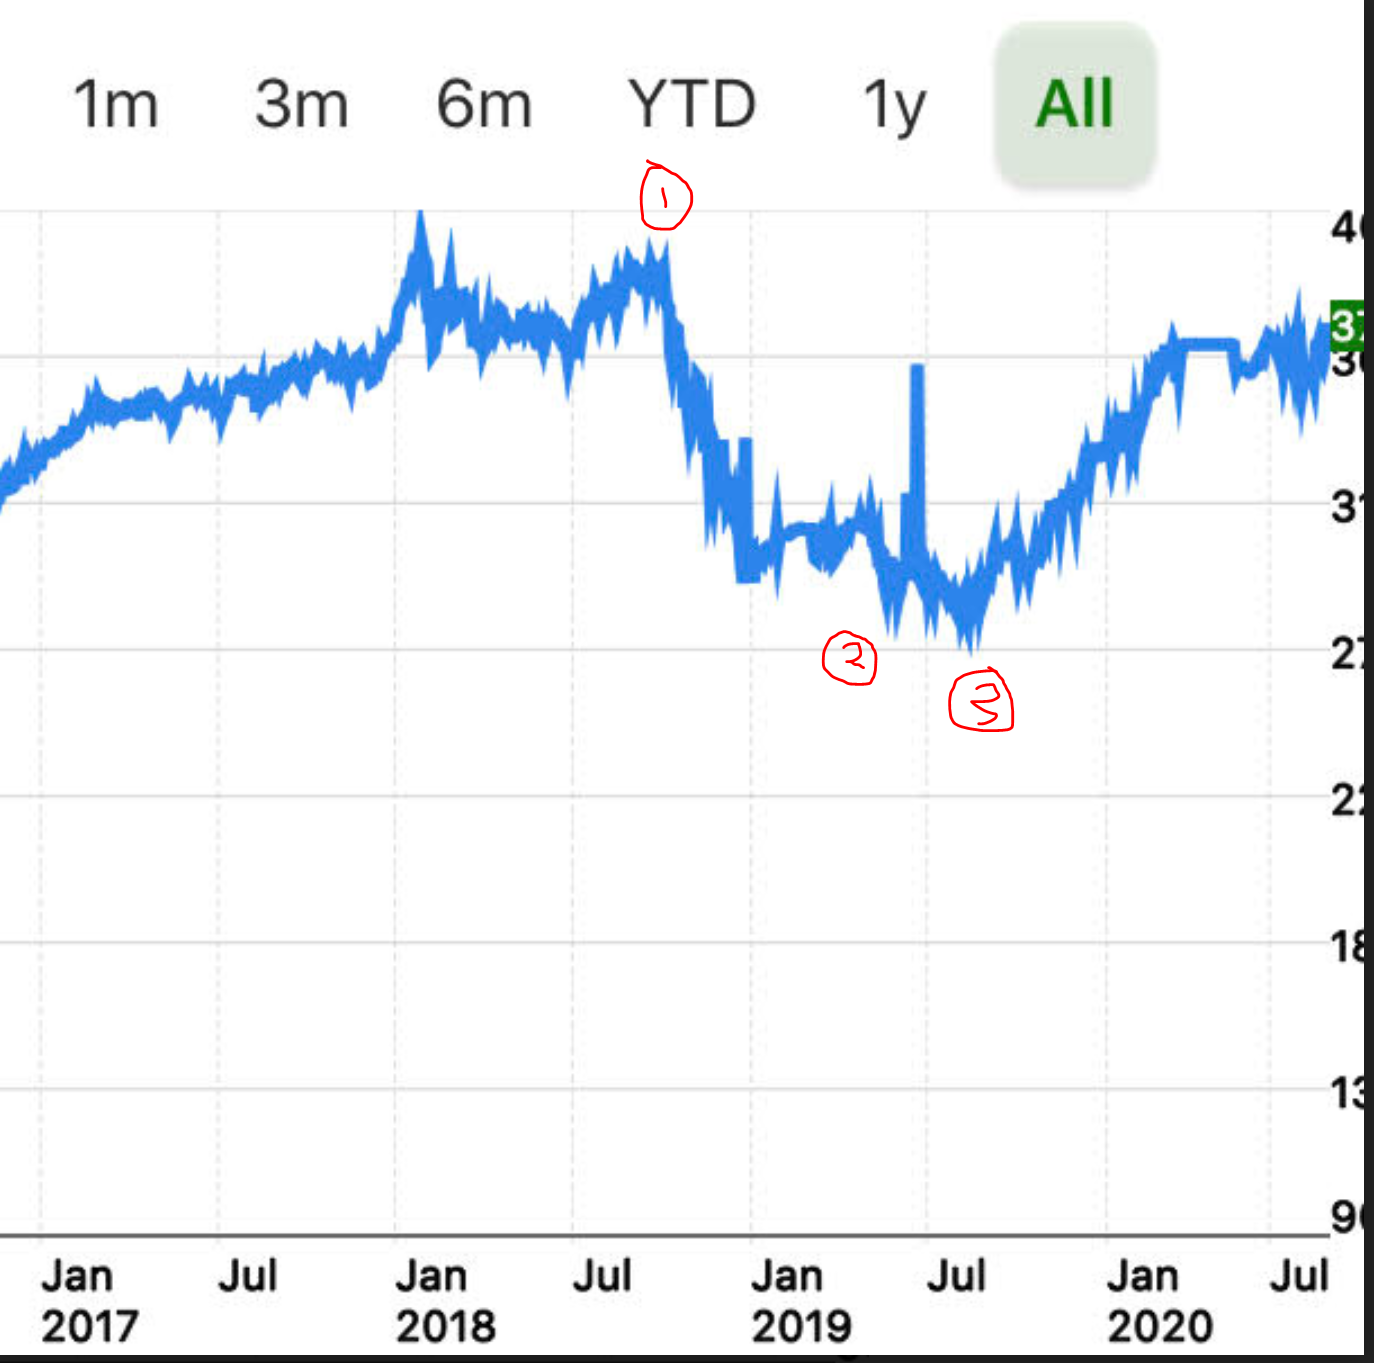
I dont think I should be listed with those guys but I am glad to be pinged on this topic because I have something I wanted to share that is relevant here. I finally figured out how to find an equity curve in my TD Ameritrade Account (can only do it on mobile for some reason). @yalgaar this should be interesting for you because I was in your shoes about 18 months ago and saying the same thing (but just quietly to myself). With reference to the equity chart below (this is mostly earnings and SO trades, I also have an account at RH and two other TD Ameritrade accounts but this one is a good example of my journey) Point (1) I joined SO in the summer of 2018 and had a string of really bad trades (many were my fault, chasing losing trades, over trading, etc.). I just could not make it work. We also had some big 100% losses, HD and GS come to mind, plus a few others where I had on large positions. If I remember correctly this was a rough patch for SO and I joined at the peak and gave up near the bottom. Point (2) I quit SO for the first time somewhere around there, convinced myself it did not work. Between point (2) and (3) I tried a bunch of other options services and continued to lose money. I started to take it more seriously. I turned off my computer, read a bunch of options books, academic papers, and started to really think deeply about options, the greeks, what works, what doesnt work, and tried to figure out why. I kept coming back to SO and earnings trades. It was like an itch I could not quite scratch or figure out in my brain. In my opinion the IV rise before earnings is a consistent edge that we can take advantage of as retail traders. I know the results Kim and Yowster got were real (we can see their trade logs) so I started thinking really hard about that and how to exploit it. I found some of Kim's old articles on Seeking Alpha which laid it all out very clearly about getting your straddles for "nearly free" or something like that and it started to click for me and the light bulbs started going off. Point (3) I started gathering data and doing my own research, largely based on the past work here at SO. I started making my own spreadsheets to track RV (Excel linked to TOS with RTD). I paid for a subscription to ONE and started backtesting as many earnings trades as I could and visualizing how rising IV can push around your T+X lines. I started trading long straddles and calendars on my own. After the first earnings season doing this on my own I had about a 30% return on my account during that earnings period with very little risk/drawdown. Then 2020 hit and I missed out on an entire earnings season and made some bad VXX and VIX type trades. I had a bit of a rough patch the past few 6 weeks or so (took a lot of large losses on some of my own NEHS trades and other speculative plays). But, here is the interesting thing, almost all of my earnings trades have been profitable. Although the equity curve looks jumpy the past few weeks its because I have a lot of non-liquid calendars open where the pnl jumps around a lot at close. My guess is that my equity curve will be close to a new all time high within the next week or two as some of my calendars are starting to turn profitable and RV is moving in my favor. If I did not do any of those NEHS trades and VXX trades it would probably be back at the highs based on earnings trades. So this is not "easy" by any means and I am not even sure if I have this figured out but I can tell you the underlying concepts and principles taught here work and make sense. Blindly following the alerts is not great in my opinion and I wish there was a way to split the group out for those of us that dont even want to follow the alerts (I would bet most of the successful people here do not follow every alert and are in the trades before Yowster even posts them). So if you want an alert service that is "set and forget" I would just quit now and I don't know of any such alert service. If you want to collaborate and learn with a group of really good traders and smart people I think this place is worth the money. Edit/Update - I did not mean to scare people with that equity curve above. If you compare my results back in 2019 to the SO trades you will see I was not following the rules or official trades very closely. Some of my biggest trades were HD and GS calendars which were both assigned to me and 100% losses which was very rare for these type of trades and SO no longer trades calendars that way with the shorts expiring before earnings. Here is my 1 year equity curve which is mostly earnings trades plus some bad VXX and VIX trades I made recently. Even with those losses I am up close to 36% year to date and we still have one more earnings quarter left. I am not posting this to brag as I suspect people here have returns that are double or triple this, rather, to show that earnings trades can work.

 1 point

This leaderboard is set to New York/GMT-04:00