Leaderboard


Popular Content
Showing content with the highest reputation on 08/01/18 in all areas
-
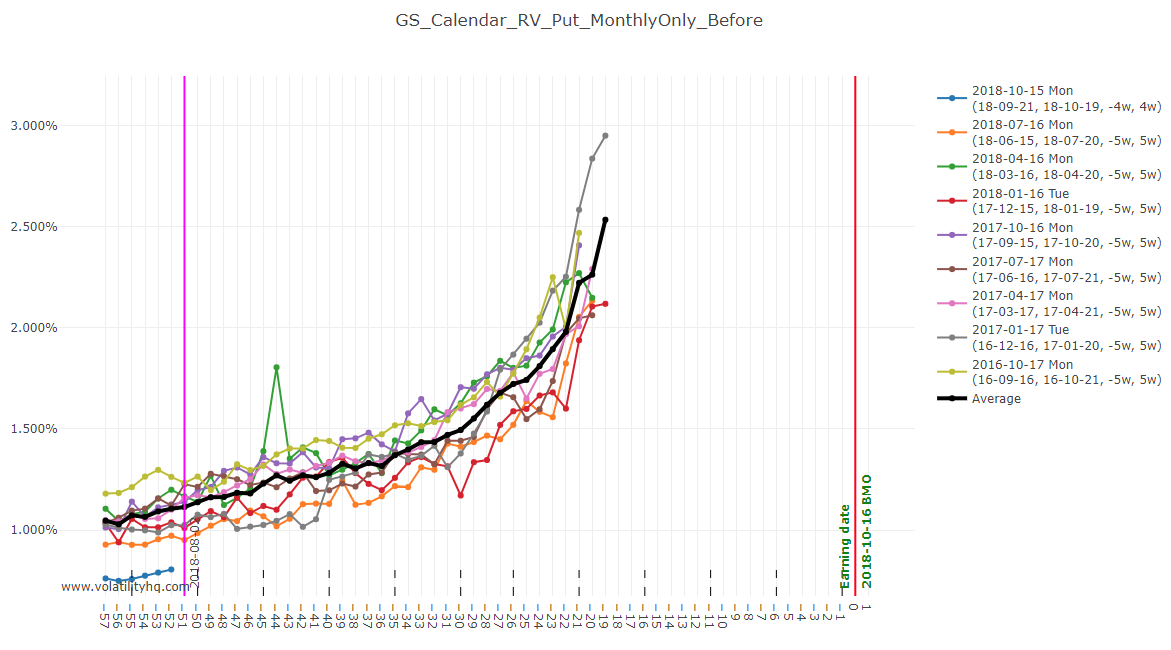
I just added a new option on the Calendar RV page to support a 'pre-pre earnings' calendar. The short leg expires before the earnings date. That feature is in beta for now as i have not done extensive testing yet, and is slower than the rest of the functionalities because i have not implemented that much caching. Note that if you select the option to have the short leg before earnings, then you also need to select to use ONLY monthly options. Here is an example :
 2 points
 -
@Djtux a belated THANK YOU for these new enhancements. I like taking out the outlier high and/or low RV on the Calendar graphs. Brilliant!2 points
-
Some people like to double check the chart from https://www.volatilityhq.com/backtester/straddle_table/ to see if the previous cycles were high or not. I display in the RV chart the 1d average move because i see it like the relationship between historical volatility and implied volatility. The 1d move after earning is related somewhat to the implied move priced in the straddle the day before earning. Can you always make a decision based on the level of the RV and the 1d average move ? Not always, it's like HV and IV. That's my interpretation as least.2 points
-
Super cool, definitely got me to sign up!1 point
-
@NikTam Look at https://steadyoptions.com/forums/forum/topic/4666-discussion-gs-october-2018-trade/?do=findComment&comment=105877 for the start of the discussion of the 'pre-pre earnings' calendar. The short leg is the monthly expiry before earnings, not after earnings. @cuegis I'm working on that, i should have some prototype ready on the production website tonight. It won't be the fastest for now (page might load slower than the rest, there won't be caching like the rest of the website, but it's just to get something out there). Noted, i think it makes sense. Maybe i could show it in 2 spots : In the RV chart, when you hover a data point, i can show both the straddle/calendar price and the VIX I can also add a new chart to the Straddle RV page and the Calendar RV page. The new chart will be called VIX, and for each cycle i will show the VIX That way you can do a spot check on the VIX chart, and then drill down on the hover if needed. It's a start until we find a better way to represent that.1 point
-
@Djtux Now that market vol is jumping around quite a bit, I'm thinking it may be beneficial to show the VIX value for dates on the RV chart. When I see something with elevated RV, I find myself looking at a VIX chart for that day to see what its value was. This wasn't an issue last year because the VIX was so flat for so long, but now we are starting to see multiple periods with elevated VIX, and that can certainly factor into straddle RV. I'm not sure how best to incorporate it, perhaps when you hover over a data point its one of the things that gets displayed? Something for the wish list, as it would be a time saver.1 point
-
@poseidolginko, done. Let me know if you find more (are again on holiday this week, so might take a day or so)1 point
-
I agree. Very useful, highly appreciated.1 point
-
The strangle credit is a % of the straddle price. It's around 5.5% by default to take into account that you will close the strangle for a small price. And it's the %credit per straddle. For example : https://steadyoptions.com/forums/forum/topic/4671-trades-wmt-august-2018-hedged-straddle/ There are 3 straddles at 4.06 and 1 strangle at 0.87. (0.87/3)/4.06=7.14% You receive 7.1% of credit from the strangle per unit of straddle. So the adjusted RV displayed in the RV chart in the horizontal line is the last available RV (typically yesterday) from which i remove the strangle credit in %.1 point
-
Just added 5 week calendars to art-of.trading. I by the way also increased the time range of the charts. Let me know in case you find unplausible data.1 point


This leaderboard is set to New York/GMT-04:00