Leaderboard


Popular Content
Showing content with the highest reputation on 09/18/17 in all areas
-
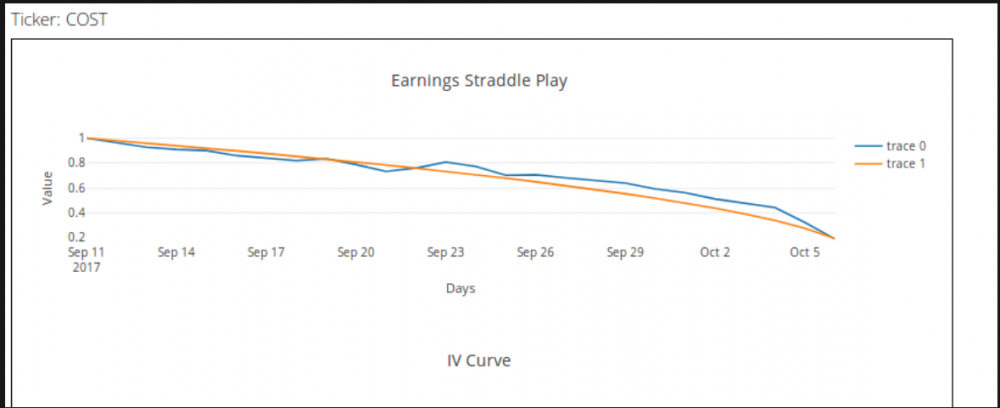
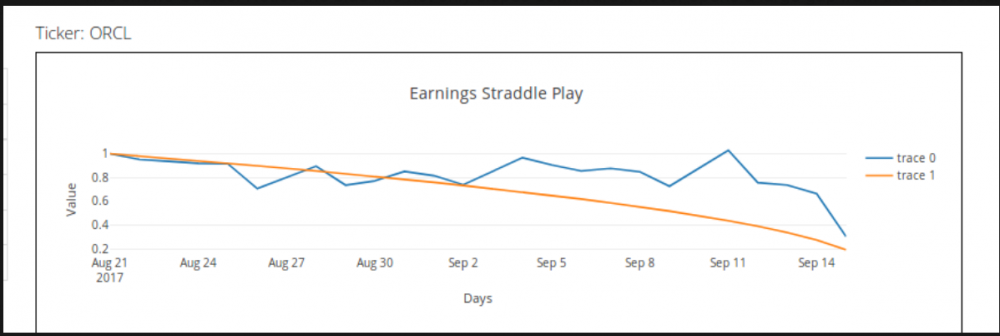
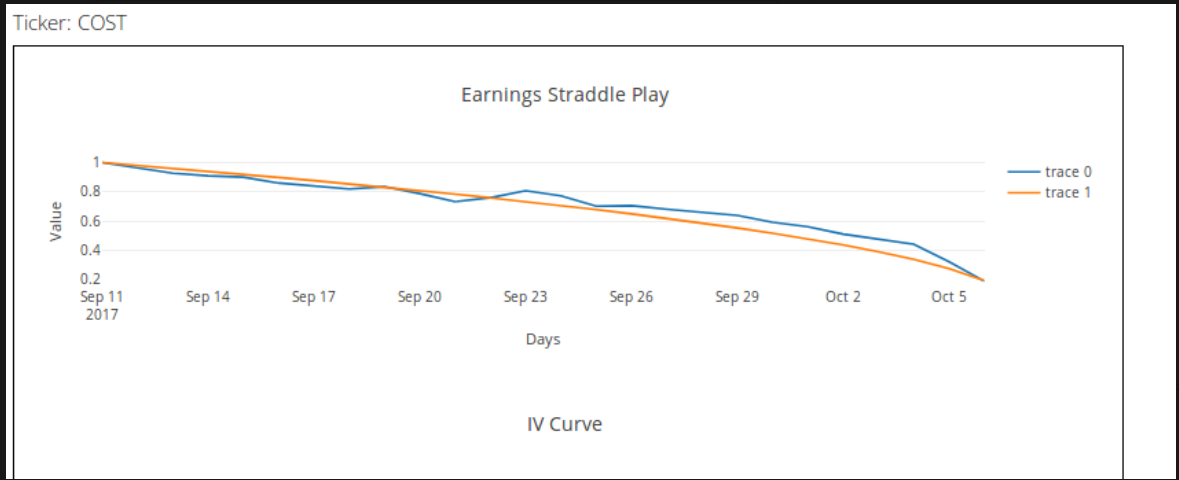
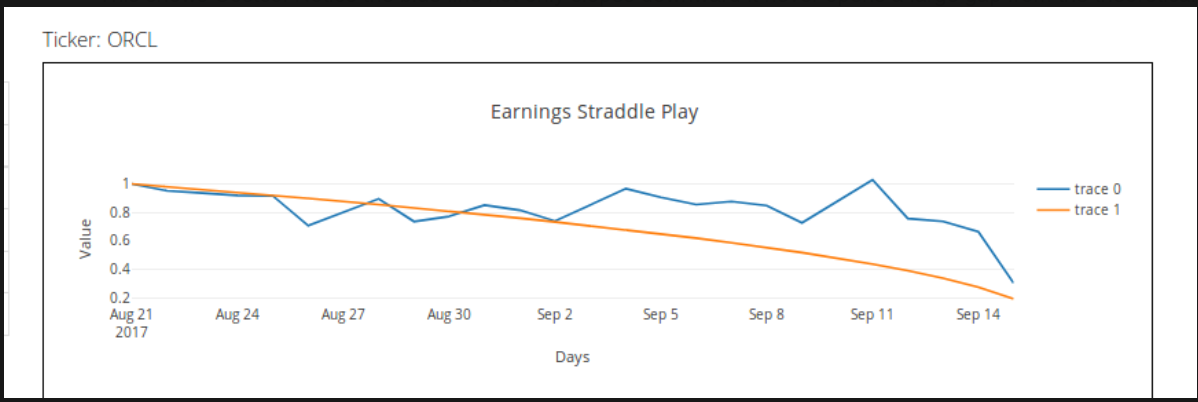
Thanks for all the questions/feedback. It’s always helpful to see that. I thought it may help to break down how I approached the problem not because it is necessarily the best way but because it explains why I’m looking at it the way I am. Also, from a purely development standpoint I’m building all of the modules out in an object oriented way so we can quickly iterate and improve various components of the model over time to improve it. Assumptions: Implied Volatility is normally a good predictor of the future volatility of the underlying. If you take this idea to its logical conclusion it means that absent any fees etc options are usually priced correctly and the long term expectation value of buying or selling any option is zero. Approaching earnings IV will sometimes rise due to speculation or additional hedging (or some other factor...not really important) but this rise in IV does not reflect any change in the expected volatility in the underlying instrument. This rise in IV means that the standard pricing model may underprice options. This mispricing due to an expected rise in IV may lead to an opportunity to purchase options to either capture the increasing spread between near and far month IV or allow us to exploit the rise in IV directly through a long vol position. Development Process: Build each model component independently (OOP) to allow rapid iteration and improvement. Build in model/forecasting metrics to capture model error and guide future improvements. Components: Current Market IV estimator IV forecast. Option pricing model (currently BS but that will change) Data Model I’m not going to explain all of these components in detail. It is important to know that each is “stubbed” so we can improve them over time. Suffice it to say while our components are currently rough, we should be able to improve them quickly and we’ve implemented some standard and necessary forecasting techniques already like normalization etc. Recent results show that our methodology has some merit (ORCL spike etc). Source of Edge: The avoided theta decay due to rising IV is in essence the edge in this trade if our assumptions hold. We've even seen some instances where theta is actually positive for a long straddle despite what the BS model would state. While there are sources of model error, if we isolate times when the calculated edge is significantly greater than model error we should be able to trade it profitably. Also, doing this quantification upfront is necessary for us if we want to develop a empirically verified objective function that we can optimize. One additional note, to do this really well we likely need to build out our own pricing model using Monte Carlo methods. I’m scoping this now as well as working on some shorter term improvements to the BS implementation we’re using now. Regards, Rich A and John A this one looks good to me: Explanation of Earnings Charts: Definitions: Normal IV: Implied vol prior to any influence from the upcoming earnings. Can be thought of as “fair” volatility. Earnings IV: The implied volatility rise due to the upcoming earnings cycle. Theoretical Delta Neutral Straddle: An artificial straddle that is perfectly delta neutral. This allows us to isolate price changes in the underlying options due solely to IV rise. Normalized IV Curve: We look at historical implied volatilities and adjust them to take into account the current normal IV and then forecast an IV return curve over the next several days. This allows us to use historical IV from different periods without any bias due to higher or lower overall IV in the market. This curve shows how the IV changes over the course of the trade. Normalized straddle prices: This is the blue line on the chart. It shows how the value of a theoretical delta neutral straddle will change over time based solely on the IV curve. The inputs to this chart are normal iv, earnings iv, normalized IV curve, the black scholes model and days to expiration etc. Standard straddle prices: The orange curve on the chart. This shows how the same straddle would perform if there were no IV price spike. Advantage: The difference in accumulated theta decay between the normalized straddle prices and standard straddle prices. This should be evident if you understand the relationship between theta and gamma. (Note: advantage can be used to calculate edge and fractional position sizing). Simple way to think about it...the difference in the two line shows you the amount of gamma you’re getting for free. (Note: I get it is a little confusing to look at the return stream instead of actual option prices. We did this for a number of reasons related to future plans with a more automated trade system. If you want to convert it to an actual straddle price simply take the price of a delta neutral straddle on day t-25 and multiply it by the daily values of the blue line in the chart. This will give you an actual price forecast for that straddle. ) How to use the chart: 4 scenarios. Scenario 1: No significant advantage. Downward sloping blue line. This shows Costco. Notice the blue line not only slopes downward it never opens a large gap from the theoretical price. While there is a slight advantage the model does have some error in it. This is probably not a good trade. Scenario 2: Advantage but downward sloping blue line. Notice the time period from around Sep 3rd to Sep 8th. The blue line is sloping down showing that without any movement in the underlying the straddle will lose money. However, it still has a wide gap between the blue line and orange line. That means that if you got in around Sep 2nd you probably got a lot of gamma for free. This trade (Sep 2 to Sep 8) should have a positive expectancy although a lower win rate than some other trades. Scenario 3: Advantage and a flat blue line. Look at Oracle between Sep 5th and Sep 7th. The line for those few days is flat. This implies that if you opened a straddle then you would pay zero theta for 2 to three days of gamma. This is a low risk trade with almost free gamma upside. Scenario 4: Advantage and upward sloping blue line. This is the best scenario. Look at Oracle between Sep 8th and Sep 11th. The blue line is upward sloping. This means that you could buy a straddle and actually get paid theta to gain on gamma. This is a great spot to be in.
 1 point
 -
i cant tell if you're trolling me at this point or not..lol Here's a simple way to think about it. theta is the cost we pay for exposure to gamma. if we dont pay for gamma (or pay way less than normal), that's an edge, like it or not. These charts highlight that relationship. If you're getting hung up on the divergence of the two lines, you can just look at the value of the blue line to identify straddles that are likely to hold their value well against theta into earnings. We will add an explanation of a sample chart to my thread on the general board.1 point
-
Yes, but this is pretty much the outcome I would expect from this strategy on the SPY. It has a lot of losses, even though the total gain is a high number. 49/22 is not a trade I would get involved in because I know myself and I would not be happy with such a large number of losses, no matter what the outcome. I want to see % at least higher than 80-851 point
-
Do not take my words on simplification personally. I actually simplified things for me. Since I realized that it is not easy to write a post which explained my point in details and at the same time not to quote half of the book. I updated my post to include the original aggregate volatility formula from the book, found that formula not only contains coefficients but is also non-linear SQRT(A^2+B^2). This invalidates all my attempts to find some mathematical validity in subtracting blue and orange lines assuming they represent option prices or IVs. So my previous post can be safely ignored. Sorry for this. Then, I was assuming you are plotting option prices (and not IV's). Since y axis did seems to be like option price. But now you are talking about normalization. Thus, it turned out I still do not understand what and how you exactly calculate and plot. And how normalize the data. So I think there is no point to further discuss your implementation and the charts. I'll just assume you know what you are doing. I believe RV charts have no such issues, since they just show straddle prices from different expirations expressed as percentages. It is very clear what they show, and what their limitations are. There are no attempts to subtract some BS based calculated volatilities e.t.c. All straddle prices have the same source (market) the dimentions match. Surely, these charts can be significantly improved if one implements a volatility model designed specifically for earnings events. I can not suggest a better that this methodology, since I do not completely understand the rationale behind you methodology as well as some implementation details (for example what is the normalization procedure). But, if I was going to implement "better RV charts methodology", I would take Aggregate Volatility Formula and Earnings Volatility Model from Brian's book. Then implement a methodology to split market IV into EarningsIV and NormalIV (I am using terminology strictly as in book). Then I would think what our edge really is? We are trying to find situations when IV rise is more or equal to the theta decay. So the first idea will be to plot RV charts using the EarningsIV component only, ignoring NormalIV component. Second idea, take the Earnings Volatility Model and calculate the TrueGreeks, which take into account earnings events. Then we can plot charts like TrueVega/TrueTheta. That can possibly allow us to find situations where Vega/Theta ratio is good enough to enter the trade. And third idea is having calibrated earnings volatility model run a MonteCarlo simulation on a range of potential price movements till earnings, average the results and check where average NetProfit/MaxDD ratio good enough to trade the strategy (this is exactly what Brian's EEVIntegrated2 Excel spreadsheet does).1 point
-
Ok, thanks! Now I believe I understand the idea behind, and the implementation. One more question. When you calculate OrangeLine and take IV of the straddle from T-25, what are you using: is this an IV of the current cycle, or an average IV from the past cycles? I can see some value in taking IV of the straddle from T-25 from an average IV of past cycles (this will be close approximation to a Normal IV of the past cycles on average, since it is around 25 days to earnings and IV does not start to rise much). But if OrangeLine is derived from current cycle prices, it becomes really difficult to tell what the difference from BlueLine and OrangeLine really means in a mathematical sense.1 point
-
I tweaked the SPY trade idea from CML and thought I would post the results: http://tm.cmlviz.com/index.php?share_key=20170918163931_WJZF114ckNKoXhQd Looks like if you change the iron condor to 30/20, and close on gains above 50%, take out closing losses, and open next trade immediately, you get 170% gain for 1 yr, 272% gain for 2 yrs, and 159% gain for 3 years.1 point
-
I believe he had mentioned previously that he uses an IV number that is approximately 25 days before earnings and holds it static.1 point
-
Well, if you calculate the orange line as I described above, the calculation is flawed. Since we have an earnings event that occurs before the expiration, to proper model the option price we need to take into account that IV consist of two components: normal option volatility and earnings option volatility. If we just take IV at some point and fix it, and put this into the B/S formula, we are going to receive completely incorrect theta decay, i.e. B/S will tell us that option price will decay as quickly as if we had no earnings event. But we do have a binary event before the earnings. More details on Earnings Volatility calculation can be found in Brian Johnson's book "Exploiting Earnings Volatility: An Innovative New Approach to Evaluating, Optimizing, and Trading Option Strategies to Profit from Earnings Announcements". I understand what you are trying to achieve - assess a theta decay in option price before the earnings, but as well as @Kim I do not see how you calculation is relevant here. Proper earnings volatility modelling is quite complicated thing - one needs to analyze whole option chain and calibrate a model to be able to split IV to Normal IV and Earnings IV. And so on (some time ago I put a lot of efforts into studying Brian Johnson's work, and can tell it is not as simple as take B/S formula and put some values into it).1 point
-
So when the blue line goes below the yellow line (like around Sep.26-29), that means that straddle not only losing value, but it is losing value even more than "normal" straddle without earnings?? That doesn't make sense. We know that there are periods when straddle would lose value, so IV increase does not compensate for theta losses, but it is very uncommon for s straddle to lose value even more than straddle without upcoming earnings would.1 point
-
i would if I werent using Yowster's combo trade. See above.1 point
-
The TradeMachine uses calendar days, not trading days. So, yes, weekends count.1 point


This leaderboard is set to New York/GMT-04:00