Leaderboard


Popular Content
Showing content with the highest reputation on 08/09/13 in all areas
-
I'v done an analysis with 96 earnings on AMZN, CSCO, GMCR, WYNN, QCOM, NFLX, BIDU, YUM. (All these stocks have a high ratio of >3StDev moves to 1&2StDev moves as Augen suggests, in other words they have big price earnings spikes). I've been finding a high correlation between profitability of a monthly straddle held for 5-days and the volatility premium divided by the stock move on the day after last earnings cycle: (IV-HV20) / LM - where IV is IV of the straddle - HV20 is the 20 day historical volatility of the stock. - LM is the % move of the stock the day after earnings are announce. The relationships is not linear, if you plot profits vs indicator you don't get a straight line. However, if I group the results into quartiles, and take the median number, the correlation is striking. Quartile: Straddle P/L: - In backtesting this is accurate 70% of the time in 100 earnings trades using What I like about this indicator is that in all but 1 case, it gets you out of situations with greater that a 7% loss, and 85% of trades with profits above 5%.3 points
-
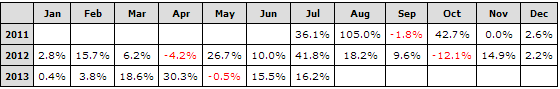
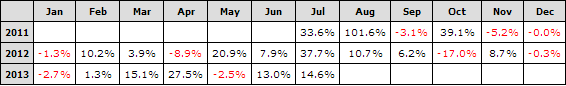
We are asked many times how SteadyOptions performance is calculated. The purpose of this article is to clarify few basic terms and explain how we calculate and present our performance. ROI (Return On Investment) vs. Portfolio Return First, lets explain the difference between ROI (Return On Investment) and Portfolio Return. Lets take as example a month where we had 20 trades with average return of 5% per trade (this example is not far from our average performance). Lets also assume that we have a $10,000 portfolio, allocate 10% ($1,000) per trade and have maximum of 6 open trades. The total return for that month would be $50 (return per trade) * 20 (number of trades) = $1,000. Since we have maximum of 6 open trades, our investment is $6,000, so our ROI would be 1,000 / 6,000 = 16.7%. However, Portfolio Return is 10% since the total size of the portfolio is $10,000. ROI will always be higher than Portfolio Return since we keep portion of our funds in cash. If we increase the allocation to 15% per trade, our return per trade will increase to $75, total investment to $9,000, total return to $1,500. The ROI will remain the same (16.7%), but the Portfolio Return will increase to 15%. This is an important point: the ROI will always remain the same, but the Portfolio Return will vary, depending on the allocation. Compounding vs. non-compounding Next thing to clarify is compounding vs. non-compounding. Non-compounding means that we allocate a constant amount of money to each trade. In case of 10k portfolio and 10% allocation, that would be $1,000. Compounding means that as our account grows, we increase our dollar allocation to match the new portfolio size. For example, if we made 10% on our first $1,000 trade, portfolio value is now $10,100 and we will allocate $1,010 to the next trade instead of $1,000. Compounding will have a significant effect on portfolio returns. Our model portfolio uses 10% per trade allocation and compounding, while our ROI is non-compounded. This is actually pretty conservative since it leaves at least 40% of our funds in cash. Pro-Trading-Profits reports As you know, our performance is verified by Pro-Trading-Profits, an independent website tracking the strategies of trading newsletters and advisories. The report was generated using the default PTP allocation which is 15% per trade and zero commissions. We present this report ex-commissions to make it comparable to other services which present performance data ex-commissions as well. Lets see some examples to demonstrate how performance is affected by different parameters. If you go to the "Monthly Returns" tab, you will see the following table: This table might look familiar to you - it appears on our Performance page and is taken directly from the PTP report. Now lets see what happens when we use commission structure of $0.75 per contract and no base rate (which is what I pay at Interactive Brokers): As you can see, the impact of commissions is about 2-3% per month on the whole portfolio. In some months it was higher because we traded more, but with 15-20 trades per month, 2-3% per month would be pretty typical, assuming $0.75 per contract. It also seems that in 2013 PTP changed the way they calculate commissions, so you might see higher impact in 2012, but 2013 gives better representation of impact of commissions. You can change the commissions structure and see the results. You can also play with different allocations and see how that would affect performance. I hope this article helps to clarify some misunderstandings about performance reporting. Let me know if you have any questions. Comment: Pro-Trading-Profits closed a while ago, after tracking our performance for 3 years.
 2 points


This leaderboard is set to New York/GMT-04:00