SteadyOptions is an options trading forum where you can find solutions from top options traders. Join Us!

We’ve all been there… researching options strategies and unable to find the answers we’re looking for. SteadyOptions has your solution.

Wide, flat SPX Diagonal Spread


I love to trade SPX diagonals, especially when IV skew is higher than usual and I get a wider range of break evens. I know that time options spread break evens are “theoretical” because they are dependent on the IV skew of the front and back month’s IV that changes all the time.

I always wanted to have a mechanism that scans the market for specific SPX diagonals and alerts me whenever find it. That is why I have developed an alert algorithm in the scanner so that I do not have to manually scan for interesting setups all day, but it will alert me.


Let’s see what type of diagonals I like for SPX.

  • Ticker: “SPX” because I am looking for SPX diagonals;).
     
  • Option: “put” means I am looking only for put diagonal spreads.
     
  • Price: “0 – 500” means I am only interested in spreads that have a debit between 0 and 500 dollars. I am only looking for debit diagonals because credit ones would have different directional bets.
     
  • DTE: “0 – 30”, I am looking for the ones with max 30 days to expiration.
     
  • Front delta: “20 – 45” defines the delta distance for the front leg of the spread. This makes it close to the money, but not ATM where the net delta would be positive and I am looking for negative delta.
     
  • Delta: “-100 – 0” is the net delta of the position. In this scan, I am only looking for a negative net delta configuration because then if the market starts to fall, I am immediately making money on the spread. This diagonal is accumulating net negative delta as days go by through the effect of charm Greek.
     
  • Expiration diff: “3”, means I am looking for diagonals where there are 3 days in between the expiration dates. This is typically Friday/Monday expiration. You can also search for various expiration differences.
     
  • Skew: “-100 – 0”, this is the most crucial part of this setup, the horizontal IV skew. This setting states that I am looking for negative skew, which means the front leg has a higher IV than the back leg.
     
  • Strike diff: “5” is the interval between the long and short strikes of the diagonal. If I want to have the scanner look for all the variations, I would set it to 0. But for this setup, 5 is the best strike difference.
     
  • Type: “bull”, there are two types of diagonals for puts and calls. Bull diagonals and bear diagonals. In this setup this is a bull put diagonal which means that the long put has a higher strike than the short put, hence it is more of a range trading setup.
     
  • R/R: “500 – 1000” means I am looking for diagonals that have a reward-to-risk ratio of at least 500%. The R/R is based on the max potential loss vs. the max potential profit of the diagonal.
     
  • C/W: “10 – 100”, stands for the percentage of credit/width I get for shorting the embedded vertical that is found in the diagonal spread. Every diagonal has an embedded vertical spread and with this setting, I am making sure that it’s worth selling that embedded vertical. So if I am looking for a min. of 10% C/W that means when I short the vertical I get at least 10% of the width of the vertical in credit.
     
  • Range: “0 – 100” defines how wide the breakeven range in percentage should be in a calendar spread. I left it on default.
     
  • Min. volume: “1” is looking for legs that have at least a volume of 1 on the current day. With this, you can filter out those that have very low volume, hence wider bid/ask spreads.
     
2022-10-19-09_43_05-1024x298.png


As you can see in the image above, I have only found one SPX put diagonal which had 600% R/R potential and a pretty flat configuration. Let’s go through what the columns mean.

  • Watch: with these icons you can add a spread to your watchlist, analyze the risk graph or copy the trade to thinkorswim format.
     
  • Ticker: nothing to explain here:)
     
  • Exp: the front and back month expiration of the diagonal spread.
     
  • Diff: the day difference between the legs’ expiration dates.
     
  • DTE: how many days are until expiration in the front / back leg.
     
  • Int: the strike difference between the legs.
     
  • Strike: the found strikes of the diagonal spread.
     
  • Opt: option is either call or put.
     
  • Tg%: target %, how far the strike is in percentage move from the current stock price.
     
  • TgΔ: the target delta of the spread which is the front delta in this case.
     
  • Price: debit of the spread.
     
  • Profit: the theoretical max. profit you can make on the specific calendar spread.
     
  • Risk: the risk of the trade, in this case, the debit paid.
     
  • R/R: reward to risk in percentage.
     
  • C/W: percentage credit/width of the embedded vertical.
     
  • Skew: the horizontal IV skew of the legs. Negative means it is backwardated that is the front leg has a higher IV than the back month.
     
  • Range: what is the price range in percentage between the breakeven points of the spread (how wide is).
     
  • Delta: net delta of the spread.
     
  • Gamma: net gamma of the spread. Theta: net theta of the spread.
     
  • Vega: net Vega of the spread.
     

Risk graph of the position

Here is the risk graph of that one diagonal above.

2022-10-19-09_45_05-1024x571.png

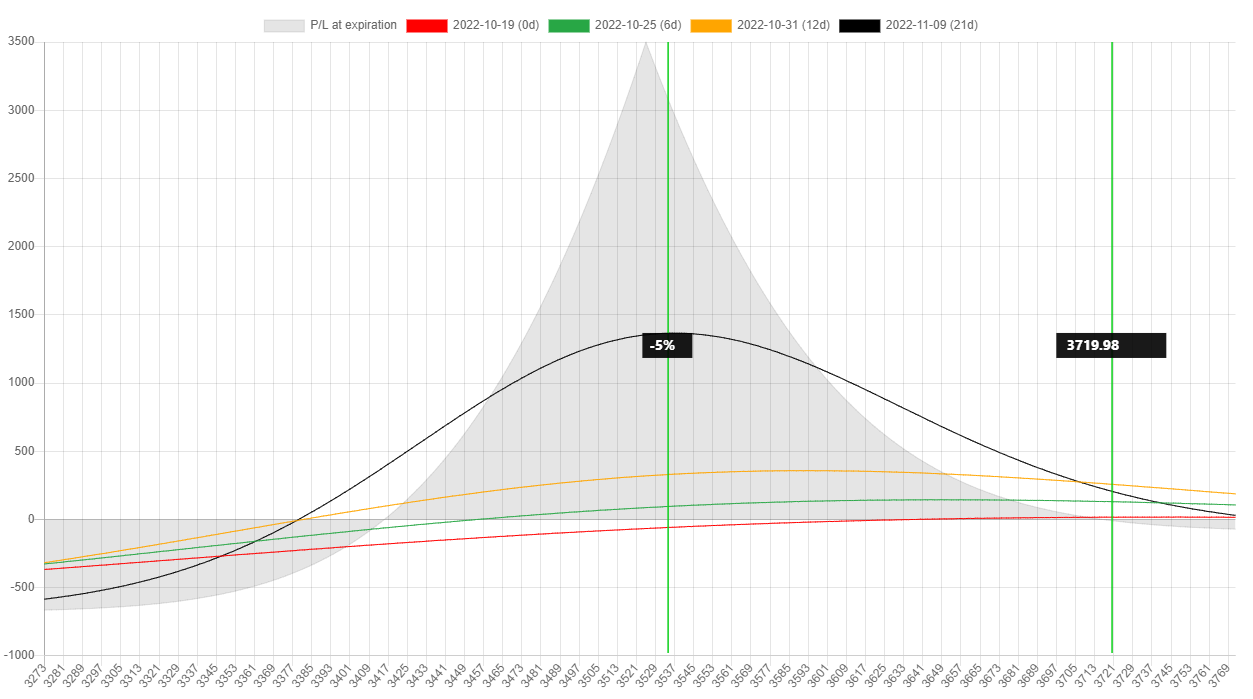
You can tell from the risk graph that this configuration is pretty wide and flat in terms of net delta. It makes money with time and direction. Since I love these diagonals, I have created a scan template for it and clicking on the alert button, I will get notified whenever this setup comes around during the day. This is pretty rare, so I might not get an alert every day, but in a high IV environment, it is more common.
 

Diagonal scanner guide

For a more detailed explanation of how to use the diagonal spread scanner please watch the following video.


Special SO offer:

If you sign up for NinjaSpread until 11.30.2022, you get 30 day free trial instead of 14 day and 20% discount. Coupon code: SO10 
 

What Is SteadyOptions?

12 Years CAGR of 122.7%

Full Trading Plan

Complete Portfolio Approach

Real-time trade sharing: entry, exit, and adjustments

Diversified Options Strategies

Exclusive Community Forum

Steady And Consistent Gains

High Quality Education

Risk Management, Portfolio Size

Performance based on real fills

Subscribe to SteadyOptions now and experience the full power of options trading!
Subscribe

Non-directional Options Strategies

10-15 trade Ideas Per Month

Targets 5-7% Monthly Net Return

Visit our Education Center

Recent Articles

Articles

  • SPX Options vs. SPY Options: Which Should I Trade?

    Trading options on the S&P 500 is a popular way to make money on the index. There are several ways traders use this index, but two of the most popular are to trade options on SPX or SPY. One key difference between the two is that SPX options are based on the index, while SPY options are based on an exchange-traded fund (ETF) that tracks the index.

    By Mark Wolfinger,

    • 0 comments
    • 977 views
  • Yes, We Are Playing Not to Lose!

    There are many trading quotes from different traders/investors, but this one is one of my favorites: “In trading/investing it's not about how much you make, but how much you don't lose" - Bernard Baruch. At SteadyOptions, this has been one of our major goals in the last 12 years.

    By Kim,

    • 0 comments
    • 1,376 views
  • The Impact of Implied Volatility (IV) on Popular Options Trades

    You’ll often read that a given option trade is either vega positive (meaning that IV rising will help it and IV falling will hurt it) or vega negative (meaning IV falling will help and IV rising will hurt).   However, in fact many popular options spreads can be either vega positive or vega negative depending where where the stock price is relative to the spread strikes.  

    By Yowster,

    • 0 comments
    • 1,590 views
  • Please Follow Me Inside The Insiders

    The greatest joy in investing in options is when you are right on direction. It’s really hard to beat any return that is based on a correct options bet on the direction of a stock, which is why we spend much of our time poring over charts, historical analysis, Elliot waves, RSI and what not.

    By TrustyJules,

    • 0 comments
    • 867 views
  • Trading Earnings With Ratio Spread

    A 1x2 ratio spread with call options is created by selling one lower-strike call and buying two higher-strike calls. This strategy can be established for either a net credit or for a net debit, depending on the time to expiration, the percentage distance between the strike prices and the level of volatility.

    By TrustyJules,

    • 0 comments
    • 1,879 views
  • SteadyOptions 2023 - Year In Review

    2023 marks our 12th year as a public trading service. We closed 192 winners out of 282 trades (68.1% winning ratio). Our model portfolio produced 112.2% compounded gain on the whole account based on 10% allocation per trade. We had only one losing month and one essentially breakeven in 2023. 

    By Kim,

    • 0 comments
    • 6,401 views
  • Call And Put Backspreads Options Strategies

    A backspread is very bullish or very bearish strategy used to trade direction; ie a trader is betting that a stock will move quickly in one direction. Call Backspreads are used for trading up moves; put backspreads for down moves.

    By Chris Young,

    • 0 comments
    • 9,941 views
  • Long Put Option Strategy

    A long put option strategy is the purchase of a put option in the expectation of the underlying stock falling. It is Delta negative, Vega positive and Theta negative strategy. A long put is a single-leg, risk-defined, bearish options strategy. Buying a put option is a levered alternative to selling shares of stock short.

    By Chris Young,

    • 0 comments
    • 11,576 views
  • Long Call Option Strategy

    A long call option strategy is the purchase of a call option in the expectation of the underlying stock rising. It is Delta positive, Vega positive and Theta negative strategy. A long call is a single-leg, risk-defined, bullish options strategy. Buying a call option is a levered alternative to buying shares of stock.

    By Chris Young,

    • 0 comments
    • 12,004 views
  • What Is Delta Hedging?

    Delta hedging is an investing strategy that combines the purchase or sale of an option as well as an offsetting transaction in the underlying asset to reduce the risk of a directional move in the price of the option. When a position is delta-neutral, it will not rise or fall in value when the value of the underlying asset stays within certain bounds. 

    By Kim,

    • 0 comments
    • 10,051 views

  Report Article

We want to hear from you!


Create an account or sign in to comment

You need to be a member in order to leave a comment

Create an account

Sign up for a new account. It's easy and free!


Register a new account

Sign in

Already have an account? Sign in here.


Sign In Now

Options Trading Blogs