
Options traders must rely on confirmation before actioning, in the form of traditional technical reversals, candlesticks, volume spikes and momentum oscillators. However, two specific MA patterns are worth tracking.
The Golden Cross
First is the golden cross, the act of a short-term MA moving above a longer-term MA. In popular use are the 50-day MA (short) and the 200-day MA (long). Because the short-term is more responsive to current price movement than the long-term, this crossover – when confirmed by other signals – is a strong indicator of bullish things to come. For options trading, this indicates good timing for opening long calls or short puts; or for closing existing short calls or long puts.
For example, McDonalds (MCD) had exhibited an uncertain pattern between July and September 2018. Then a golden cross occurred, marked on the chart. This indicated a likelihood of a bullish move soon.
But was this enough? No, confirmation was required as well. There were two clear confirming signals that the bullish signal was the real deal. First, four sessions after the golden cross, the price gapped lower, which initially looked like a bearish move. But then a bullish reversal signal appeared in the form of a harami cross. This is one of those strong reversal signals that makes use of a doji to indicate a clear turning point. If this was not enough to spark interest, a volume spike showed up five days later. This markedthe beginning of a bullish move. With price at $165.50 the day before, the spike was accompanied by a 12-point upward price move and, by the end of November price had moved up to $190 per share.
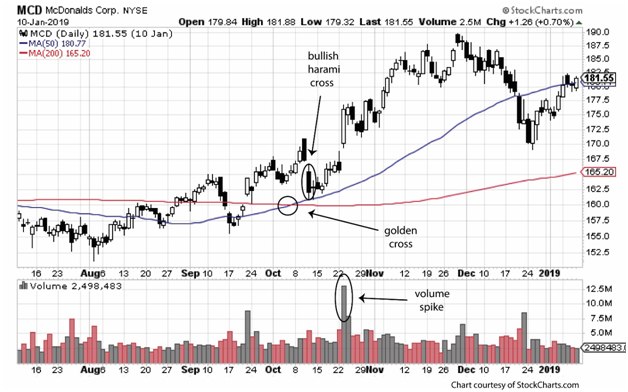
The timing of a bullish options move depends on whether a trader relies on the combination of the golden cross and the bullish harami or needs more. By the point of the spike, price had already moved 10 points, so the opportunity to maximize the bullish options trade was not as clear as it had been when price was $162.50 at the point of the harami cross. At this point, opening a long call or a short put – expiring in November, for example – would have been maximized by subsequent price movement. If options were open by the time the harami cross appeared, it was also time to act (specifically, closing a long put or a short call).
The golden cross started the signal and was reliable. One advantage to tracking this is that you do not need a bearish trend to mark an action point. MCD had been moving sideways before the golden cross. In this situation, which is common, how do you identify the beginning of a new trend? The golden cross works even when a current dynamic trend is not visible.
The Death Cross
This dramatically named signal is not a Star Wars reference, but a bearish signal based on activity between a short-term and long-term MA. When the short-term crosses below the long-term, it is the first sign that a bearish trend could be developing.
The crossover by itself is never enough to act. The MA, as a lagging indicator, must be used with caution. This means confirmation is always needed.
For example, on the chart of Chevron 9CVX), a death cross appear but, by itself, is not a clear bearish signal. More is needed before acting.
The crossover was minimal, meaning the two MA lines remained in proximity. More dramatic is the fast movement of the two lines away from one another. In the CVX case, two additional signals confirmed the bearish turn; both were doji stars.
The first appeared several weeks after the crossover. However, even though price had already declined by 134 points when this signal appeared, waiting was prudent given the uncertainty of the death cross. The second signal was especially interesting as a second confirmation because when it appeared, price had returned to the level seen immediately before the crossover, about $119 per share. This was the time to act.
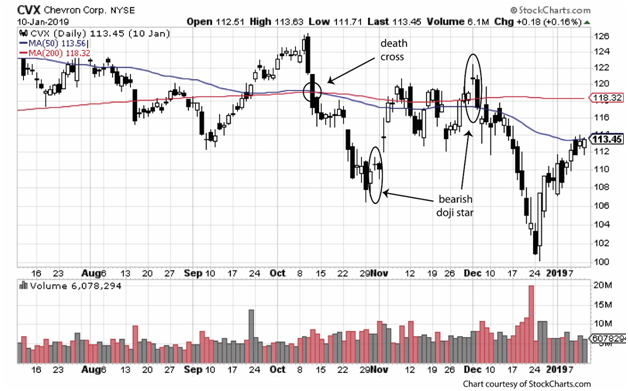
By this point of second confirmation, confidence in the coming bearish trend should have been high. Within less than a month price fell to $100 at one point, a 19-point decline. At the point of the second doji star, timing was perfect to open a short 120 call or a long 120 put; or to close opposite positions if open at that point. Given that price fell as much as 20 points from the 120 strike in a matter of only a few weeks, timing for a monthly option was excellent.
Moving average signals are not always reliable, and because they are lagging, they can be trusted only with confirmation. A suggested policy rewarding this type of signal: Continue relying on price-based indicators including candlesticks and traditional Western reversals (gaps, double tops and bottoms, and head and shoulders, for example), especially if the reversal appears above resistance or below support. Also rely on Bollinger Bands and observed price movement above the upper band or below the lower band. Also look for volume spikes, gaps, changes in momentum (overbought and oversold), and any other combination of reversals that have been shown to reliably predict price reversal.
At the same time, consider MA crossover – both golden and death crosses – as additional tools for interpreting chart activity. Time option entry and exist for the development of signal and confirmation and apply patience, waiting only for the perfect development of signals before making your move.
Michael C. Thomsett is a widely published author with over 80 business and investing books, including the best-selling Getting Started in Options, coming out in its 10th edition later this year. He also wrote the recently released The Mathematics of Options. Thomsett is a frequent speaker at trade shows and blogs on his website at Thomsett Guide as well as on Seeking Alpha, LinkedIn, Twitter and Facebook.

There are no comments to display.
Join the conversation
You can post now and register later. If you have an account, sign in now to post with your account.
Note: Your post will require moderator approval before it will be visible.