
This is the what, or the strategy of the thing. The how, or the tactics, is approach-specific because it depends on the edge(s) you plan to exploit.
The most fundamental edge that sellers of equity options try to take advantage of is the risk premium associated with implied volatility (IV). Essentially, this risk premium is the average positive difference between the volatility implied by option prices and the actual volatility that's realized in the underlying over a given timeframe. (There are many papers on the subject, so I won't go into it any further except to say that the risk premium is typically calculated using near-the-money (NTM) options and can be thought of as compensation for Black-Scholes-Merton (BSM) model error.
It also motivates market participants to be sellers as well as buyers, since sellers must tolerate, at least theoretically, downside risk to zero [put sellers] and unlimited upside risk [call sellers].) All net-sellers of options are, therefore, selling high on average by default. The use of volatility cones is an example of a tactic that aims to maximize this edge.
In a perfect BSM world, the insight above would suffice as all options on an underlying would have the same IV across both the strike and time-to-expiration spaces. Obviously, we don't live in a perfect world. The real world, not being Black-Scholes-Mertonian, is rich with values for IV which change not only across strike and time, but in time as well.
Dynamic IV is the source of option volatility skew and the basis for another, more nuanced type of edge. In order to capitalize on it, a higher degree of granularity is required - one in which we not only consider differences between NTM implied and historical volatilities, or even those between NTM IV and historical NTM IVs, but also the relative differences between all current IVs.
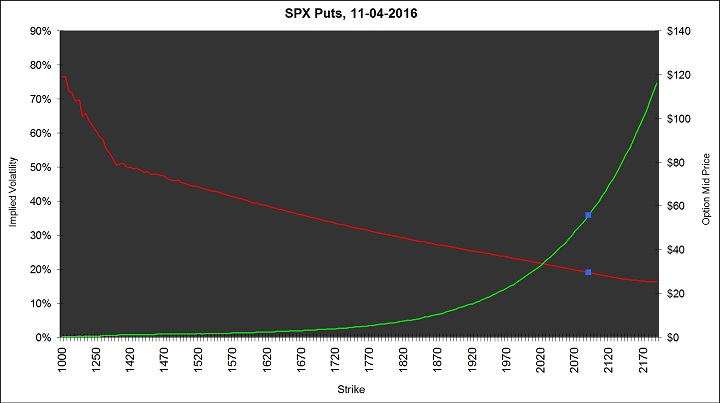
Figure 1 is a snapshot of closing mid prices (green curve) and their associated IV's (red curve) for SPX put options on November 4th, 2016. The 'blue dots' on each curve occur at the first in-the-money (ITM) strike, which in this instance is at 2090. Superficially, locating the "richest" strike appears to be a trivial task - it's clearly at the 1000 level, which has an IV of ~76.5%. However, retail sellers of this strike stand to collect only $.25 per share less any brokerage commissions and exchange fees, which means that large numbers of contracts must be sold in order to collect a meaningful credit overall.
This amounts to selling a lot of 'black swan' risk, near-universally considered unwise. At the opposite extreme, traders can maximize the credit received per contract by selling the last out-of-the-money (OTM) strike at 2085, which would bring in $53.65. Also far from ideal, since we aim to sell IV away from the lower-end of the curve so that skew will work to our advantage. The problem can be stated as follows:
Which strike offers the best balance of high price and high IV?
One answer to this question depends on our best estimate of future realized volatility (FRV). Since NTM options are typically the most liquid, it stands to reason that these options imply a more unbiased estimate of FRV than options farther OTM because their prices aren't determined as much by market makers, but instead by order flow. This estimate can, for simplicity's sake, be regarded as the current fair value of IV, which means that all other IV's farther OTM must be relatively expensive. The original question can now be restated as:
Which strike offers the most extrinsic value due to skew?
First, some simplifying assumptions:
- The strike price space is continuous for all K∈R+K∈R+
- Options can be bought or sold at any strike
- The risk-free-rate, rr, and the dividend yield, DD, are equal to 00
Now, let
P(K,σ(K))=P(K,σ(K))= the put price at strike KK with volatility σ(K)σ(K), and
P(K;σ⋆)=P(K;σ⋆)= the put price at strike KK with at-the-money (ATM) volatility σ⋆σ⋆.
If K=SK=S, where SS is the current level of the underlying, we have
P(K,σ(K))=P(K;σ⋆)P(K,σ(K))=P(K;σ⋆).
Consider the following function:
f(K,σ(K);σ⋆)=P(K,σ(K))−P(K;σ⋆)f(K,σ(K);σ⋆)=P(K,σ(K))-P(K;σ⋆).
When K<SK<S,
f(K,σ(K);σ⋆)>0.f(K,σ(K);σ⋆)>0.
The function ff is useful because it isolates the skew component of OTM options in dollar terms. ff reaches a maximum at KK when
dfdK=0.dfdK=0.
In practice, there's no need to use calculus to find the maximum value of ff. Simply export the day's option data to a .csv file, create a VBA module in Excel to store BSM pricing code, then find the required function values at each strike. I used the IV from the first ITM strike at 2090 as the value for σ⋆σ⋆.
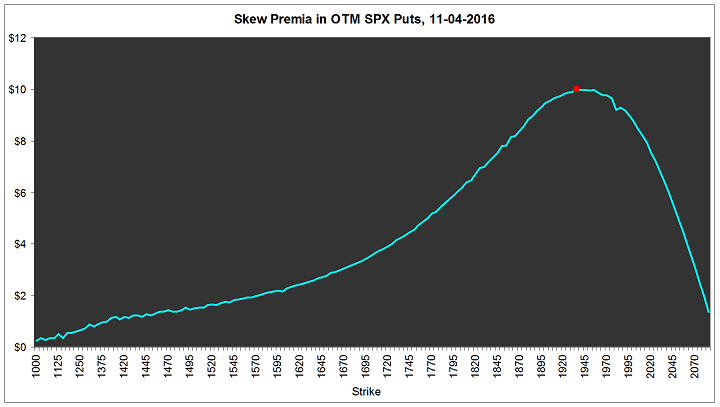
Figure 2 displays the function ff. We can see that the strike at 1935, which lies ~7.2% OTM, offers $10 in 'skew premium', more than any other strike with respect to absolute dollar amount. In fact, with a mid price of $17.30, the majority of the extrinsic value is due to disproportionate demand at the 1935 level which manifests itself as skew. (It's worth mentioning that during normal trading hours we can expect the graph of ff to be smoother due to narrower bid/ask spreads.)
This post is meant to offer readers a bit more objectivity when selecting short strikes. Other factors such as risk tolerance, liquidity, etc. should also be taken into account when making a final decision. Thanks to MW for his help on this.
This post was contributed by Joe C. Antonelli.


There are no comments to display.
Create an account or sign in to comment
You need to be a member in order to leave a comment
Create an account
Sign up for a new account. It's easy and free!
Register a new account
Sign in
Already have an account? Sign in here.
Sign In Now