Second, we were targeting negative correlation with the broader stock indexes to maximize the diversification benefits for people using this system as part of a broader portfolio. Third, we wanted to make trading the system predictable from a time standpoint.
To accomplish these three objectives we built a mechanical trend following system using options on futures contracts that signals every Friday morning. The system is always in the market. To manage risk across all the contracts we use at the money option debit spreads targeting an overall delta based on the variation of the underlying future. We are currently trading 10 underlying commodity and financial futures. Like all trend systems we expected the overall returns to be positive, but the month to month performance to be lumpy with occasional large winning months.
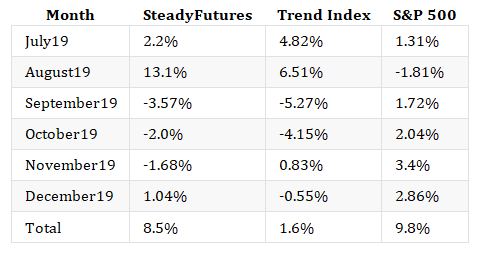
In the following table I show the monthly performance of the trend system since July compared to the SocGen Trend Followers Index and the S&P 500.The cumulative return on the Steady Futures portfolio for the 6 month period is 8.5% versus 1.6% for the SocGen Trend Followers Index. Additionally, our returns were non-correlated to the S&P 500 index returns. Trend following systems often perform poorly during stock bull markets. Considering this tendency we are very happy with the performance of the system over this period.

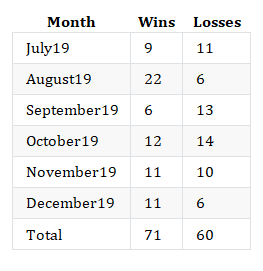
Our win rates are in line with expectations. As a reminder, trend systems tend to have low win rates but larger wins than losses. Some successful trend systems have win rates as low as 40%.

Changes to the System for 2020
It is important to think about what the sources of the performance difference between our system and the trend followers index are, and whether we are happy with those performance differences. While it is hard to quantify these drivers (we don't know exactly what or how others are trading) we can make some reasonable assumptions based on what we know about trend systems and what some managers say publicly.
We've identified two underlying drivers for the performance difference. The first driver is differences in timing and signaling between our system and most trend followers. Most trend followers use various moving average or break out style systems. We generate our signals using statistical forecasting techniques. Additionally, we auto-optimize our model parameters based on trailing market conditions. During long trends we find that we achieve similar returns as other systems. We do find that during some trend reversals or during extreme weekly moves our system will often reverse faster than some of these other systems. Considering this is a feature of our process we are happy with performance differences that are driven by our forecasting process.
The second driver of performance difference is lack of diversification across underlying contracts. Due to liquidity issues with some options we reduced our actively traded underlying contracts to 10 by the end of the year. Many large CTAs will trade well over 50 different underlying contracts. One of our goals for 2020 is to add at least 5 more underlying contracts to the system. We believe this additional diversification will improve our risk adjusted return over 2020.


There are no comments to display.
Join the conversation
You can post now and register later. If you have an account, sign in now to post with your account.
Note: Your post will require moderator approval before it will be visible.