

SteadyOptions is an options trading forum where you can find solutions from top options traders. Join Us!

We’ve all been there… researching options strategies and unable to find the answers we’re looking for. SteadyOptions has your solution.

Steady Futures 2019 Year in Review


Steady Futures began trading the 50K portfolio in July 2019. It produced a 8.5% return during its 6 months of performance (18.0% annualized). We had three goals when we developed this system. First, we wanted a robust system that benefits from turmoil in the markets.

Second, we were targeting negative correlation with the broader stock indexes to maximize the diversification benefits for people using this system as part of a broader portfolio. Third, we wanted to make trading the system predictable from a time standpoint.
 

To accomplish these three objectives we built a mechanical trend following system using options on futures contracts that signals every Friday morning. The system is always in the market. To manage risk across all the contracts we use at the money option debit spreads targeting an overall delta based on the variation of the underlying future. We are currently trading 10 underlying commodity and financial futures. Like all trend systems we expected the overall returns to be positive, but the month to month performance to be lumpy with occasional large winning months.


In the following table I show the monthly performance of the trend system since July compared to the SocGen Trend Followers Index and the S&P 500.The cumulative return on the Steady Futures portfolio for the 6 month period is 8.5% versus 1.6% for the SocGen Trend Followers Index. Additionally, our returns were non-correlated to the S&P 500 index returns. Trend following systems often perform poorly during stock bull markets. Considering this tendency we are very happy with the performance of the system over this period.
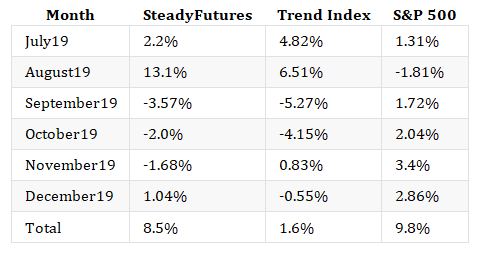
image.png

Our win rates are in line with expectations. As a reminder, trend systems tend to have low win rates but larger wins than losses. Some successful trend systems have win rates as low as 40%.
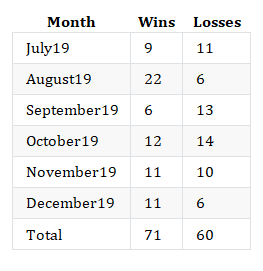
 

image.png

Changes to the System for 2020

It is important to think about what the sources of the performance difference between our system and the trend followers index are, and whether we are happy with those performance differences. While it is hard to quantify these drivers (we don't know exactly what or how others are trading) we can make some reasonable assumptions based on what we know about trend systems and what some managers say publicly.
 

We've identified two underlying drivers for the performance difference. The first driver is differences in timing and signaling between our system and most trend followers. Most trend followers use various moving average or break out style systems. We generate our signals using statistical forecasting techniques. Additionally, we auto-optimize our model parameters based on trailing market conditions. During long trends we find that we achieve similar returns as other systems. We do find that during some trend reversals or during extreme weekly moves our system will often reverse faster than some of these other systems. Considering this is a feature of our process we are happy with performance differences that are driven by our forecasting process.


The second driver of performance difference is lack of diversification across underlying contracts. Due to liquidity issues with some options we reduced our actively traded underlying contracts to 10 by the end of the year. Many large CTAs will trade well over 50 different underlying contracts. One of our goals for 2020 is to add at least 5 more underlying contracts to the system. We believe this additional diversification will improve our risk adjusted return over 2020.


What Is SteadyOptions?

12 Years CAGR of 114.5%

Full Trading Plan

Complete Portfolio Approach

Real-time trade sharing: entry, exit, and adjustments

Diversified Options Strategies

Exclusive Community Forum

Steady And Consistent Gains

High Quality Education

Risk Management, Portfolio Size

Performance based on real fills

Subscribe to SteadyOptions now and experience the full power of options trading!
Subscribe

Non-directional Options Strategies

10-15 trade Ideas Per Month

Targets 5-7% Monthly Net Return

Visit our Education Center

Recent Articles

Articles

  • Optimizing Portfolio Growth: Managing Capital and Liabilities in Modern Tax Planning

    Growing your investment portfolio involves more than just picking winners. While strong returns are the goal, many investors overlook a critical factor that significantly impacts their net worth: tax planning. Managing your capital and liabilities with taxes in mind isn't just about saving money in April. It's a year-round strategy that can accelerate your portfolio's growth and help you keep more of what you earn.

    By Kim,

    • 0 comments
    • 537 views
  • Expanded Trading Hours for Select Equity Options

    The Cboe Options Exchange will start offering expanded trading hours for select high-liquidity single-stock equity options. The schedule features a morning Global Trading Hours (GTH) session from 7:30 a.m. to 9:25 a.m. ET and an afternoon Curb session from 4:00 p.m. to 4:15 p.m.

    By Kim,

    • 0 comments
    • 628 views
  • How LEAPS Differ From Short-Term Options

    LEAPS stands for Long-Term Equity Anticipation Security. Which is just a long-dated option, typically referring to those with expirations more than a year out. There’s no technical difference between LEAPS and shorter-term options other than the expiration date. They’re traded on the same exchanges and have the same rules surrounding margin and whatnot.

    By Pat Crawley,

    • 0 comments
    • 31205 views
  • Why Not to Hold Strangles Through Earnings

    In my previous article, I described a strategy of buying a long strangle a few days before earnings and selling them just before earnings. In this article, I will show why it might be not a good idea to keep those strangles through earnings.

    By Kim,

    • 0 comments
    • 6093 views
  • Pre-Earnings Entry Price: What 31,000 Cycles Say

    Every card in the scanner carries a block called How expensive is this entry? It compares what you would pay today against what the same setup cost on the same ticker at the same point in past cycles. I built that block in August. It reads well. But a reading that looks sensible and a reading that predicts something are different things, and until last week I had only the first.


    By Romuald,

    • 3 comments
    • 672 views
  • Expensive Compared to What?

    A trader looks at a pre-earnings straddle and asks whether it is expensive. It is the right instinct and the wrong question, because the word carries no meaning on its own. Expensive against what? A $12 straddle on a $200 stock is not expensive or cheap. It is $12.

    By Romuald,

    • 0 comments
    • 550 views
  • Beyond Strategies: What Options Traders Should Know

    Options education almost always begins with structures. Traders learn vertical spreads, calendars, butterflies, condors, covered calls and straddles, study the expiration diagrams, work out maximum profit and loss, and build a sense of the conditions each structure is supposed to suit. That foundation is necessary and there is no way around it.

    By Kim,

    • 0 comments
    • 1086 views
  • SPX vs SPY Options: Which One Should You Trade? (2026 Guide)

    Both SPX and SPY options give you exposure to the S&P 500. They track the same 500 stocks, move nearly tick-for-tick, and offer the same core strategies — credit spreads, iron condors, butterflies, and 0DTE trades. Yet the two products settle differently, are taxed differently, and carry very different assignment risks.

    By krisbee,

    • 0 comments
    • 5196 views
  • Strike Price Effects Or Pinning Revisted

    Loyal readers of this blog will recall my post from 2019 “Pinning Down the ‘Option Pinning’”. If you have not heard of pinning have a look at that article as – spoiler – everything in it as well as Jeff Augen’s observations in his books which are referenced is still valid.

    By TrustyJules,

    • 0 comments
    • 2344 views
  • Could This Strategy Be The Holy Grail Of Investing?

    This is a reprint of my Seeking Alpha article from 2013. If you have SA subscription, you can read the full article including hundreds of comments here. For the record, the strategy implementation has changed since then, but the principle remains the same. You can read more here

    By Kim,

    • 6 comments
    • 5764 views

  Report Article


We want to hear from you!


There are no comments to display.


Join the conversation

You can post now and register later. If you have an account, sign in now to post with your account.
Note: Your post will require moderator approval before it will be visible.

Guest
Add a comment...

×   Pasted as rich text.   Paste as plain text instead

  Only 75 emoji are allowed.

×   Your link has been automatically embedded.   Display as a link instead

×   Your previous content has been restored.   Clear editor

×   You cannot paste images directly. Upload or insert images from URL.

Loading...