.thumb.jpg.7dc56df7b82f0336a9ac9a05b2775f21.jpg)
That's great, because it means there is discord, and discord, especially for Apple ahead of earnings has meant a repeating pattern for the clever trader to take advantage of.
One week before Apple's earnings would be January 25th, 2018.
Apple's Disagreement
Sometimes a bullish momentum bet works great -- and in fact, for Apple that has been a strong pattern ahead of earnings. But with a toppy market, sometimes a different approach can work as well.
It turns out, over the long-run, for stocks with certain tendencies like Apple Inc, there is a clever way to trade market anxiety or market optimism before earnings announcements with options.
This approach has returned 189% with 10 wins and 2 losses over the last 3-years.
The Trade Before Earnings
What a trader wants to do is to see the results of buying a slightly out of the money strangle one-week before earnings, and then sell that strangle just before earnings.
Here is the setup:

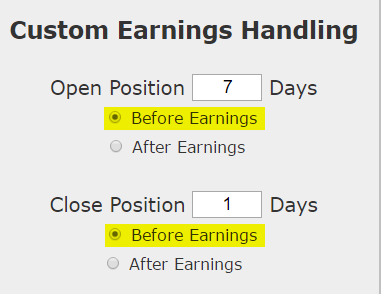
We are testing opening the position 7 calendar days before earnings and then closing the position 1 day before earnings. This is not making any earnings bet. This is not making any stock direction bet.
Once we apply that simple rule to our back-test, we run it on a 40-delta strangle, which is a fancy of saying, buying both the 40-delta call and 40-delta put, for a non-directional bet on volatility.
Returns
If we did this long strangle in Apple Inc (NASDAQ:AAPL) over the last three-years, but only held it before earnings, using the options closest to 14 days from expiration, we get these results:
|
AAPL Long 40 Delta Strangle |
|||
| % Wins: | 83.3% | ||
| Wins: 10 | Losses: 2 | ||
| % Return: | 189% | ||
Tap Here to See the Back-test
The mechanics of the TradeMachine™ are that it uses end of day prices for every back-test entry and exit (every trigger).
We see a 189% return, testing this over the last 12 earnings dates in Apple Inc.
We can also see that this strategy hasn't been a winner all the time, rather it has won 10 times and lost 2 times, for a 83.3% win-rate on an one-week trade.
Setting Expectations
While this strategy has an overall return of 189%, the trade details keep us in bounds with expectations:
➡ The average percent return per trade was 16.9% over 7-days.
➡ The average percent return per winning trade was 21.8% over 7-days.
➡ The average percent return per losing trade was -7.6% over 7-days.
We like the comfort of a trade that, when it loses, it isn't a disaster -- at least not historically.
Option Trading in the Last Year
We can also look at the last year of earnings releases and examine the results:
|
AAPL Long 40 Delta Strangle |
|||
| % Wins: | 100% | ||
| Wins: 4 | Losses: 0 | ||
| % Return: | 98.2% | ||
Tap Here to See the Back-test
In the latest year this pre-earnings option trade has 4 wins and lost 0 times and returned 98.2%.
➡ Over just the last year, the average percent return per trade was 22.3% over 7-days.
WHAT HAPPENED
We don't always have to look at bullish back-tests in a bull market -- sometimes a straight down the middle volatility pattern pops up. This is it -- this is how people profit from the option market -- finding trading opportunities that avoid earnings risk and work equally well during a bull or bear market.
To see how to do this for any stock we welcome you to watch this quick demonstration video:
Tap Here to See the Tools at Work
Risk Disclosure
You should read the Characteristics and Risks of Standardized Options.
Past performance is not an indication of future results.


There are no comments to display.
Join the conversation
You can post now and register later. If you have an account, sign in now to post with your account.
Note: Your post will require moderator approval before it will be visible.