SteadyOptions is an options trading forum where you can find solutions from top options traders. Join Us!

We’ve all been there… researching options strategies and unable to find the answers we’re looking for. SteadyOptions has your solution.

Performance Reporting: The Myths and The Reality


It never stops to amaze me. I'm talking about the creativity of some options "guru" when it comes to presenting their track record. "Maximum profit potential", "Cumulative return", "90% winning ratio", "Annualized return" are just few of the tricks used in the industry to entice you into joining their website. This article describes some of the tricks used to make performance numbers much better than they are.

"Maximum profit potential"


Few days ago one of the options service providers sent a summary of his 2012 performance, bragging about ~42% average return per trade. A quick look on his website reveals how he calculates his returns: "The highest price the option achieves is recorded as the result since this was historically what the option price reached."


Did you get that? Is anyone really able consistently to sell at the top, or even close? Pro-Trading-Options, an independent source which tracks performance of few hundred newsletters, actually stopped tracking this service because they track only profitable services. Turns out that based on real (auto-trading), not hypothetical results, not only the performance was not nowhere near 42% average return, but the service was actually not profitable.


Calculating gains based on cash and not on margin


This is one of the most outrageous frauds. This is how it works:


One of the services makes a lot of risk reversal trades. A risk reversal involves selling a put and using the proceeds to buy a call (or vice versa). The track record includes many 100% losers, but also some ridiculous triple digit returns like 757%, 780% or even 1,150%.You would think that those returns would more than offset the 100% losers.


Out of curiosity, I decided to check how they calculated those returns. The 1,150% trade involved buying a $18 call and selling a $18 put for a net cost of $0.04, and closing the trade for $0.50. 1,150%? Not so fast. What they "forgot" to tell us is that selling naked put involves a margin of ~$450 per spread, so $46 gain is really 10% gain and not 1,150%. No wonder they are able to present "4,344% cumulative return since 2007".


"Cumulative return"


There are a lot of services which make only one trade per month (or per week), yet they present their results as "350% cumulative return since inception". While technically this is correct, does it mean anything? Would you be comfortable placing your whole portfolio (or even half of it) into one weekly Iron Condor?


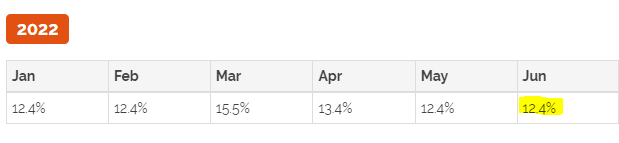
For example, here is a screenshot from one of the services, so you can see how they report returns:

Monthly returns:

image.png


Detailed trades:

image.png

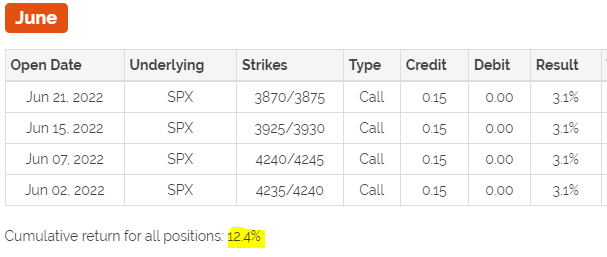
Of course most people won't look on detailed trades (they are not easily visible like our trades) so they would think that the service makes 12-15% on a regular basis..


When a newsletter claims a 1,000% return for the year, wouldn't you assume that if you started the year with $10,000 and invested in all the recommendations given on the site, they would now have $100,000? But this is not the case. A lot of services calculate their yearly return by adding together all the individual returns on each trade recommended for the year.


So, for instance, if a website recommended 100 trades for the year and each trade made 10%, they would claim they made 1000% for the year.


The problem is that the returns on trades that overlap cannot be added together. If a service has 5 open positions and each position made 10%, did they make 50%? Of course not, because you could allocate only 20% to each position. So your overall return was 10%, not 50%.


Holding losing positions indefinitely


Many sites claiming unbelievable win ratios hold trades that move against them for many months while new recommendations continue to be given during that time. To you, it really doesn't matter what other trades are recommended during that time or what alleged returns are made because your capital is tied up.


One service that does one trade a month had a losing trade at the beginning of the year that was held the entire year and ultimately closed at the end of the year for a breakeven trade. Yet, during that entire time, new trades were opened each subsequent month. So, they reported a 100% win ratio and a very good return for the year.


The problem is that, realistically, you would not have made a dime since all your capital would have been tied up in the losing trade all year.


Resetting past returns after a large drawdown


One service we know of posts hypothetical results that change each time the service has a bad month. What happens is, when a bad month occurs, they just fix the bad month and post new past performance numbers.


Another service has 10 trading programs. When one of the programs has a large drawdown, they simply close or rename it so new members don't see past results. Needless to say that no track record is posted on the website.


Having too many open trades


Some services claim to have a certain maximum of trades and base the performance on this number. In reality, they open much more trades. There is a service that bases their track record on maximum of 10 open trades and $10,000 portfolio, so members would allocate 10% per trade. In reality, they might have as many as 16-18 trades, with average trade value around $1,400. They have two separate trades in the Open positions section: active trades and "other" open positions. The "other positions are " trades that are still open in the portfolio but are down over 50%. They are on “hold” but are not worth mentioning until they turn around."


Needless to say, most of the time those trades don't turn around and end up being 100% losers. Meanwhile, they tie up the capital, but the service continues opening new trades way beyond the maximum number of 10 positions. In fact, with average value of $1,400 and $10,000 portfolio, they should not open more than 7 trades - in reality, they have double most of the time. This is how they were able to claim 700% return in 2012.


"90% winning ratio"


You will see a lot of services advertising 90% winning ratio. Let me tell you a little secret: some strategies (like selling far OTM credit spreads) have built-in probability of success of 90%. The tradeoff is that the gains are usually very small (3-4%) and you need to hold 3-4 weeks to get that gain. So you win 9 out of 10 trades and lose one time - the big question is how much do you lose on that losing trade. If you made 4% nine times but lost 70% one time, the overall return is negative. Conclusion: winning ratio by itself means nothing. The only thing that matters is the total return.


Annualized return


When used correctly, an annualized return is the average annual return over a period of more than one year.


When used incorrectly, annualized means "we had a good trade so if we continue to make these exact same returns in this same amount of time, we will make X amount by the end of the year."


When someone makes a 10% in one week, they can advertise an annualized return of 500%. To achieve that return, they will have to repeat this 10% return every single week. Does anyone believe this is possible?


How does SteadyOptions present performance?


SteadyOptions does not use any of those dirty tricks. This is how we present our performance:

  • The performance numbers are based on real fills, not hypothetical or backtested trades, and definitely not on "profit potential".
  • We report returns on the whole portfolio, not on what was on risk.
  • We base the model portfolio on 10% allocation per trade which leaves at least 40% of the portfolio in cash.
  • All our trades are clearly presented on the performance page.
  • We base the returns on the required margin, not on cash.
  • We always mention that the returns do not include commissions.


Be aware of those tricks before giving your hard earned money to crooks!


Start Your Free Trial


Related Articles:
Why Retail Investors Lose Money In The Stock Market
Are You Ready For The Learning Curve?
Can you double your account every six months?
How to Calculate ROI in Options Trading

What Is SteadyOptions?

Full Trading Plan

Complete Portfolio Approach

Real-time trade sharing: entry, exit, and adjustments

Diversified Options Strategies

Exclusive Community Forum

Steady And Consistent Gains

High Quality Education

Risk Management, Portfolio Size

Performance based on real fills

Subscribe to SteadyOptions now and experience the full power of options trading!
Subscribe

Non-directional Options Strategies

10-15 trade Ideas Per Month

Targets 5-7% Monthly Net Return

Visit our Education Center

Recent Articles

Articles

  • SPX Options vs. SPY Options: Which Should I Trade?

    Trading options on the S&P 500 is a popular way to make money on the index. There are several ways traders use this index, but two of the most popular are to trade options on SPX or SPY. One key difference between the two is that SPX options are based on the index, while SPY options are based on an exchange-traded fund (ETF) that tracks the index.

    By Mark Wolfinger,

    • 0 comments
    • 453 views
  • Yes, We Are Playing Not to Lose!

    There are many trading quotes from different traders/investors, but this one is one of my favorites: “In trading/investing it's not about how much you make, but how much you don't lose" - Bernard Baruch. At SteadyOptions, this has been one of our major goals in the last 12 years.

    By Kim,

    • 0 comments
    • 904 views
  • The Impact of Implied Volatility (IV) on Popular Options Trades

    You’ll often read that a given option trade is either vega positive (meaning that IV rising will help it and IV falling will hurt it) or vega negative (meaning IV falling will help and IV rising will hurt).   However, in fact many popular options spreads can be either vega positive or vega negative depending where where the stock price is relative to the spread strikes.  

    By Yowster,

    • 0 comments
    • 806 views
  • Please Follow Me Inside The Insiders

    The greatest joy in investing in options is when you are right on direction. It’s really hard to beat any return that is based on a correct options bet on the direction of a stock, which is why we spend much of our time poring over charts, historical analysis, Elliot waves, RSI and what not.

    By TrustyJules,

    • 0 comments
    • 480 views
  • Trading Earnings With Ratio Spread

    A 1x2 ratio spread with call options is created by selling one lower-strike call and buying two higher-strike calls. This strategy can be established for either a net credit or for a net debit, depending on the time to expiration, the percentage distance between the strike prices and the level of volatility.

    By TrustyJules,

    • 0 comments
    • 1,492 views
  • SteadyOptions 2023 - Year In Review

    2023 marks our 12th year as a public trading service. We closed 192 winners out of 282 trades (68.1% winning ratio). Our model portfolio produced 112.2% compounded gain on the whole account based on 10% allocation per trade. We had only one losing month and one essentially breakeven in 2023. 

    By Kim,

    • 0 comments
    • 5,903 views
  • Call And Put Backspreads Options Strategies

    A backspread is very bullish or very bearish strategy used to trade direction; ie a trader is betting that a stock will move quickly in one direction. Call Backspreads are used for trading up moves; put backspreads for down moves.

    By Chris Young,

    • 0 comments
    • 9,501 views
  • Long Put Option Strategy

    A long put option strategy is the purchase of a put option in the expectation of the underlying stock falling. It is Delta negative, Vega positive and Theta negative strategy. A long put is a single-leg, risk-defined, bearish options strategy. Buying a put option is a levered alternative to selling shares of stock short.

    By Chris Young,

    • 0 comments
    • 11,149 views
  • Long Call Option Strategy

    A long call option strategy is the purchase of a call option in the expectation of the underlying stock rising. It is Delta positive, Vega positive and Theta negative strategy. A long call is a single-leg, risk-defined, bullish options strategy. Buying a call option is a levered alternative to buying shares of stock.

    By Chris Young,

    • 0 comments
    • 11,530 views
  • What Is Delta Hedging?

    Delta hedging is an investing strategy that combines the purchase or sale of an option as well as an offsetting transaction in the underlying asset to reduce the risk of a directional move in the price of the option. When a position is delta-neutral, it will not rise or fall in value when the value of the underlying asset stays within certain bounds. 

    By Kim,

    • 0 comments
    • 9,673 views

  Report Article

We want to hear from you!


ha some of these are new to me.

I also like to look at '4000% per year for 10 years running etc.' claims as I know it's simply impossible and if they'd be making that they wouldn't need to sell subscriptions at 50 bucks a month for it. But it amuses me how people manipulate their results in more or less outrageous manner. Shame for the people that fall for it though and not only lose their subscription fee but also their accounts to these guru's

I think the perfect performance reporting for me was if someone would actually stick 10,000$ into an IB account and trade every trade he recommends on his/her service there and puts up the performance reports that IB offers for every one to see. Would make all of the above tricks impossible.

In essence that is what subscribers do (trade a 10k$ account (the numbers can be multiplied for larger accounts) so they can see how their account would have changed after a year - 10,000$ on Jan 1st - what do I have now? if its 11,000$ you can tell me all you want about 100's% of cumulative performance etc. I know you made 1k. Simple, honest, no room for interpretation and you can see how the strategy actually works in 'the real world'.

Will probably never be used by any newsletter though...

Share this comment


Link to comment
Share on other sites

Why so complicated ?

Net Liq ! It include everything  you need. If Net Liq rise you are on profit if not you are losing money. As simple as that!

Record your Net Liq every 1st dayy of the month and you easily will calculate monthly return. Same for any period you want. Everything else is BS! 

Share this comment


Link to comment
Share on other sites

Well, this is exactly my point. If your starting Net Liq is 100k and you make one trade per month that makes 10%, and someone claims that the monthly return is 10%, you expect Net Liq to be 110k, right? But this assumes allocating the whole portfolio to that single trade. Which is absurd.

Share this comment


Link to comment
Share on other sites

Why then you use ROI ? WHy you not report your monthly return based on monthly change of your Net Liq?

Share this comment


Link to comment
Share on other sites

I do NOT use ROI. I use return on the whole account, based on 10% allocation per trade, which reflects change of Net Liq (excluding commissions).

Share this comment


Link to comment
Share on other sites


Create an account or sign in to comment

You need to be a member in order to leave a comment

Create an account

Sign up for a new account. It's easy and free!


Register a new account

Sign in

Already have an account? Sign in here.


Sign In Now

Options Trading Blogs