
Absolute momentum is often referred to as trend following or time-series momentum. We highly recommend those who want to go further in depth in to momentum trading strategies to pick up Gary Antonacci’s book, DualMomentum Investing: An Innovative Strategy for Higher Returns with Lower Risk.
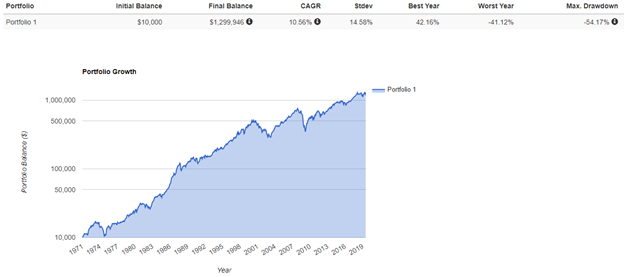
We will start by creating a benchmark global equity portfolio that is equally allocated to US large cap stocks and International stocks. The benchmark portfolio is rebalanced annually. Our analysis period is 1971–06/2019 which includes three substantial bear markets (1973-1974, 2000-2002, and 2008-2009), along with one of the most prolific bull market runs in recent history from 1982–1999.
Historical data represents index data. You cannot invest directly in an index. Indexes do not include fees, expenses, or transaction costs. All examples are hypothetical. Past performance does not guarantee future results.
Since 1971 our benchmark portfolio has produced double digit annual returns with a Compound Annual Growth Rate (CAGR) of 10.56%, enough to grow $10,000 to $1,299,946. Global equity markets have provided a substantial risk premium to investors who have been able to stay the course. But staying the course is the issue for most investors as even a globally diversified equity portfolio has experienced drawdowns approaching or exceeding 50% on multiple occasions.
Drawdown measures the maximum amount of money lost from equity peak to valley. Taking our data back further, during the Great Depression US stocks experienced a drawdown exceeding 80%. Very few investors have the stomach lining to accept these kinds of drawdowns without abandoning a buy and hold investment plan. Painful losses in 2008 are still present in the minds of many evidenced by several studies showing how few investors have actually participated in the US stock market rally since 2009.
The conventional wisdom for dampening equity market risk is adding a permanent allocation of bonds to a portfolio. 60% stocks and 40% bonds is still the benchmark portfolio today. Unfortunately, permanently allocating a portion of a portfolio to low risk bonds lowers expected returns, particularly in today’s historically low interest rate environment. This makes sense since conventional wisdom tells us that less risk equals less expected reward.
An alternative to buy and hold first discovered in the 1930's is what many in finance call momentum. Momentum refers to the tendency for assets that have recently outperformed to continue outperforming in the near future. For example, if US stocks have outperformed International stocks over the past year this is likely to continue in the near future. In 1937 Cowles and Jones shared their findings that “taking one year as the unit of measurement for the period 1920 to 1935, the tendency is very pronounced for stocks which have exceeded the median in one year to exceed it also in the year following.” Hundreds of academic papers have confirmed the existence of momentum for decades, even centuries, across asset classes and around the world. Momentum is persistent and pervasive yet largely misunderstood and unused by investors of all size.
Instead of equally allocating to a permanent allocation of US large cap stocks and International stocks, our first example of momentum investing will invest in whichever of the two had the highest return over the prior twelve months. The position will be held for one month, and then reassessed. Researchers often refer to this method as relative strength momentum.
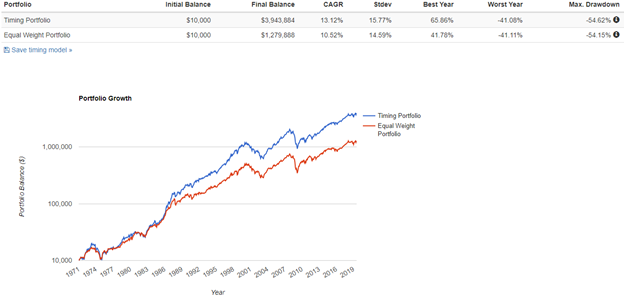
The findings of Cowles and Jones from 1920-1935 have continued to persist nearly eighty years after their discovery. Our relative strength momentum model increased returns by almost 3% per year. Now, instead of a $10,000 investment growing to $1,279,888 it grows to $3,943,884 over the same period. Many investors are unaware of how seemingly modest improvements in annualized return can make a meaningful difference over a long period of time to ending wealth. But we still have to deal with the pain factor (drawdowns), and our data shows that relative momentum does nothing to reduce bear market risk as maximum drawdown was essentially unchanged.
We already know very few investors can take the punishment of a 55% drawdown and are normally advised to reduce equity market exposure in exchange for lower returning assets such as cash and bonds. Studies have shown how investors feel the pain of loss twice as strongly as the pleasure from an equivalent gain. Jason Zweig’s research found that financial losses are processed in the same part of the brain that responds to mortal danger. This is something we can’t ignore because the right investment plan for a prudent investor is the one they can stick with for the long term even if that results in a lower expected return. Investing heavily in equities and hoping that 50%+ bear market drawdowns won’t happen again is risky. The reason stocks tend to produce high long term rewards is because of their inherent risk. Bear markets will occur again, to think otherwise is ignoring history.
More recently, researchers have been studying the benefits of combining relative momentum with what many practitioners call absolute momentum, or time-series momentum. Many commodity trading advisors (CTA’s) have been practicing absolute momentum in the form of trend following for decades with significant success. Absolute momentum acts as a risk management tool where you compare returns of an asset to itself instead of relative to other risk assets. For example, if US Stocks have a negative excess return over the prior twelve months there is also a strong likelihood of negative returns continuing in the near future. Buying tends to attract more buying just as selling attracts more selling. A sensible rules based approach is to then seek safety in the form of cash or high quality intermediate term bonds until stock returns again become positive over the prior year.
So we will now combine relative momentum with absolute momentum where each month we chose among the two equity markets, and if neither have positive excess returns (asset return minus the risk free return of treasury bills) over the past year we will allocate to bonds for the next month instead. No predictions, opinions, or forecasts necessary. The fact that our model has no discretionary inputs is an important and refreshing distinction from traditional active portfolio management. Philip Tetlock spent two decades quantifying “expert” predictions finding that the vast majority performed worse than random chance when it came to predicting the likelihood of an outcome.
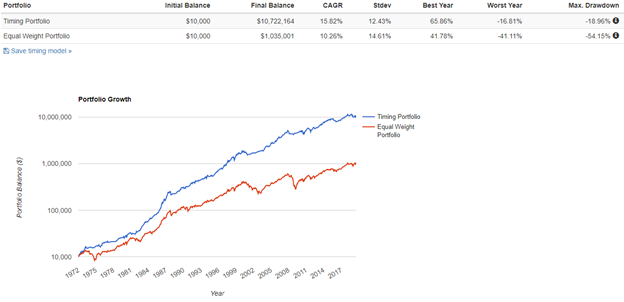
Our dual momentum approach of combining relative and absolute momentum has outperformed our equally allocated global stock market benchmark by about 5% annually since 1971. This now grows a $10,000 investment to $10,722,164. But perhaps more important to most investors is that dual momentum reduced the maximum drawdown by more than half due to the effect of our absolute momentum rule partially sidestepping the three major equity bear markets of 1973-1974, 2000-2002, and 2008-2009. Dual momentum has shown the ability to be used as a simple rules-based method to produce higher returns with less risk than buy and hold.
So what does this information mean to you? We wrote this paper to provide a simple example of one of our favorite methods we use within client portfolios. Most of our clients aren’t interested in every detail, only enough detail to increase investor confidence. As an independent investment advisory firm we have the freedom and flexibility to implement compelling research for our clients. Advisors captive to sales-based production requirements are often incentivized to provide proprietary products instead of conducting robust investment research that can benefit both the client and the advisor over the long term.
This simple dual momentum method could also be a fantastic strategy for a portion of one’s 401k or other employer retirement accounts. On average, less than 2 trades occur per year so total time commitment may be around 5-10 minutes per month with most months requiring no action. More complex methodologies could certainly be pursued, but we believe simple beats complex over the long term. Leonardo da Vinci once said “Simplicity is the ultimate sophistication.”
Jesse Blom is a licensed investment advisor and Vice President of Lorintine Capital, LP. He provides investment advice to clients all over the United States and around the world. Jesse has been in financial services since 2008 and is a CERTIFIED FINANCIAL PLANNER™ professional. Working with a CFP® professional represents the highest standard of financial planning advice. Jesse has a Bachelor of Science in Finance from Oral Roberts University. Jesse manages the Steady Momentum service, and regularly incorporates options into client portfolios.


Join the conversation
You can post now and register later. If you have an account, sign in now to post with your account.
Note: Your post will require moderator approval before it will be visible.