SteadyOptions is an options trading forum where you can find solutions from top options traders. Join Us!

We’ve all been there… researching options strategies and unable to find the answers we’re looking for. SteadyOptions has your solution.

Harnessing Monte Carlo Simulations for Options Trading: A Strategic Approach


In the world of options trading, one of the greatest challenges is determining future price ranges with enough accuracy to structure profitable trades. One method traders can leverage to enhance these predictions is Monte Carlo simulations, a powerful statistical tool that allows for the projection of a stock or ETF's future price distribution based on historical data.

In this article, I'll introduce Monte Carlo simulations, explain their relevance in trading, and describe a specific options trading strategy I've developed using these simulations. I'll also share backtested results to illustrate the strategy's effectiveness.
 

1. What Are Monte Carlo Simulations?

Monte Carlo simulations are a computational technique used to model the probability of different outcomes in a process that cannot easily be predicted due to the presence of random variables. Named after the famed casino, these simulations are especially useful in finance because they allow for the analysis of uncertainty and risk.
 

The process involves running thousands or even millions of simulations based on historical price movements, where each simulation projects a possible future outcome. The resulting distribution provides traders with probabilities of price ranges over a given time horizon.
 

2. How Are Monte Carlo Simulations Applied in Trading?

In trading, Monte Carlo simulations help to anticipate how a financial instrument, such as an ETF like SPY or QQQ, might behave over a future period. The process looks back over several years of historical price data and runs numerous simulations to project future price distributions. The outputs typically show a probability distribution of future prices, highlighting key metrics such as confidence intervals.Here is an example for SPY:
 

image.thumb.png.9260abff4362ec74931bec8731c7d2fb.png

These simulations are invaluable for options traders because they offer insights into the probability that a stock or ETF will remain within above/below price bounds over a specific time frame. This information helps to craft structured options strategies, like Credit Put Spreads, which profit when an asset stays above a price threshold.
 

3. Example for a Credit Put Spread

Here for example is the result of 10,000 simulations carried out on SPY for a prediction of the movement in 15 days by asking the algorithm to calculate what percentage of data is above the $565 threshold. For example if we consider that this value is a support or that this value would be the break even of a Credit Put Spread strategy that we would have implemented. 
 

AD_4nXfENJntFGHmW0zyrXlIlUN41xiNCiEJdu0GOoQBnhi-jEw-aYkwlBiKCPkJf2tFFa_xmiMwur_teF2EesJoI3tCdMgVjmjpeGGToJ6hganEk0Lu5FiZgJEX7IJIGCd9xnfl9J9dmkGnlCqeWeGWBD8FxQxy?key=mV-fneavtr8H-pPyQtcuKg

We see that there is a probability of 77% that the ticker is above this threshold value.
 

Recall that Monte Carlo simulations observe the past behavior of the ticker over many years, day after day, deduce a statistical distribution and perform random shots oriented like this statistical distribution in order to capture the pseudo-random nature of the market. It will be necessary to see how these predictions have come true in the past.
 

Note that to account for the historical distribution of a ticker, we need to adjust the Monte Carlo simulation approach in the code. Rather than assuming a normal distribution for price movements, I model price changes based on the actual historical distribution of returns. This technique, often called bootstrapping, samples historical returns directly instead of generating synthetic returns based on a fixed normal distribution.


This is then the kind of plot we get :

image.thumb.png.75321f45998da807cb62adfc4d6a4910.png
 

4. The Strategy: Using Monte Carlo Simulations for Options Trading

Using the break evens of an Iron Condor as threshold values is not interesting because the simulations showed that credits received on the Call part were not sufficient. 
 

So let's focus on the Put part via Credit Put Spreads. For a given ETF (we will leave out stocks because of the earnings), there are many expiration dates and many strikes, each with their own price. Which ETF to choose, which strikes to buy and sell and which expiration dates? 


For this, the program I wrote scans the most important ETFs, ['SPY','GLD','QQQ','IWM','EEM'], all their expiration dates between two numbers of days [min_days = 30 max_days = 120] and all strikes below the OTM strike that can form a Credit Put Spread. A point is thus given by, for example, [SPY, 2024-11-15, put bought=$577, put sold=$582]. 


For each point, the code then performs 10,000 Monte Carlo simulations, looking back 20 years and calculating the probability that the SPY close will be higher than the break even in 29 days (=number of days remaining between now and the expiration date). Then, the program displays all the points in the form of a graph with, on the abscissa, the perceived credit and on the ordinate, the Monte Carlo probability. Credit > $0.50 and gain/loss ratio above 40% are only selected.
 

The graph is divided into 4 quadrants, the one of most interest to us being the northeast quadrant (maximum credit and maximum probability). The program then detects the two points which, in this quadrant, have the highest probability or the highest credit.
 

Here is an example of display:
 

AD_4nXf3Xt3nrf-XNzDxEBOJA11gFC4EIYj49tTMG4M6aigxpLpHjD-DlZGSCeeeiTdnnyjP3nyq4Dizst7KBTpd3vC1bgZXjc1c2b-IfrL9tIZZDNd30K_C16u57aay69NdrQoEJ74OFxouK8cFsXzdrXiqlf8a?key=mV-fneavtr8H-pPyQtcuKg

AD_4nXcPep-3MOCV0_jdYwbF08T2c90g0qIgECgrQBmu_OmFQhTJVDUt1KhF1uv5wYLOz0GzxF8OfQsub1uVqwlWSWv-3Y-O_r8iLthiDPzx5Qj9aDJ0Zjluroc31ijhOOYYiQAAD5oIoDAARR68udJtBCf_wdI4?key=mV-fneavtr8H-pPyQtcuKg

4. Backtesting Results

To validate this strategy, we performed backtests using historical data for the past 15 years. The idea was to simulate what would have happened if this strategy had been applied in the past with the break even corresponding to the probability computed in the chosen point. 
 

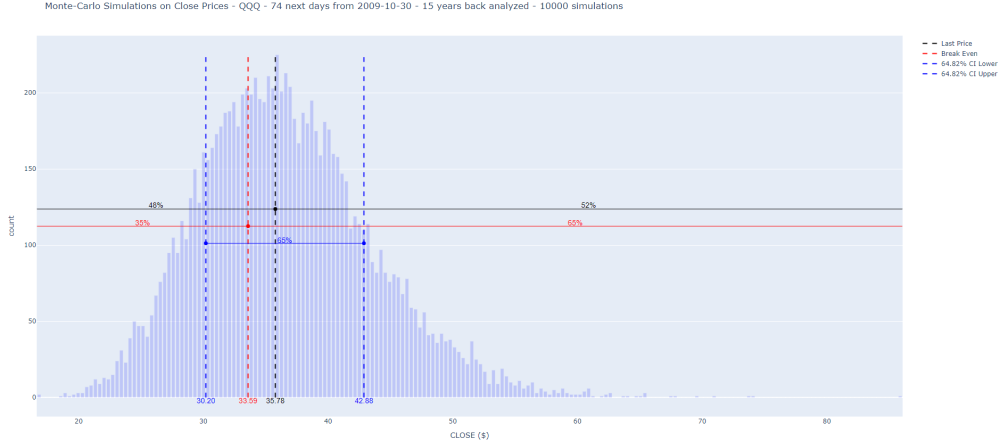
To use the example here above with the maximum credit,the backtest would answer this question: for the ticker QQQ at the expiration date of 2024-12-31 (corresponding to 74 days from now, the date of writing this article), the Monte Carlo simulations tell me that the Close of QQQ has a probability of 64.82% of being higher than the strategy's break even. If I had applied this strategy 15 years in the past from now, day after day with the Break Even at that time corresponding to this quantile, would the real value of QQQ have indeed been higher than this Break Even? And if so, how many times has it worked between 15 years ago and now, day after day?
 

To be more specific, during the backtest the algorithm displays the results of the step-by-step backtests very clearly:
 

Example of a screenshot during the backtest:

image.png.ab0bd2f2f41917952468d4247a22400e.png

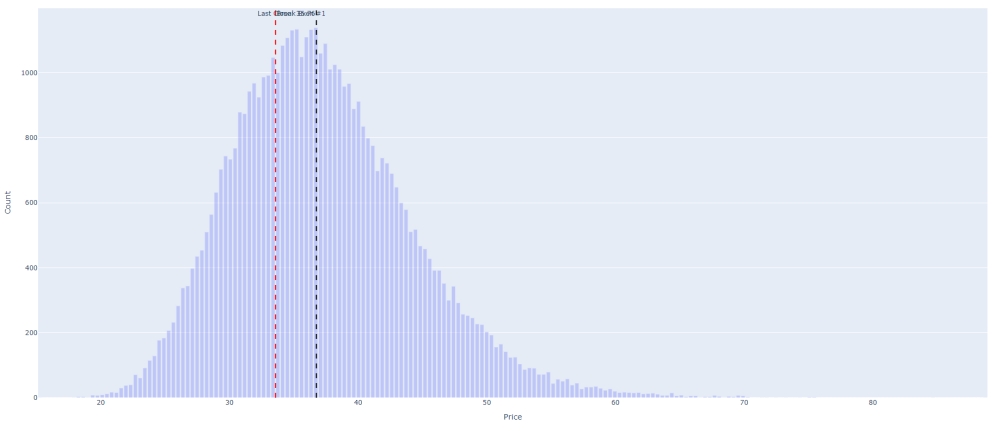
and the plot of the histogram to prove the consistency of the threshold value:
 

image.thumb.png.71775e4bdaf1a8321127ba02bd84409e.png

This systematic approach, with precise risk management, provides traders with a powerful tool to make informed decisions about structuring options trades. It's worth noting that the performance of each strategy can vary depending on market conditions, so consistent backtesting is key to keeping the strategy profitable in evolving markets.
 

The final result of the backtest, for that strategy, is:

AD_4nXeELmVX4DXvxlFU8AUUuwcELwtJ0O542IX9xmD0PKDW1zCCec_qvnMD9P1vqAX_zUrOKGFZ3T-P2K1diz4KtmHEBXPdDI0tf9YzkEI_TzGbgJ7W6_CjLTrfqmS1QKDivozUZepSz9tPhE4ZkVd4vjcS5-Td?key=mV-fneavtr8H-pPyQtcuKg

This means that backtests give better results (83.64% win rate) than the probabilities announced by Monte Carlo simulations (64.82%) and the trade could be opened.
 

Conclusion

Monte Carlo simulations offer a scientific and data-driven way to project future price ranges in the often unpredictable world of trading. By applying these simulations, we can develop strategies that aim to capture value by accurately predicting price movements within specific time horizons. The backtests show that using this method, especially for long-term options strategies like Iron Condors, can significantly improve the likelihood of success.
 

This approach complements other options strategies and provides a robust framework for structuring trades with a high probability of profit, while carefully managing risk.

 

What Is SteadyOptions?

12 Years CAGR of 129.0%

Full Trading Plan

Complete Portfolio Approach

Real-time trade sharing: entry, exit, and adjustments

Diversified Options Strategies

Exclusive Community Forum

Steady And Consistent Gains

High Quality Education

Risk Management, Portfolio Size

Performance based on real fills

Subscribe to SteadyOptions now and experience the full power of options trading!
Subscribe

Non-directional Options Strategies

10-15 trade Ideas Per Month

Targets 5-7% Monthly Net Return

Visit our Education Center

Recent Articles

Articles

  • Predicting Probabilities in Options Trading: A Deep Dive into Advanced Methods

    In options trading, the focus should not be on predicting the exact closing price of a ticker on a given date - a near-impossible task given the pseudo-random nature of markets. Instead, we aim to estimate probabilities: the likelihood of a ticker being above a specific value at a certain point in time. This perspective turns trading into a probabilistic exercise, leveraging historical data to make informed decisions.

    By Romuald,

    • 0 comments
    • 3,326 views
  • SteadyOptions 2024 - Year in Review

    2024 marks our 13th year as a public trading service. We closed 136 winners out of 187 trades (72.7% winning ratio). Our model portfolio produced 116.7% compounded gain on the whole account based on 10% allocation per trade. We had only one losing month (of 0.6% loss) in 2024. 

    By Kim,

    • 0 comments
    • 606 views
  • The 7 Most Popular Cryptocurrencies Right Now

    There are thought to be 20,000 cryptocurrencies currently in existence. While a lot of these are inactive or discontinued, a lot of them are still being traded on a daily basis. But just which cryptocurrencies are most popular? This post takes a look at the top 7 most traded cryptocurrencies.

    By Kim,

    • 0 comments
    • 7,526 views
  • Harnessing Monte Carlo Simulations for Options Trading: A Strategic Approach

    In the world of options trading, one of the greatest challenges is determining future price ranges with enough accuracy to structure profitable trades. One method traders can leverage to enhance these predictions is Monte Carlo simulations, a powerful statistical tool that allows for the projection of a stock or ETF's future price distribution based on historical data.

    By Romuald,

    • 10 comments
    • 9,776 views
  • Is There Such A Thing As Risk-Management Within Crypto Trading?

    Any trader looking to build reliable long-term wealth is best off avoiding cryptocurrency. At least, this is a message that the experts have been touting since crypto entered the trading sphere and, in many ways, they aren’t wrong. The volatile nature of cryptocurrencies alone places them very much in the red danger zone of high-risk investments.

    By Kim,

    • 0 comments
    • 5,296 views
  • Is There A ‘Free Lunch’ In Options?


    In olden times, alchemists would search for the philosopher’s stone, the material that would turn other materials into gold. Option traders likewise sometimes overtly, sometimes secretly hope to find something which is even sweeter than being able to play video games for money with Moincoins, that most elusive of all option positions: the risk free trade with guaranteed positive outcome.

    By TrustyJules,

    • 1 comment
    • 18,102 views
  • What Are Covered Calls And How Do They Work?

    A covered call is an options trading strategy where an investor holds a long position in an asset (most usually an equity) and sells call options on that same asset. This strategy can generate additional income from the premium received for selling the call options.

    By Kim,

    • 0 comments
    • 3,354 views
  • SPX Options vs. SPY Options: Which Should I Trade?

    Trading options on the S&P 500 is a popular way to make money on the index. There are several ways traders use this index, but two of the most popular are to trade options on SPX or SPY. One key difference between the two is that SPX options are based on the index, while SPY options are based on an exchange-traded fund (ETF) that tracks the index.

    By Mark Wolfinger,

    • 0 comments
    • 8,792 views
  • Yes, We Are Playing Not to Lose!

    There are many trading quotes from different traders/investors, but this one is one of my favorites: “In trading/investing it's not about how much you make, but how much you don't lose" - Bernard Baruch. At SteadyOptions, this has been one of our major goals in the last 12 years.

    By Kim,

    • 0 comments
    • 4,724 views
  • The Impact of Implied Volatility (IV) on Popular Options Trades

    You’ll often read that a given option trade is either vega positive (meaning that IV rising will help it and IV falling will hurt it) or vega negative (meaning IV falling will help and IV rising will hurt).   However, in fact many popular options spreads can be either vega positive or vega negative depending where where the stock price is relative to the spread strikes.  

    By Yowster,

    • 0 comments
    • 7,175 views

  • Like 1
  Report Article

We want to hear from you!


Hi @Romuald

looks like an incredible amount of work has gone into that , thank you for sharing this with us.
If I may make a few comments and observations to see if I understand your work, the above charts and the conclusions from that correctly:

If you run a Monte Carlo on 20 years of QQQ I'd expect that to skew to positive results. I think average annual return is something like 15% p.a. with only 3 down years in the last 20. Then implied Vol tends to be higher than realised vol (option risk premium) so selling put spreads in the past would have been a winning strategy most of the time (if you could stomach the performance in years like 2008 or 2022).

I think the fact that nearly all data points are above 50% probability confirms the existence of option risk premium.
It seems the probability depends more on the choice of underlying - QQQ and GLD seem to have consistently higher probabilities than IWM and SPY. This doesn't seem to be a function of absolute performance - GLD is the weakest performer of the 4 over 20 years. So maybe the consistency of the trend (QQQ had some violent bear markets but outside these it was a consistent up) or maybe the option risk premium is higher for GLD and QQQ.

A question on the 'credit' axis of the scatter chart. Does this refer to various credit bull spreads with different premium (i.e. short strike closer to ATM and long strike further away = higher credit) or is that the same PutSpread (say ATM/90%) at different times so with different Implied Vol? My understanding is, its the former but I want to make sure I got that correctly 

Share this comment


Link to comment
Share on other sites

Hi Marco, I agree with your comments. And you are right, the credit axis refers to various credit bull put spreads with different premiums.Thanks for your precious comments.

Share this comment


Link to comment
Share on other sites

I can't resist the urge to show you today's beautiful 'stellar map' for the gain/loss ratio of 0.4 for the following configuration :

image.png.b530b7d2ea99a4f8d8bbb07a7c2bdf7b.png 

Here is the map:

image.thumb.png.3bf907a90b2fcbac06e73fe9752883d5.png

On the X-axis, there is the credit put spread, representing all combinations of strikes that meet this gain/loss ratio, for all expiration dates between min_days and max_days. On the Y-axis, the Monte Carlo simulation probabilities of being above the Break-Even point at the expiration date are displayed. For each point, 10,000 Monte Carlo simulations are run, based on the ticker's behavior over the past 20 years.

Share this comment


Link to comment
Share on other sites

Interesting framework, but not a strategy yet, since I see some parts to improve:

Macro situations:

1. US stock indexes (SPY / QQQ) have clear different patterns under different "economic climates", for example:
    1) When Fed increases the rate gradually (like 2022), index goes down accordingly. Vice versa.

    2) When recovered from huge crisis / extreme events, indexes steadily go up for a period

2. Therefore, directly using 20 years' data to predict next 20-30 days SPY/QQQ price ranges, without considering the current macro econ climate (and other important factors), could be inaccurate. Take "predicting Seattle's weather" for example:

    1) it's known that Seattle has rainy season in winter and dry season in summer. If you predict Seattle's weather in next 15 days using 20 years' data, but without considering it's summer or winter, it won't be accurate by design.

    2) a local person of Seattle can easily predict weather in 15 days without using sophisticated techniques, since they know rainy/dry seasons well. They can be wrong but not often. This is like what macro-econ traders do: they predict US index trend based on macro signals (e.g. Fed opinions on inflation, current treasury rates, potential bubbles, etc).

Improvement of backtesting:

1. To me the most critical aspect of backtesting is stability across a certain time period. Therefore you should apply the backtesting on yearly basis and check the return variance. Especially on years of different macro situations, e.g. 2020, 2022, 2024 for recently years.

The use of Monte Carlo (MC) method:

1. Directly use the historical prices (underlying or options) distribution is a plain/raw usage of MC. It has more potential:

    1) Apply pre-conditions. For example, if we use SPY price patterns of last 10 days and last 30 days as input, what's the price distribution predicted by MC given the similar last-10-day and last-30-day price patterns in last 20 years? This method take some macro situations and price movements into consideration.

        A) Take "Seattle weather" for example, if you consider last-10-day weather, it's easy to know it's in rainy or dry season, without the need of a local person's knowledge.

I have more thoughts on this but I'd stop here for now. Due to the parts that could be further improved, I'd call this method a framework rather than a strategy.

Share this comment


Link to comment
Share on other sites

@Kim I'm interested in doing a 1 or 3 month membership in SY to try this strategy.  Will this new strategy be used exclusively for developing trades or will it co-exist with the original bond/oil trade setups?  Also, will we need Romuald's program (and if so will it be made available) to better understand the strategy and then start making our own trades?  Thanks

Edited by Canuck_Dave

Share this comment


Link to comment
Share on other sites
1 hour ago, Canuck_Dave said:

@Kim I'm interested in doing a 1 or 3 month membership in SY to try this strategy.  Will this new strategy be used exclusively for developing trades or will it co-exist with the original bond/oil trade setups?  Also, will we need Romuald's program (and if so will it be made available) to better understand the strategy and then start making our own trades?  Thanks

The main strategy of SY service is still TLT trades based on oil/rates correlation. The Monte Carlo trades are complimentary trades, small allocation now, but the combination of non correlated strategies should work well.

Romuald's program is not available at this point, but might be in the future.

Share this comment


Link to comment
Share on other sites

There is a clear and indisputable evidence that the bonds/oil correlation is real. It doesn’t mean that it’s easy to trade it, but the key is not to lose much when correlation breaks. This why position sizing and risk management are so important. It has been proven in the last few months that a disciplined and calculated approach can work very well. We will continue with this approach as we have been doing with all our strategies for years.

Share this comment


Link to comment
Share on other sites


Create an account or sign in to comment

You need to be a member in order to leave a comment

Create an account

Sign up for a new account. It's easy and free!


Register a new account

Sign in

Already have an account? Sign in here.


Sign In Now

Options Trading Blogs