
In this article, I'll introduce Monte Carlo simulations, explain their relevance in trading, and describe a specific options trading strategy I've developed using these simulations. I'll also share backtested results to illustrate the strategy's effectiveness.
1. What Are Monte Carlo Simulations?
Monte Carlo simulations are a computational technique used to model the probability of different outcomes in a process that cannot easily be predicted due to the presence of random variables. Named after the famed casino, these simulations are especially useful in finance because they allow for the analysis of uncertainty and risk.
The process involves running thousands or even millions of simulations based on historical price movements, where each simulation projects a possible future outcome. The resulting distribution provides traders with probabilities of price ranges over a given time horizon.
2. How Are Monte Carlo Simulations Applied in Trading?
In trading, Monte Carlo simulations help to anticipate how a financial instrument, such as an ETF like SPY or QQQ, might behave over a future period. The process looks back over several years of historical price data and runs numerous simulations to project future price distributions. The outputs typically show a probability distribution of future prices, highlighting key metrics such as confidence intervals.Here is an example for SPY:
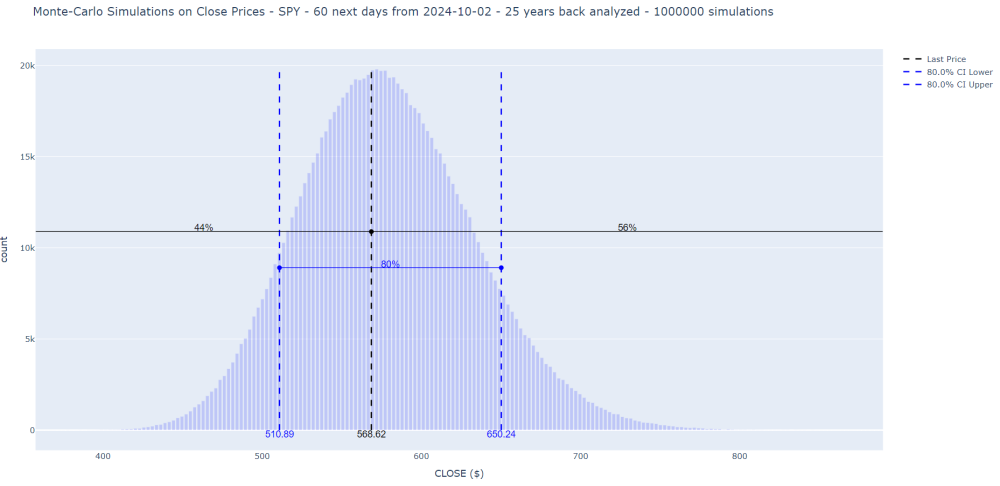
These simulations are invaluable for options traders because they offer insights into the probability that a stock or ETF will remain within above/below price bounds over a specific time frame. This information helps to craft structured options strategies, like Credit Put Spreads, which profit when an asset stays above a price threshold.
3. Example for a Credit Put Spread
Here for example is the result of 10,000 simulations carried out on SPY for a prediction of the movement in 15 days by asking the algorithm to calculate what percentage of data is above the $565 threshold. For example if we consider that this value is a support or that this value would be the break even of a Credit Put Spread strategy that we would have implemented.
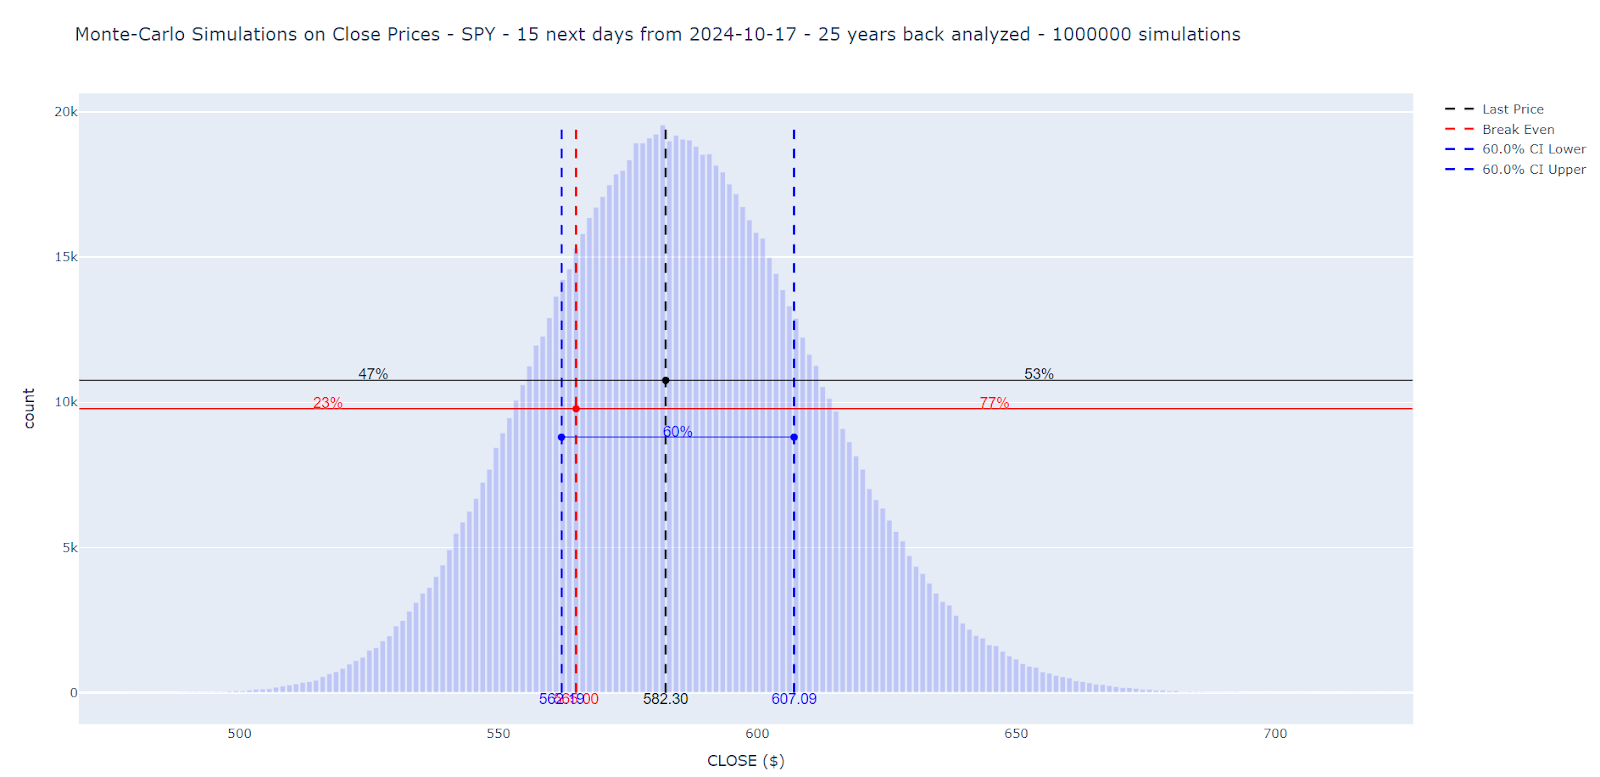
We see that there is a probability of 77% that the ticker is above this threshold value.
Recall that Monte Carlo simulations observe the past behavior of the ticker over many years, day after day, deduce a statistical distribution and perform random shots oriented like this statistical distribution in order to capture the pseudo-random nature of the market. It will be necessary to see how these predictions have come true in the past.
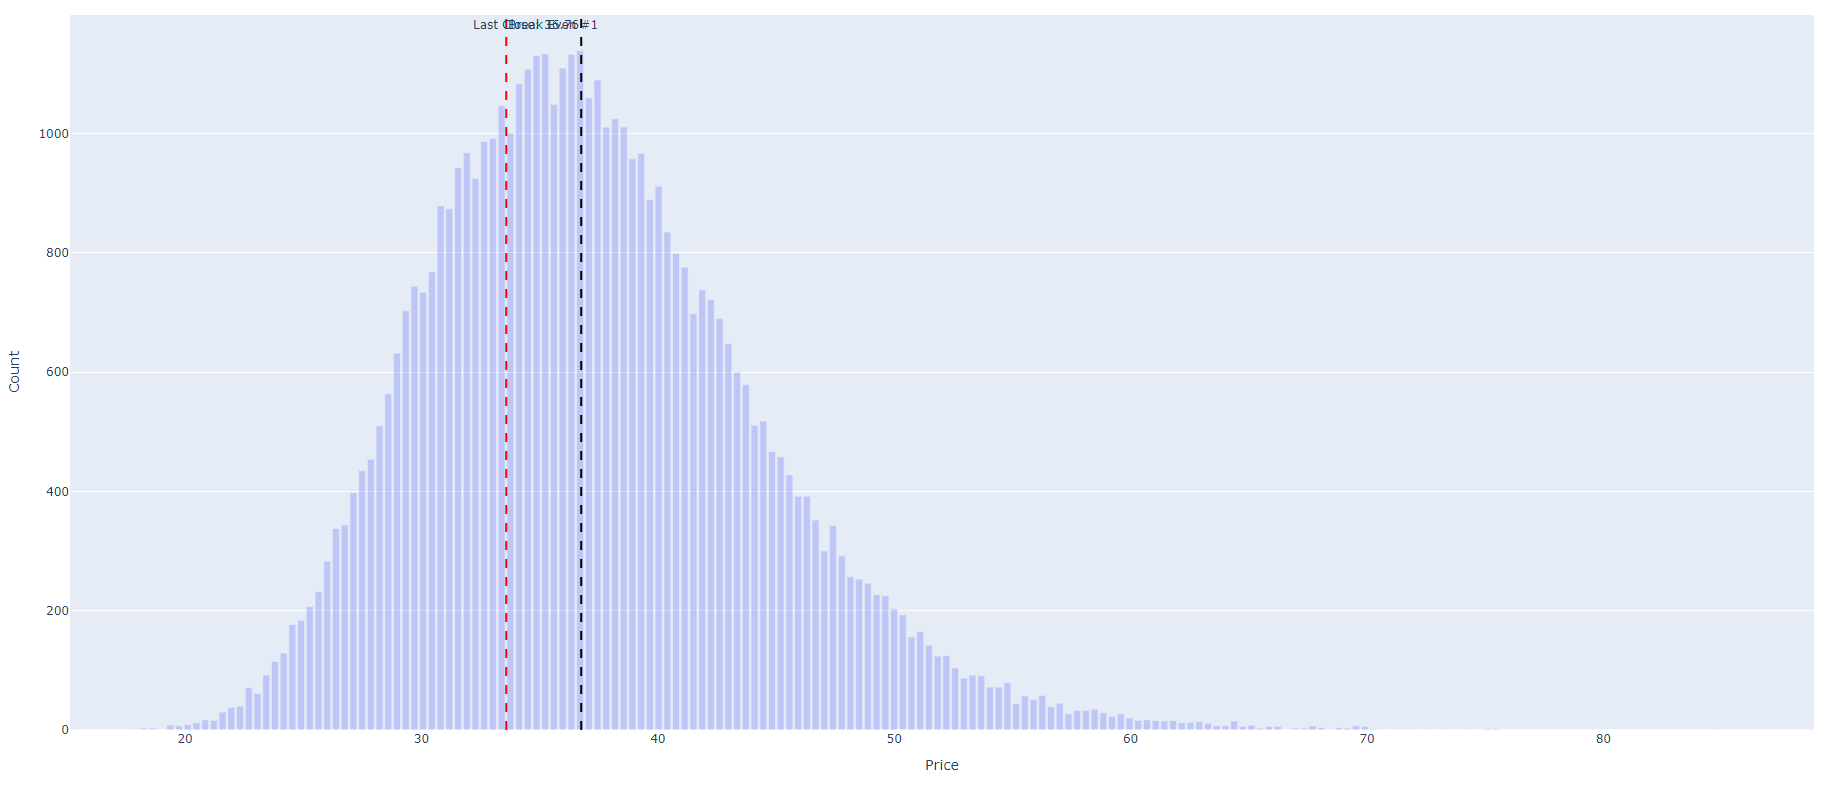
Note that to account for the historical distribution of a ticker, we need to adjust the Monte Carlo simulation approach in the code. Rather than assuming a normal distribution for price movements, I model price changes based on the actual historical distribution of returns. This technique, often called bootstrapping, samples historical returns directly instead of generating synthetic returns based on a fixed normal distribution.
This is then the kind of plot we get :
4. The Strategy: Using Monte Carlo Simulations for Options Trading
Using the break evens of an Iron Condor as threshold values is not interesting because the simulations showed that credits received on the Call part were not sufficient.
So let's focus on the Put part via Credit Put Spreads. For a given ETF (we will leave out stocks because of the earnings), there are many expiration dates and many strikes, each with their own price. Which ETF to choose, which strikes to buy and sell and which expiration dates?
For this, the program I wrote scans the most important ETFs, ['SPY','GLD','QQQ','IWM','EEM'], all their expiration dates between two numbers of days [min_days = 30 max_days = 120] and all strikes below the OTM strike that can form a Credit Put Spread. A point is thus given by, for example, [SPY, 2024-11-15, put bought=$577, put sold=$582].
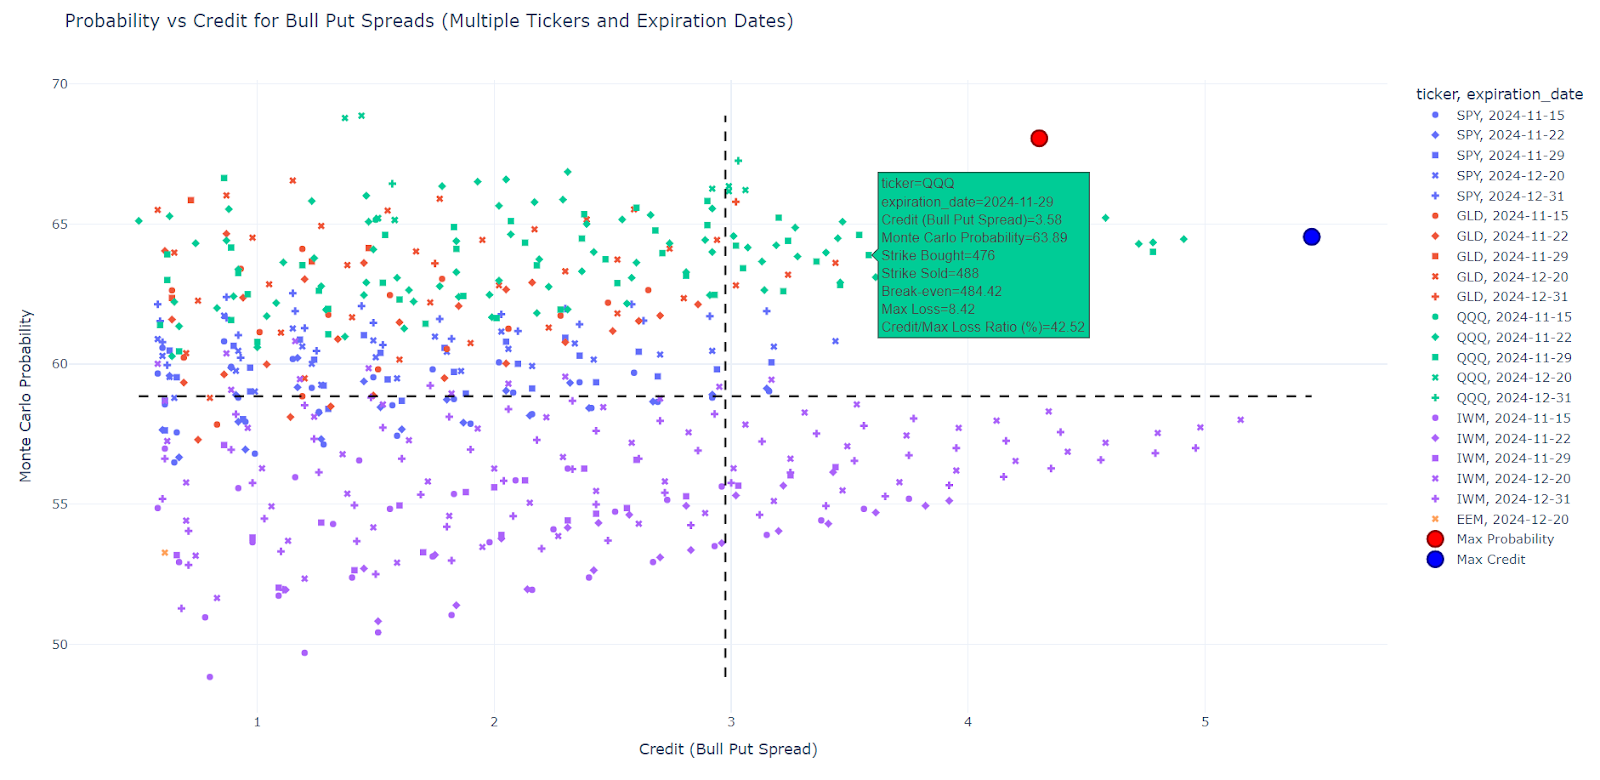
For each point, the code then performs 10,000 Monte Carlo simulations, looking back 20 years and calculating the probability that the SPY close will be higher than the break even in 29 days (=number of days remaining between now and the expiration date). Then, the program displays all the points in the form of a graph with, on the abscissa, the perceived credit and on the ordinate, the Monte Carlo probability. Credit > $0.50 and gain/loss ratio above 40% are only selected.
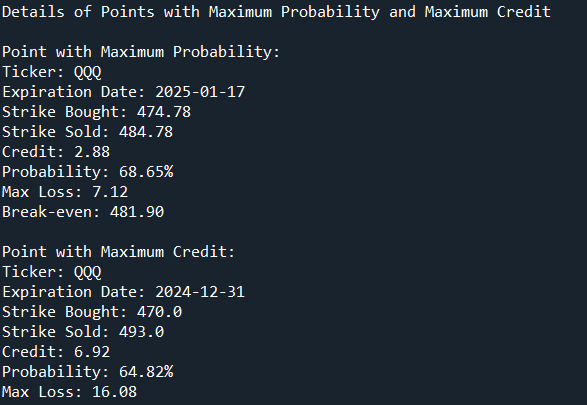
The graph is divided into 4 quadrants, the one of most interest to us being the northeast quadrant (maximum credit and maximum probability). The program then detects the two points which, in this quadrant, have the highest probability or the highest credit.
Here is an example of display:
4. Backtesting Results
To validate this strategy, we performed backtests using historical data for the past 15 years. The idea was to simulate what would have happened if this strategy had been applied in the past with the break even corresponding to the probability computed in the chosen point.
To use the example here above with the maximum credit,the backtest would answer this question: for the ticker QQQ at the expiration date of 2024-12-31 (corresponding to 74 days from now, the date of writing this article), the Monte Carlo simulations tell me that the Close of QQQ has a probability of 64.82% of being higher than the strategy's break even. If I had applied this strategy 15 years in the past from now, day after day with the Break Even at that time corresponding to this quantile, would the real value of QQQ have indeed been higher than this Break Even? And if so, how many times has it worked between 15 years ago and now, day after day?
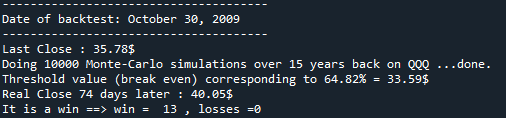
To be more specific, during the backtest the algorithm displays the results of the step-by-step backtests very clearly:
Example of a screenshot during the backtest:
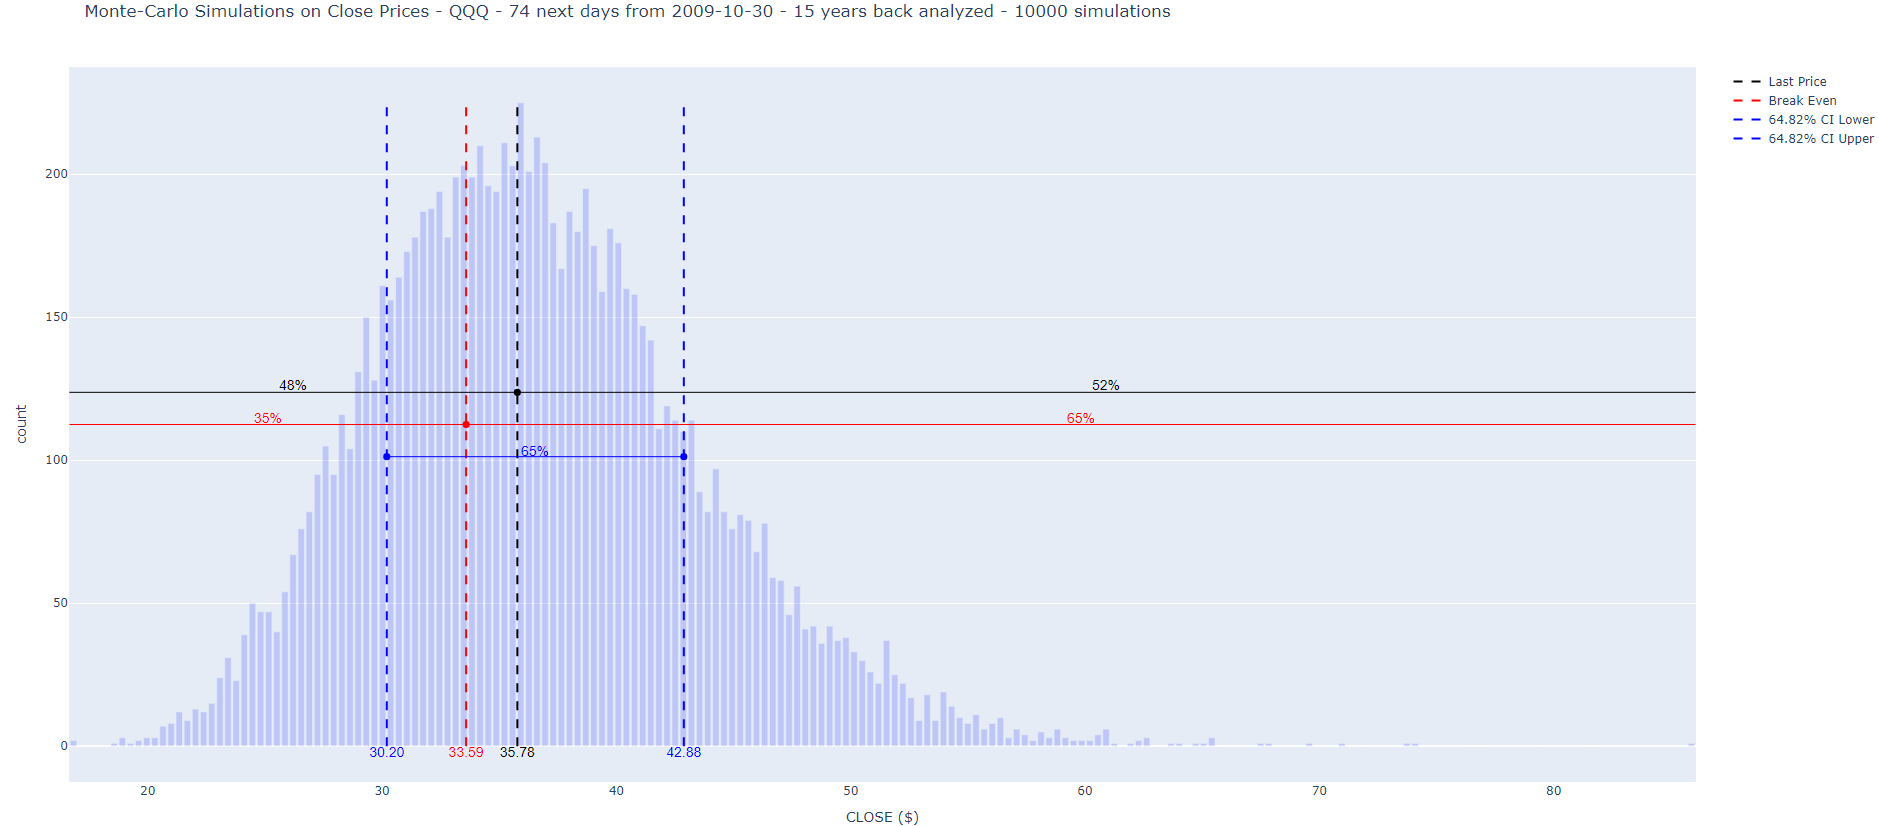
and the plot of the histogram to prove the consistency of the threshold value:
This systematic approach, with precise risk management, provides traders with a powerful tool to make informed decisions about structuring options trades. It's worth noting that the performance of each strategy can vary depending on market conditions, so consistent backtesting is key to keeping the strategy profitable in evolving markets.
The final result of the backtest, for that strategy, is:
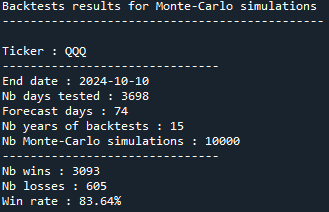
This means that backtests give better results (83.64% win rate) than the probabilities announced by Monte Carlo simulations (64.82%) and the trade could be opened.
Conclusion
Monte Carlo simulations offer a scientific and data-driven way to project future price ranges in the often unpredictable world of trading. By applying these simulations, we can develop strategies that aim to capture value by accurately predicting price movements within specific time horizons. The backtests show that using this method, especially for long-term options strategies like Iron Condors, can significantly improve the likelihood of success.
This approach complements other options strategies and provides a robust framework for structuring trades with a high probability of profit, while carefully managing risk.


Join the conversation
You can post now and register later. If you have an account, sign in now to post with your account.
Note: Your post will require moderator approval before it will be visible.