Background
An Anchor trade's goal is to prevent loss of capital while still generating a positive return in most market conditions. This strategy began with the premise that it must be possible to hedge against market losses without sacrificing all upside potential.
The Anchor strategy's primary objective is to produce positive returns on an annual basis.
How?
Step 1 - Purchase ETF's highly correlated to the S&P 500
Step 2 - Fully hedge with S&P 500 put options
Step 3 - Earn back the cost of the hedge over the course of a year
You can read the full description here.
Performance
Since the strategy went live in 2012, Anchor has produced an 11.5% CAGR (Compound Annual Growth Rate) with 9.1% volatility, resulting in a 1.27 Sharpe Ratio. You can see the full performance here. In the same period of time, the S&P 500 index (including dividends) produced a 14.5% CAGR, with 10.7% volatility, resulting in a 1.36 Sharpe Ratio. Anchor has met its performance goal of lagging the S&P 500 by up to three percent in positive markets.
Anchor performance includes commissions and fees. Since you cannot buy the S&P 500 directly, real life performance of your investment in S&P 500 will be reduced by commissions and fees, so the real life difference will be probably closer to two percent.
Observations
- The S&P 500 has substantially outperformed it's long term average CAGR and Sharpe Ratio since 2012. It historically has a Sharpe Ratio of about 0.3 going back to 1926, yet has a Sharpe Ratio in excess of 1.3 since 2012. One universal principle in markets is reversion to the mean, which will eventually catch up to the S&P 500.
- The Anchor strategy could have potentially preserved capital during crisis periods such as 2008. In real trading, you can get a feel for how the option hedge can protect your portfolio by looking at August 2015 and January 2016, where the S&P 500 was down 5-6% while Anchor avoided losses.
- The goal of the Anchor strategy is to provide protection from bear markets and unpredictable surprise events. The S&P 500 has experienced four years of negative performance since 2000, for a cumulative loss of more than 80%, and multi standard deviation downside price shocks occur much more frequently than probability distributions predict. The day following "Brexit", the S&P 500 moved 4.7 standard deviations which is expected to occur less than once a century based on probability distributions, yet there has been close to 50 one day losses of 4 standard deviations or more since 1950. Markets can't be contained to probability distributions or academic theories, just ask Long Term Capital Management.
- The strategy is continuously being improved. For example, we switched from 2 week short options to 3 weeks. That has materially improved results, and would also have improved backtested results.
Conclusion
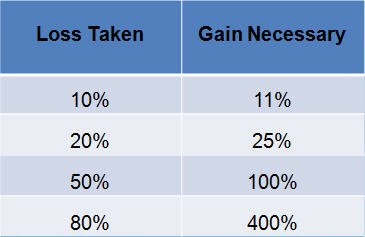
The impact of minimizing or potentially even avoiding losses in down markets should not be overlooked both mathematically and psychologically. Consider the following table, which displays the gain required to recover a prior loss.

The key to the success of the strategy is combining exposure to market gains while permanently hedging against downside risk. The strategy is designed to participate in most of the market's upside while avoiding most of the market's downside. Easier said than done, but we are certainly pleased with the results to date on both a relative and absolute basis.
Is the Anchor Strategy the Holy Grail? The answer is NO - in fact, no single strategy is. But we continue to improve the strategy designed to give investors the courage they need to invest confidently in the stock market for the long term.


There are no comments to display.
Join the conversation
You can post now and register later. If you have an account, sign in now to post with your account.
Note: Your post will require moderator approval before it will be visible.