Leaderboard


Popular Content
Showing content with the highest reputation on 01/31/22 in all areas
-
Relativement doable. It's just the half of each leg of the straddle.2 points
-
Wow, thank you so much Kim! What an unexpected honor and I'm very grateful to you. The SO community is amazing and I've learned so much from everyone here. This is by far the best option trading community out there. When there's money on the line, people can become a bit prickly, but SO members are (mostly 😁) always polite and supportive of each other. As you know, with all the recent market volatility, it's been challenging to find good calendar setups including with our normal suspects like NFLX, AMZN, GOOG, BABA, etc. I've just been trying to think outside the box by looking at potential candidates with solid setups that we might not normally consider for calendars such as PSX or VLO. Like everything else, sometimes it works and sometimes it doesn't. Thanks again, Kim, and thanks to all the SO members out there who make this community so awesome!2 points
-
Historical ATM IV or RV data for ATM puts or calls would be nice for the expirations before and after earnings. We could use that as a gauge for "cheap" vs. "expensive" for all the different earnings strategies. You don't really need RV or IV at other deltas unless you think there is some temporary inefficiency between the strikes.1 point
-
Why is it that simple seeming things always end up being not so simple, LoL. I like the idea, but for simplification, how about settling for just the ATM call or put. While it's not perfect, you can use it to make a judgement call on where the further out or in strikes would be.1 point
-
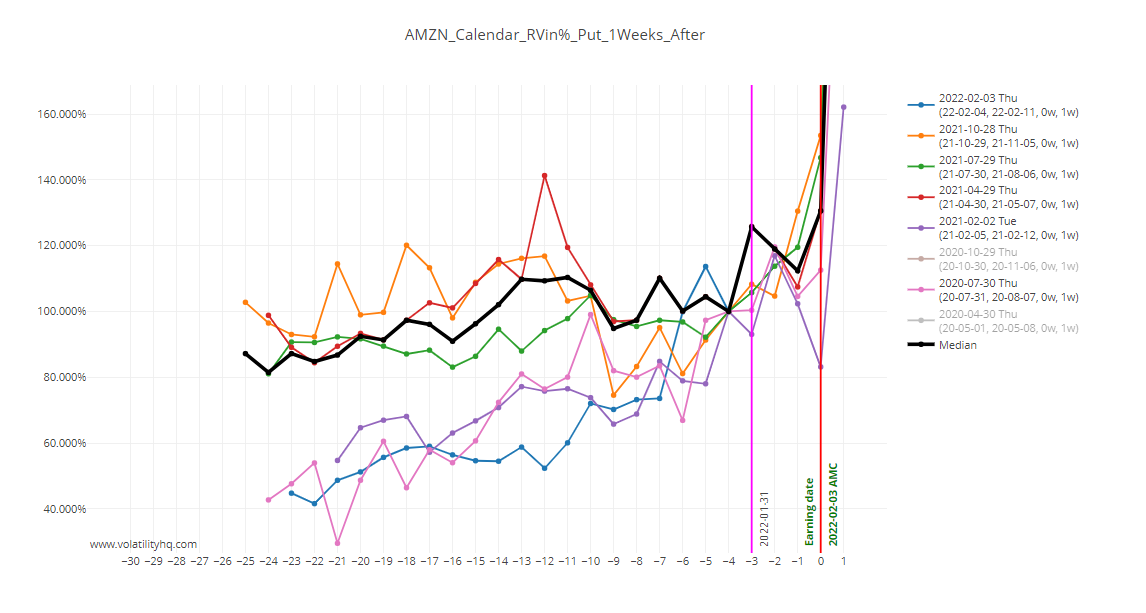
It's the RV(T-x) / RV(reference T). So you take the RV of the current day, divided by a constant RV at a reference date. Here you can see that the reference date is T-4. You should see the RV in % at 100% at that date. Then if you look at another date, if the RV in % is 110%, then you know that the RV increased by 10% between T-4 and the date you are looking at.1 point
-
Along the same lines as @cimat post, what is the formula for calculating RV%? Percent of what?
 1 point
 -
Member of the month award for January goes to @deepvalue4ever for his continuous contribution of trading ideas. We encourage members to continue posting trading ideas - this is what this community all about!1 point
-
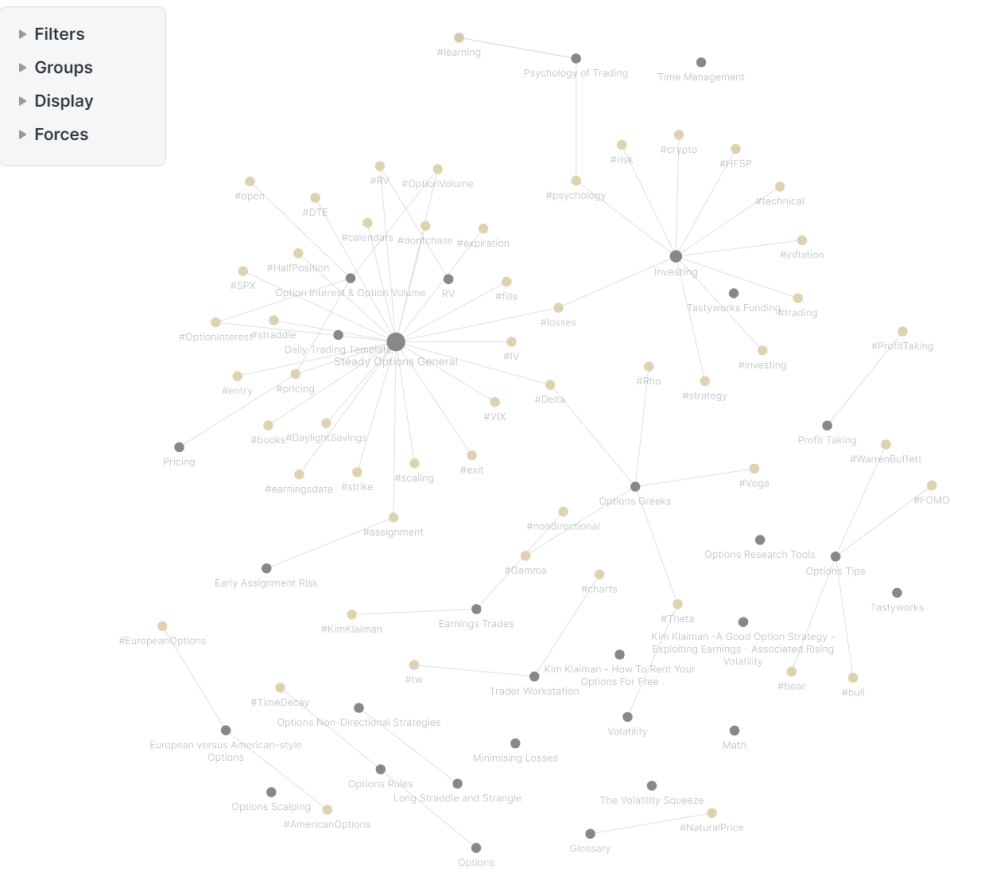
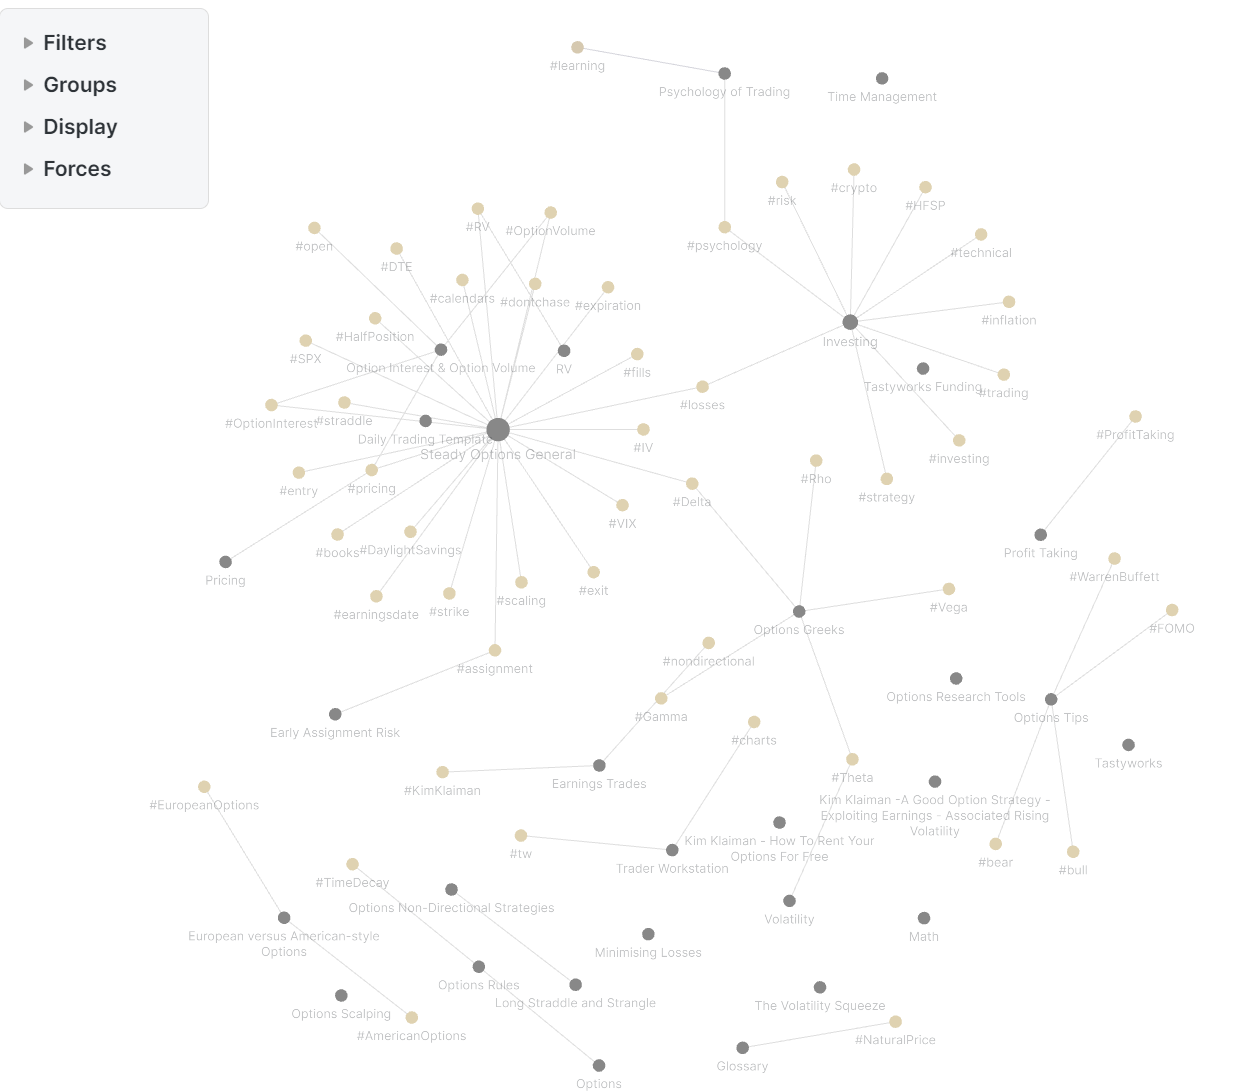
Thanks for the response Ringandpinion. I do understand the aim of Steady Options is to teach us to fish. I also understand the barrier to entry has to be high or else everyone would be trading options successfully. To be clear I'm not asking for a Wiki. At the rate I am going I'm pretty much building my own Wiki, between my Steady Options Notion database and my tagged Obsidian vault (below). As I said I am painfully aware that I am not effectively leveraging the data that VolatilityHQ provides. A simple video capture with voice over could demonstrate the functionality of VolatilityHQ in a few minutes and would be easy to produce. It's just a suggestion 🙂
 1 point


This leaderboard is set to New York/GMT-04:00