Leaderboard


Popular Content
Showing content with the highest reputation on 10/20/21 in all areas
-
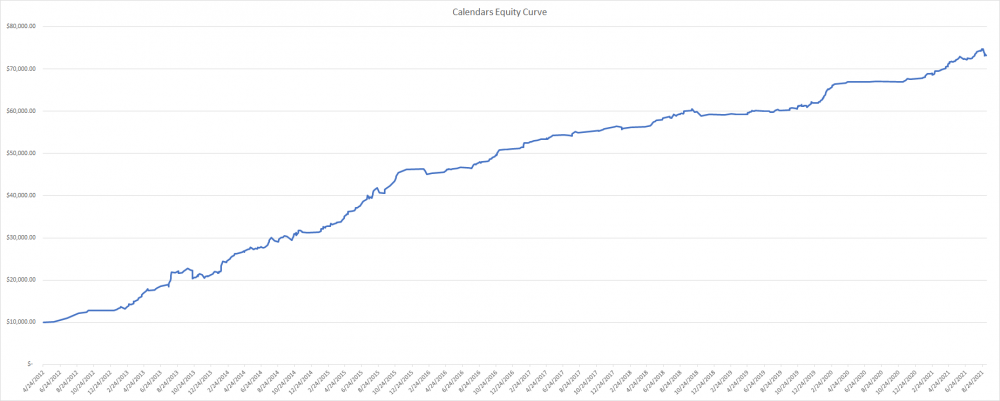
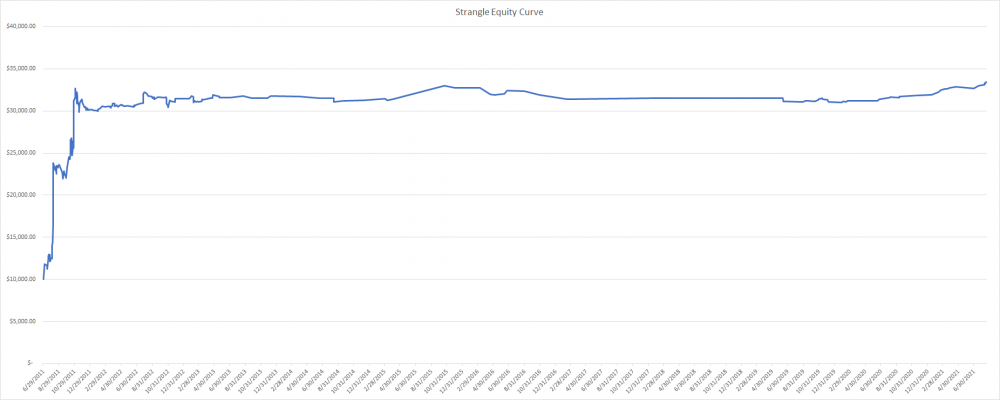
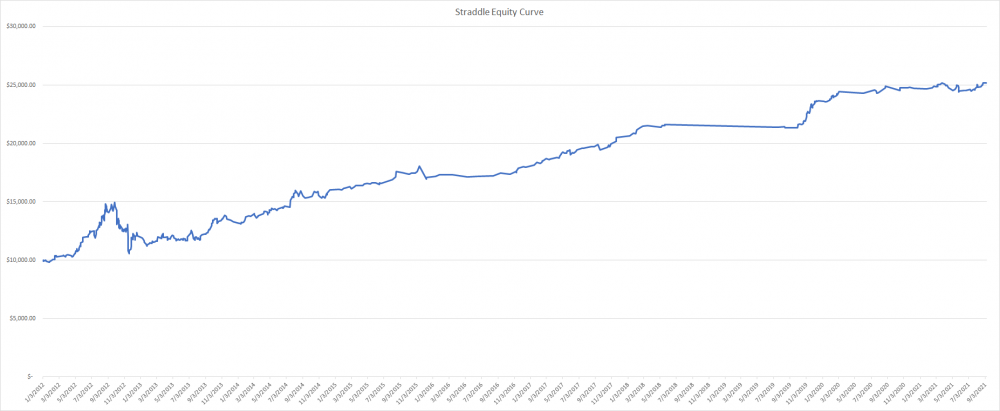
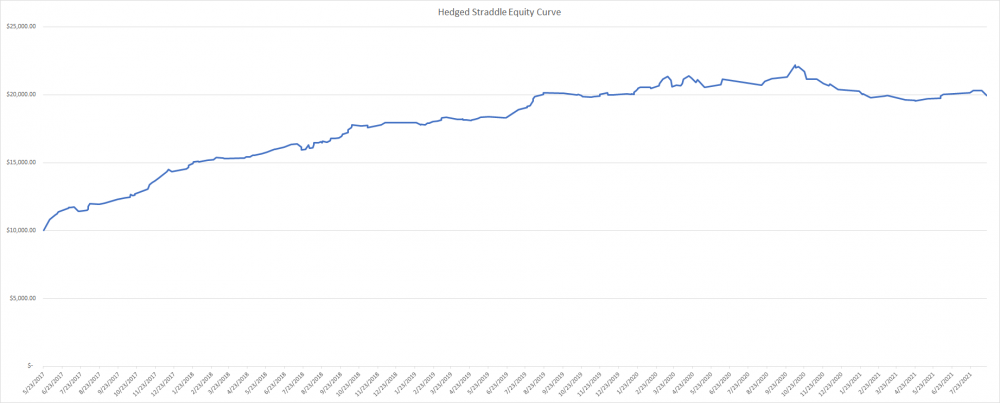
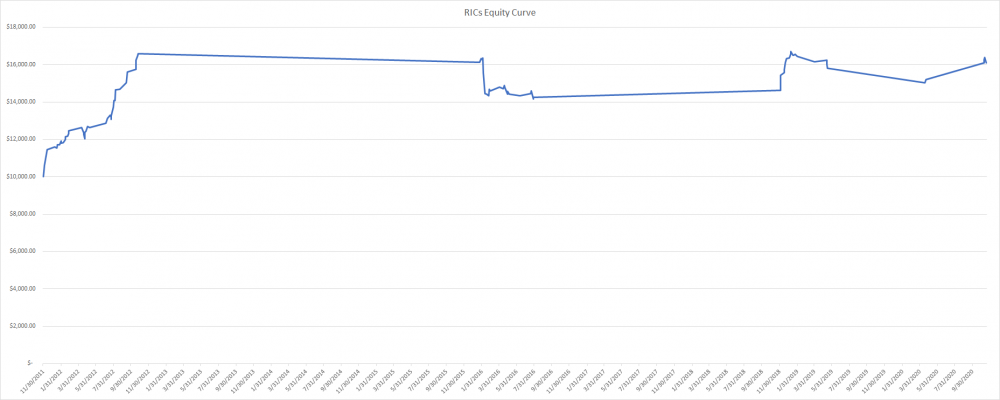
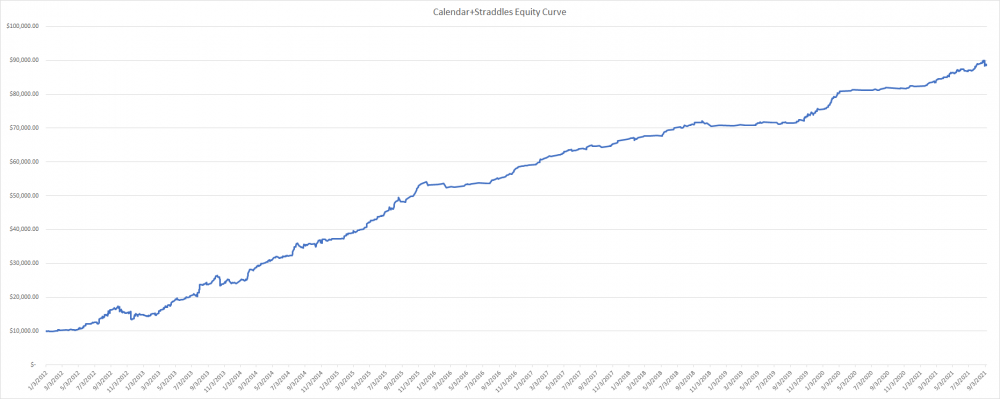
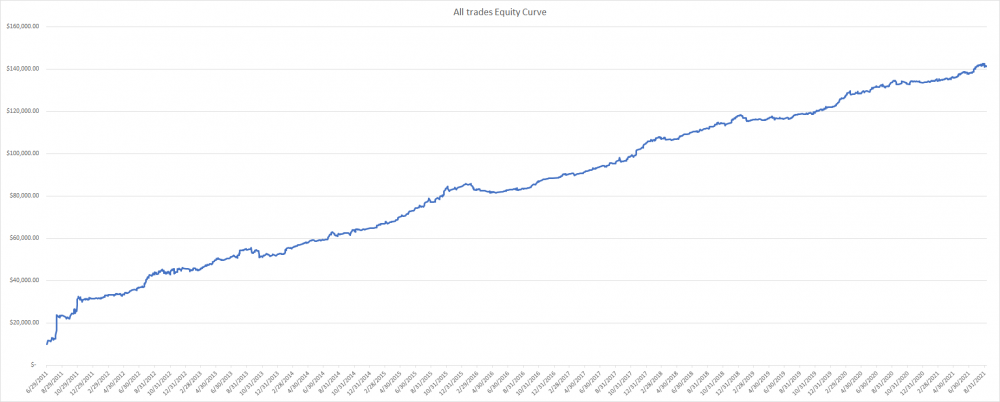
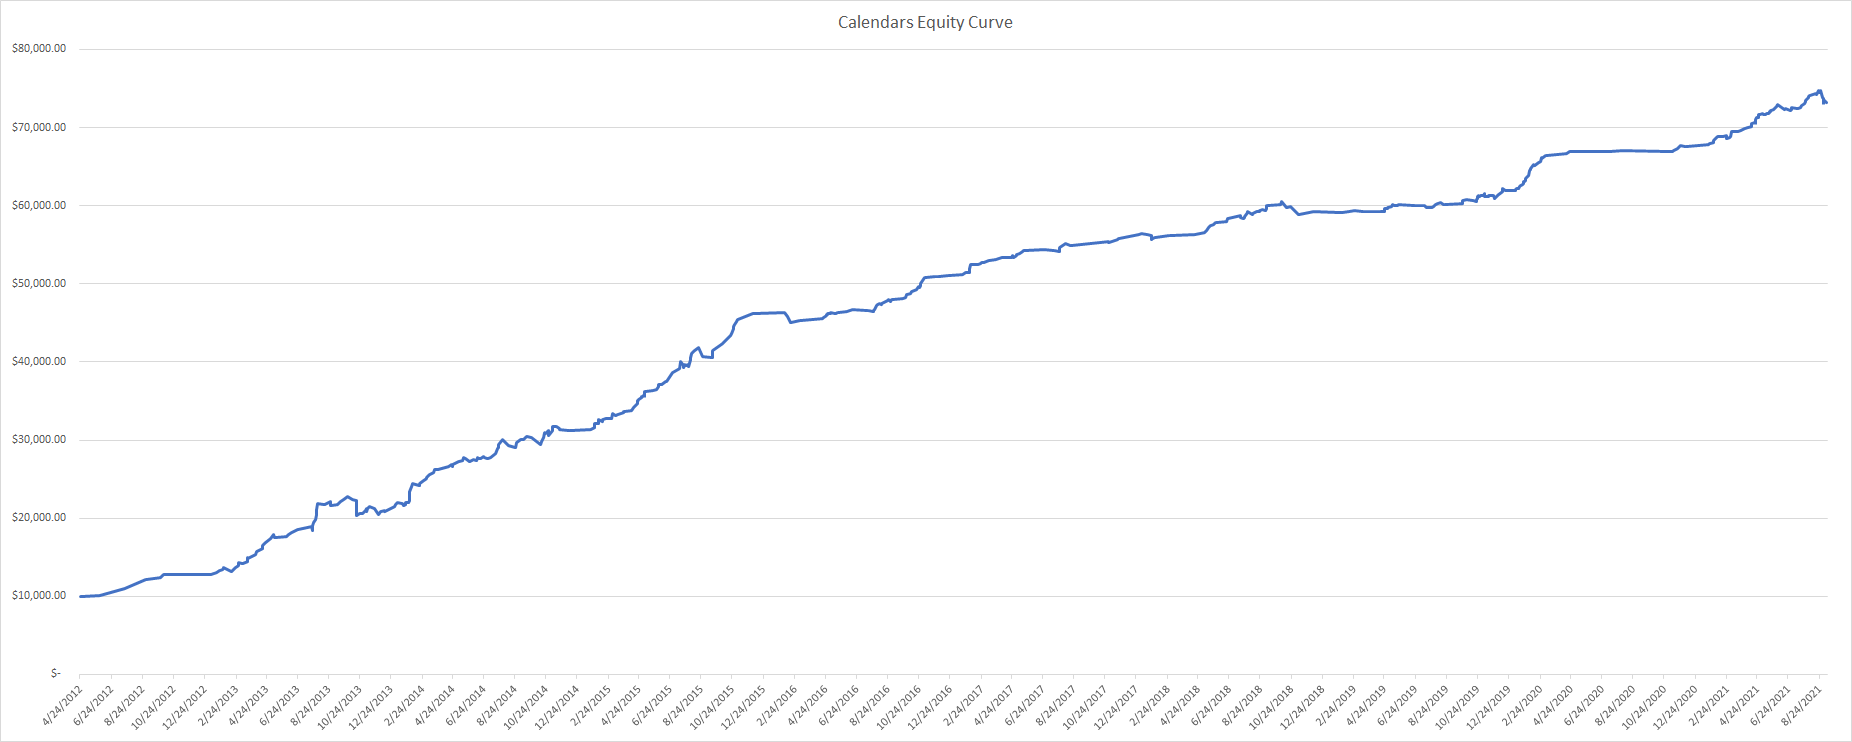
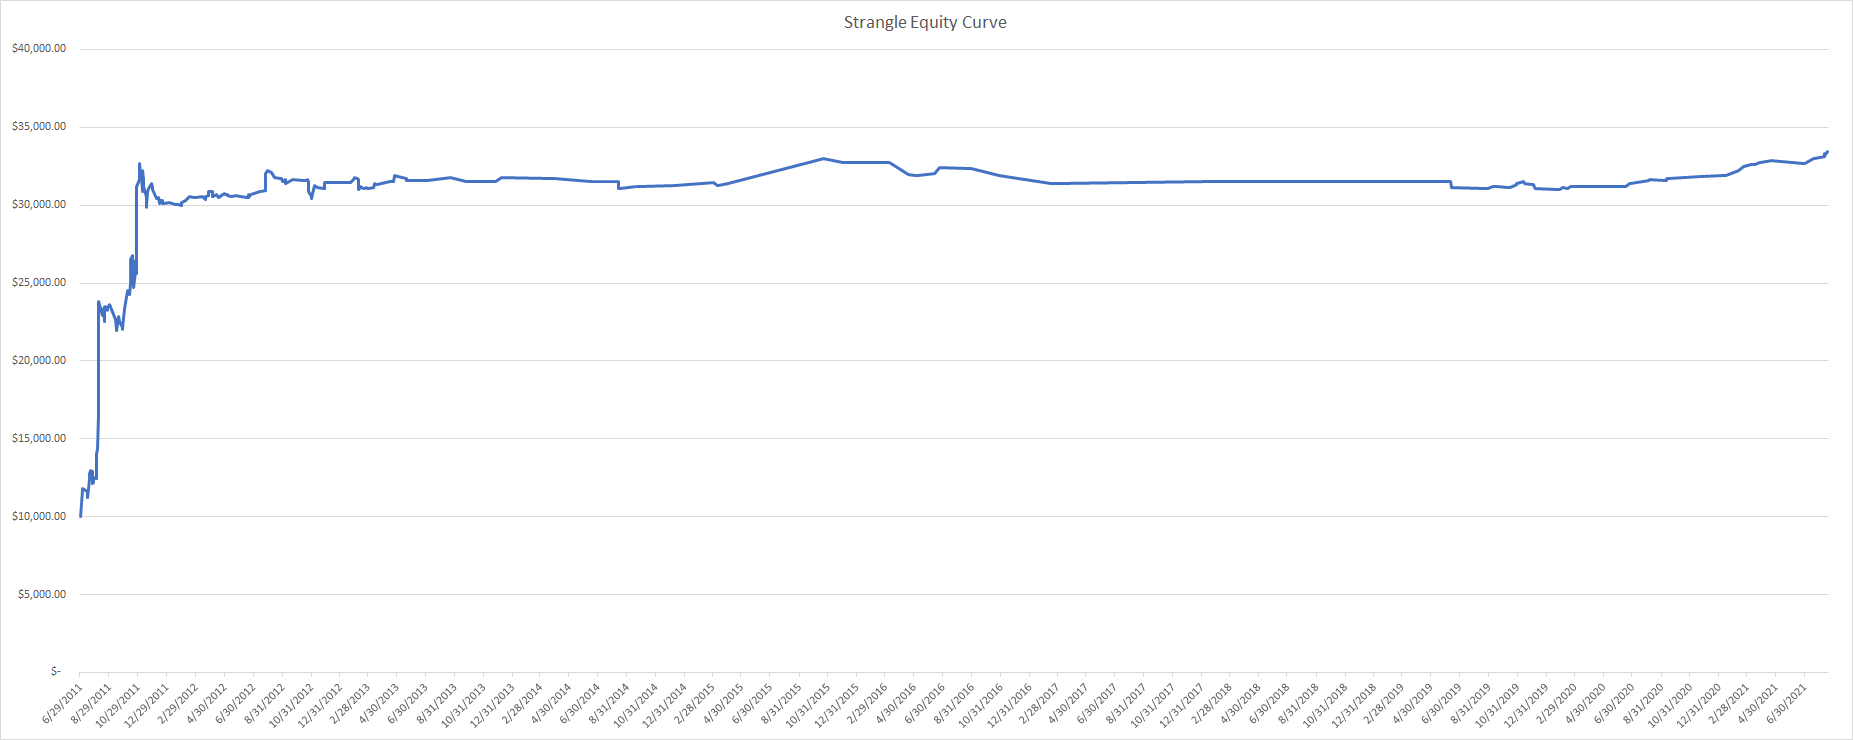
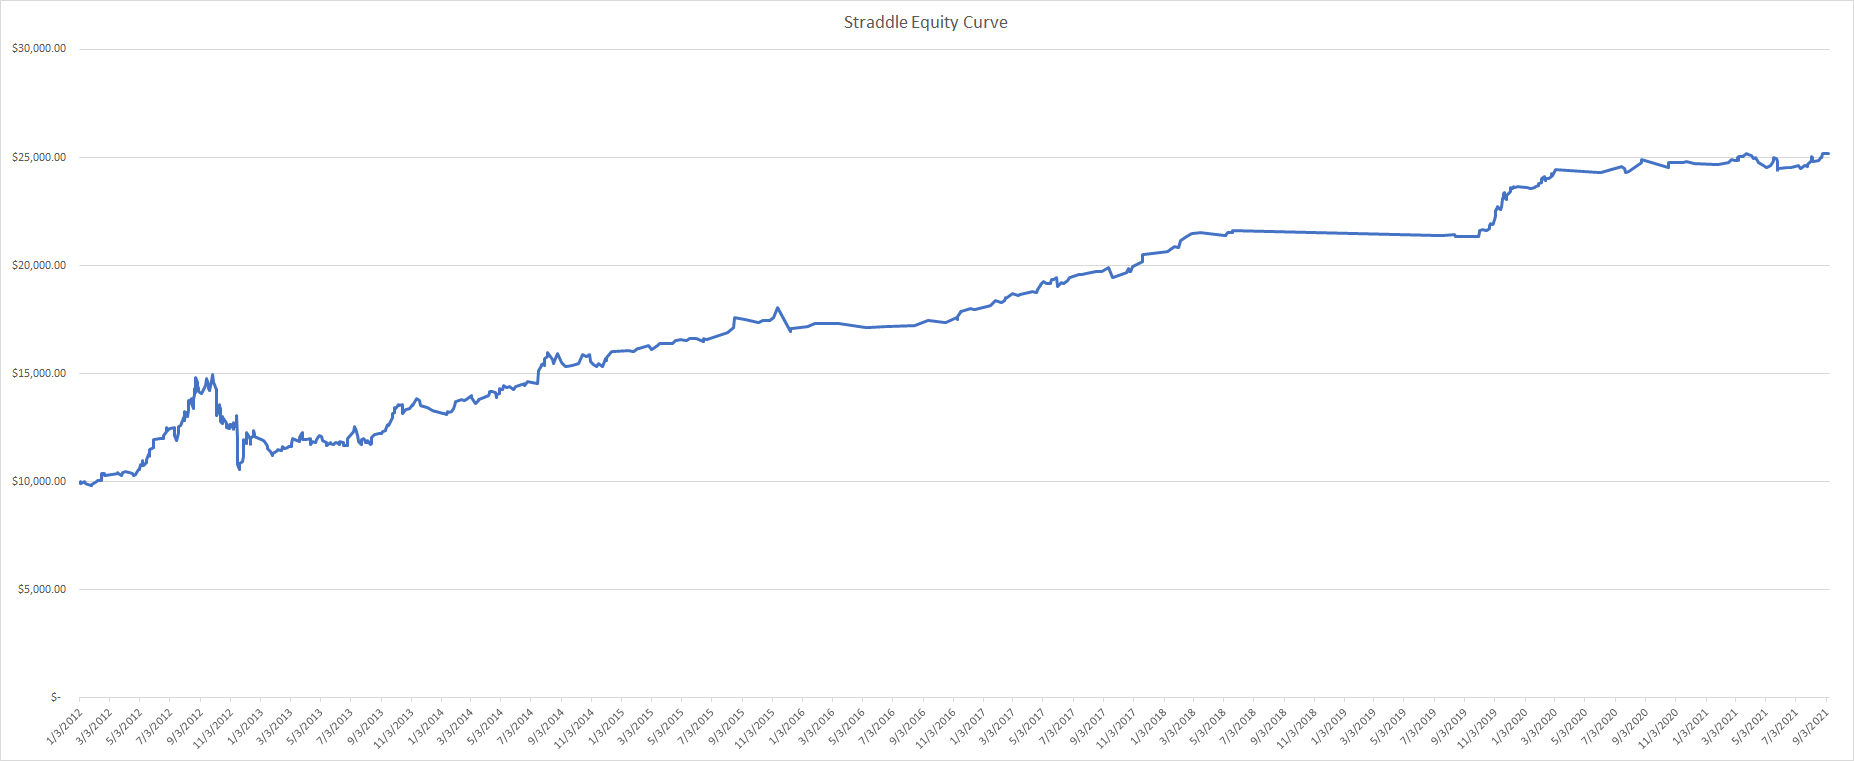
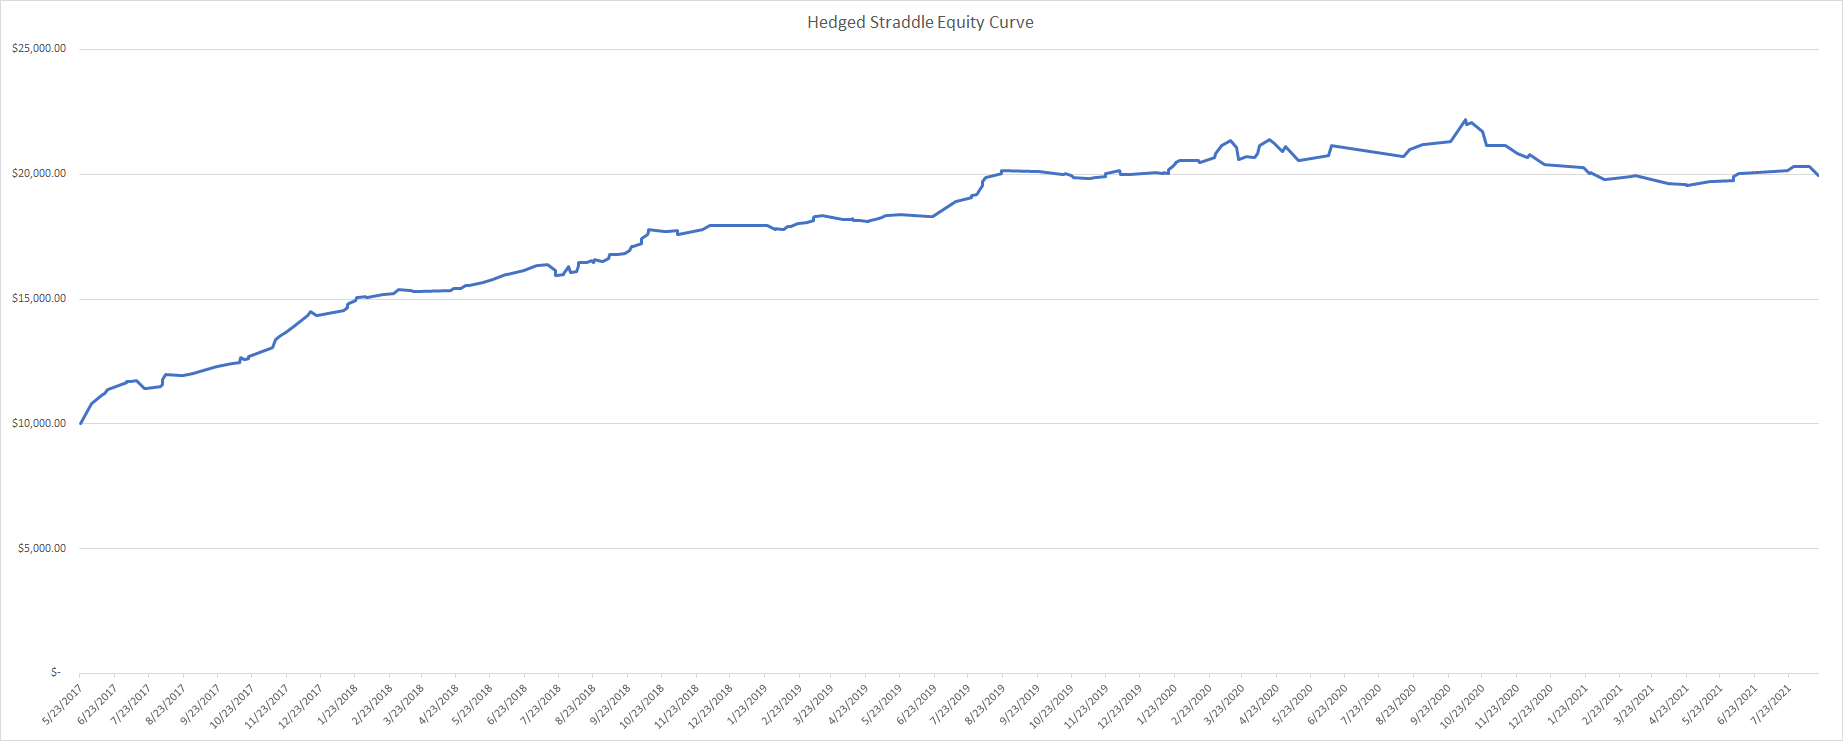
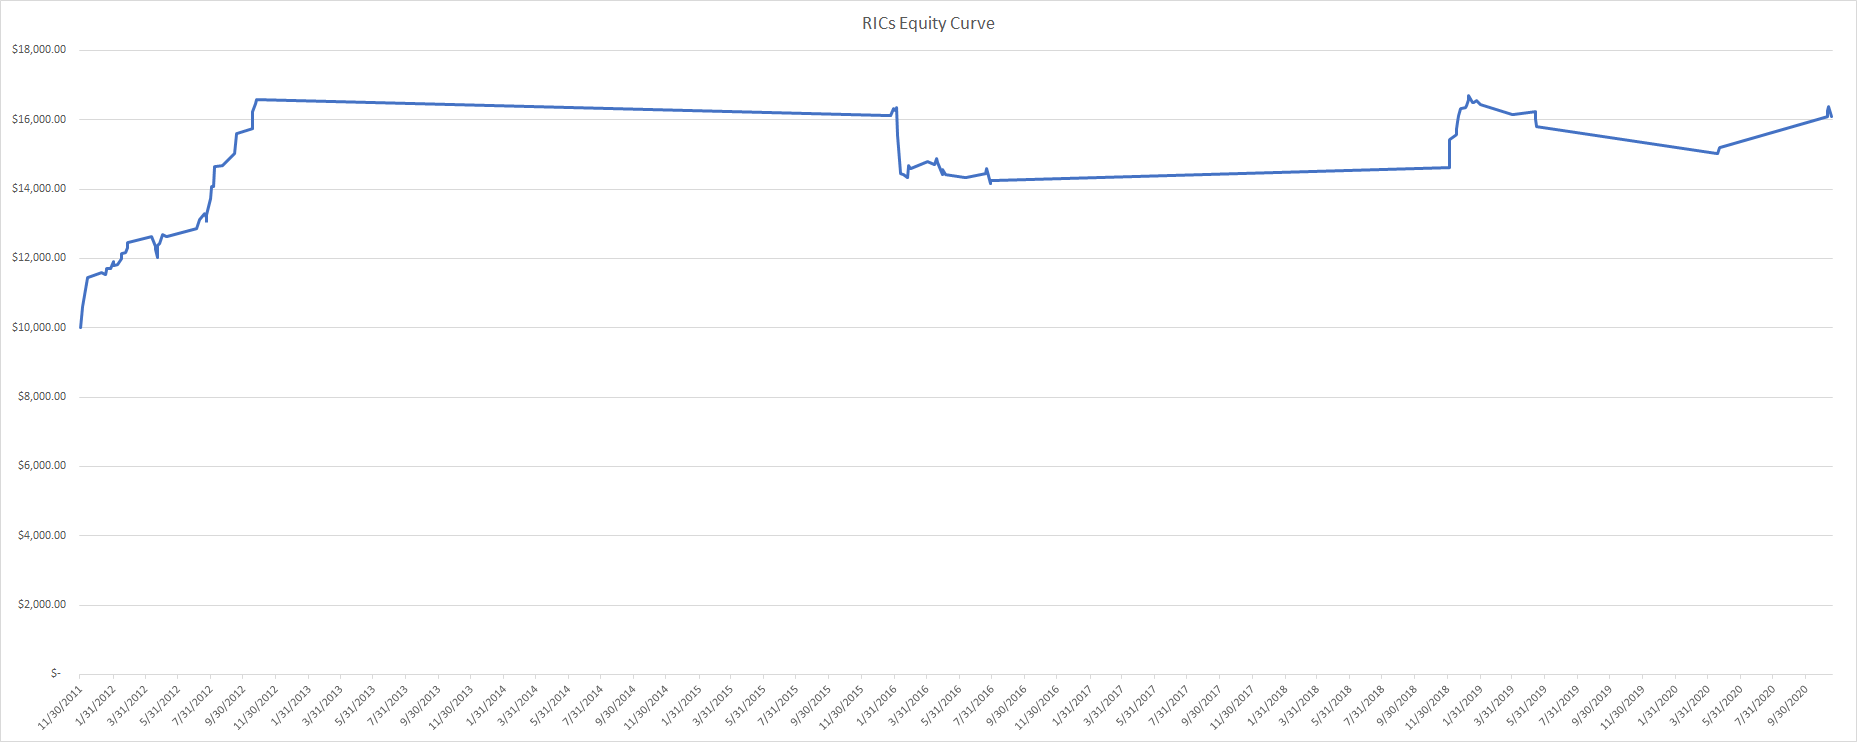
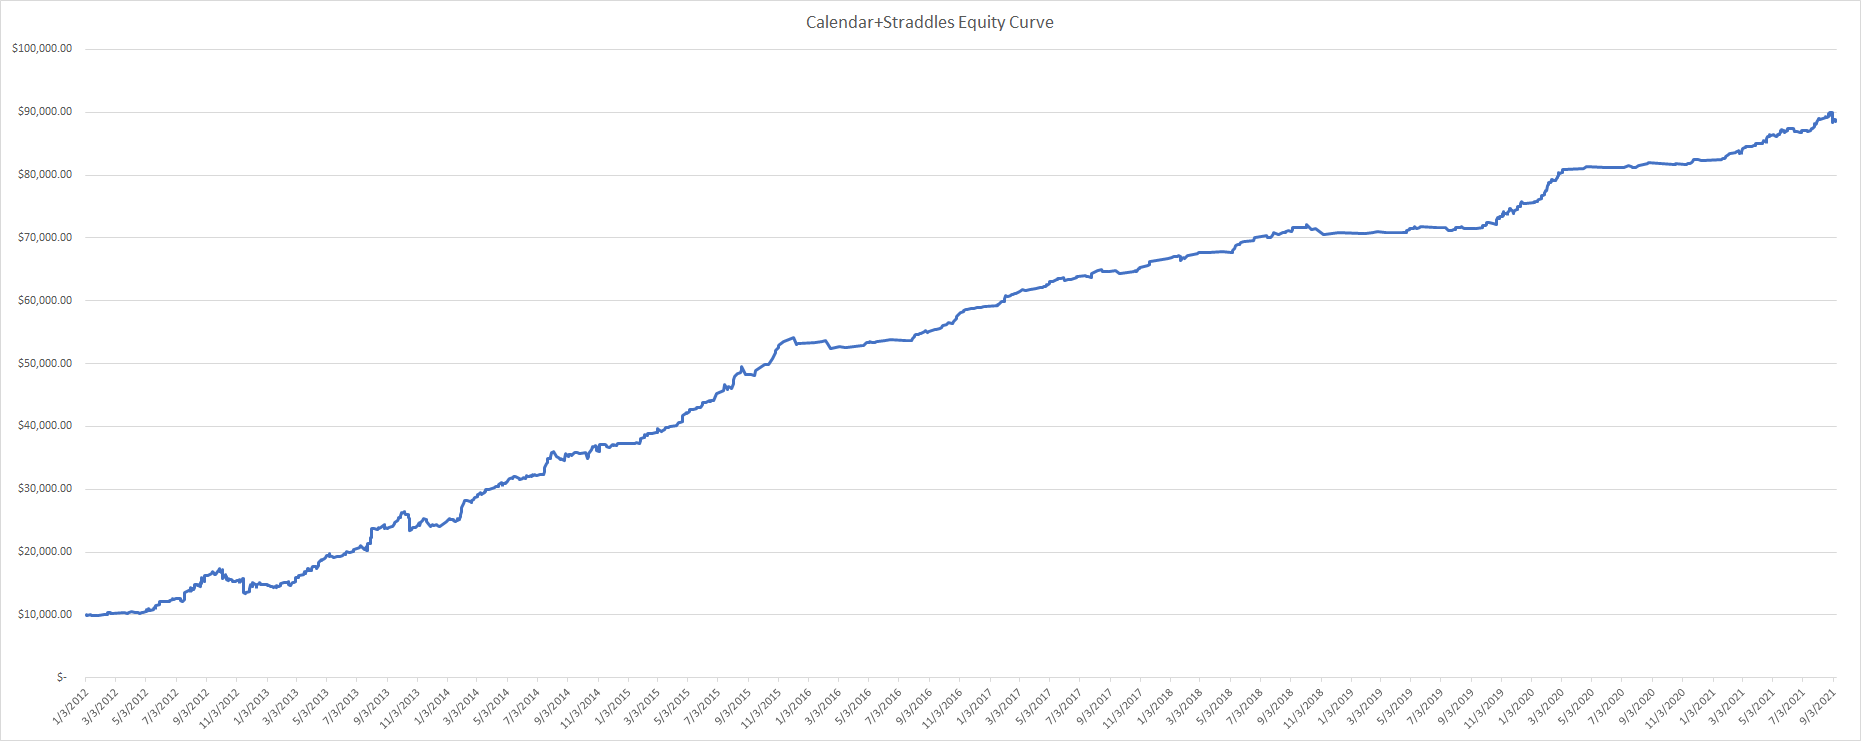
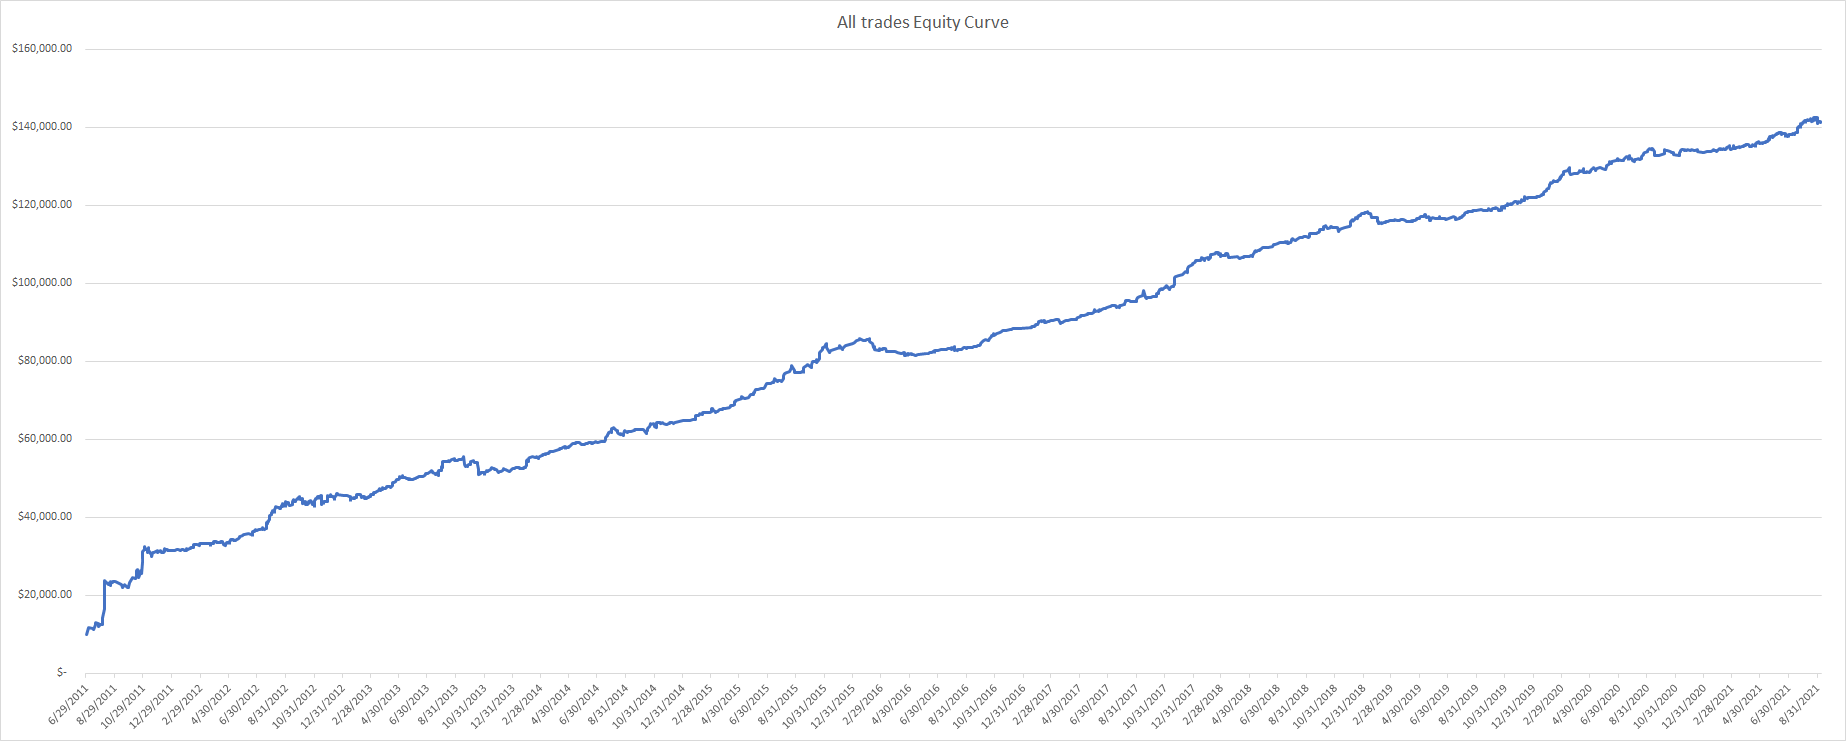
Yes, it's not only the returns, but the volatility of your equity curve that matters, or how much you suffer along the way. I decided to put together some equity curves, assuming that on day 1 we have $10000 and then I execute only calendars, and repeated that with strangles, straddles, hedged Straddles, RICs, calendars and straddles together, and the whole set of SO trades. The first thing you will notice is that calendars on their own are great, probably because they tend to start half size. Strangles started strong but have been just doing nothing Straddles are slow and steady, rarely producing big drawdowns. Hedged straddles joined the party rather late, so it may be too soon to say if the current chop if the curve will remain so RICs really had to go Once you start combining, the curve starts smoothing. This is just calendars and straddles: The combination of great, good, and not so good strategies, having their successes and failures along the way, really smoothed the equity curve of SO: This shows why SO has such a high Sharpe ratio. I am glad I discovered SO! Excited to learn all these strategies!
 2 points
 -
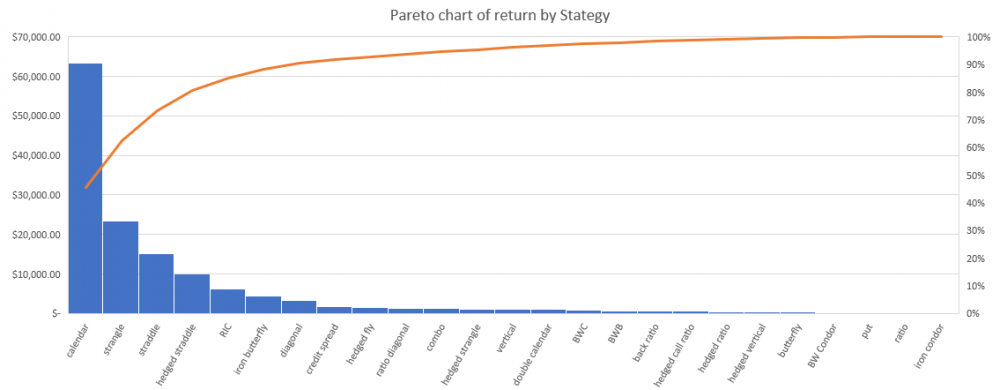
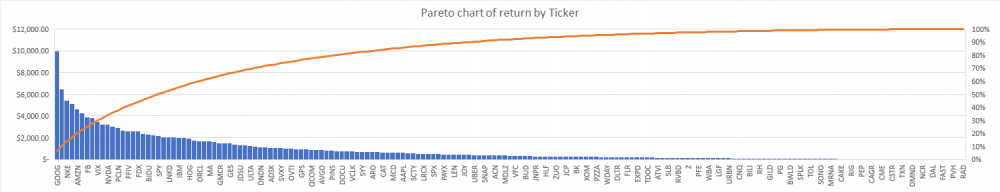
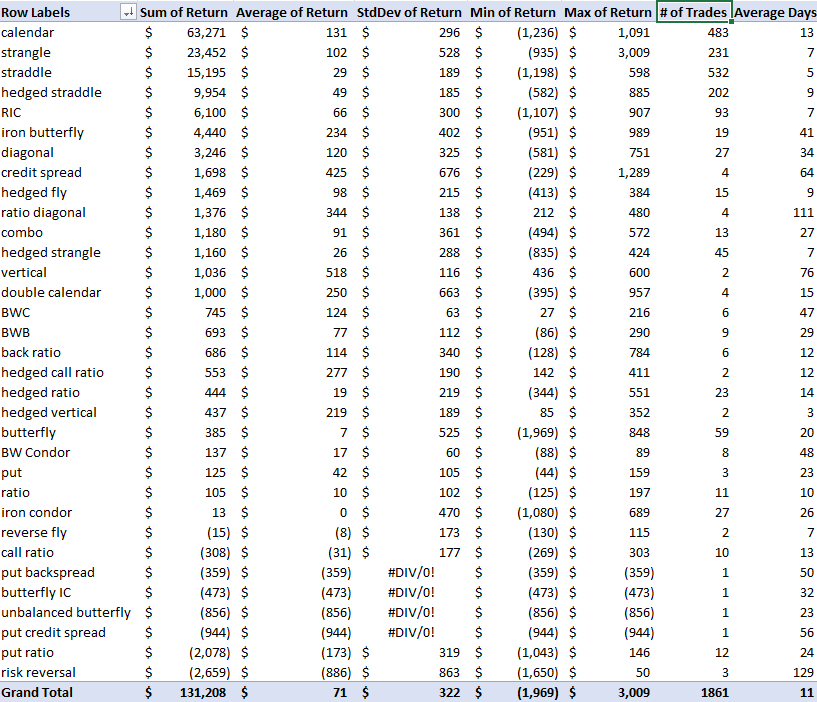
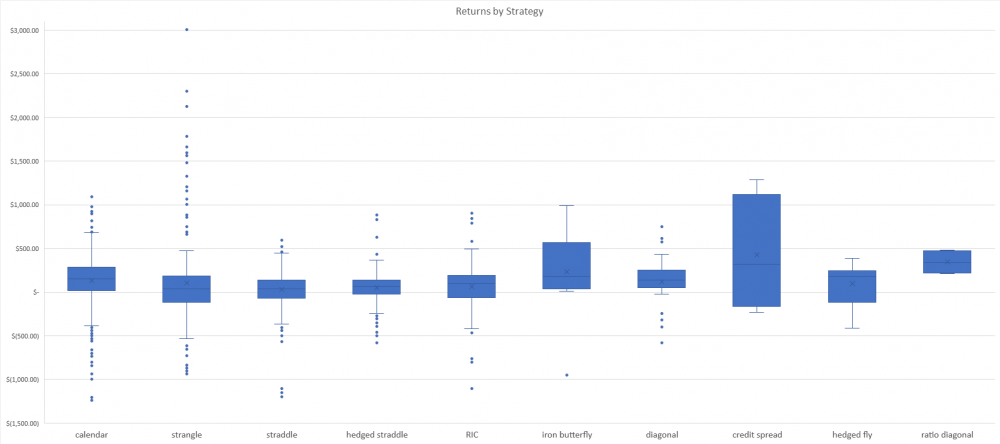
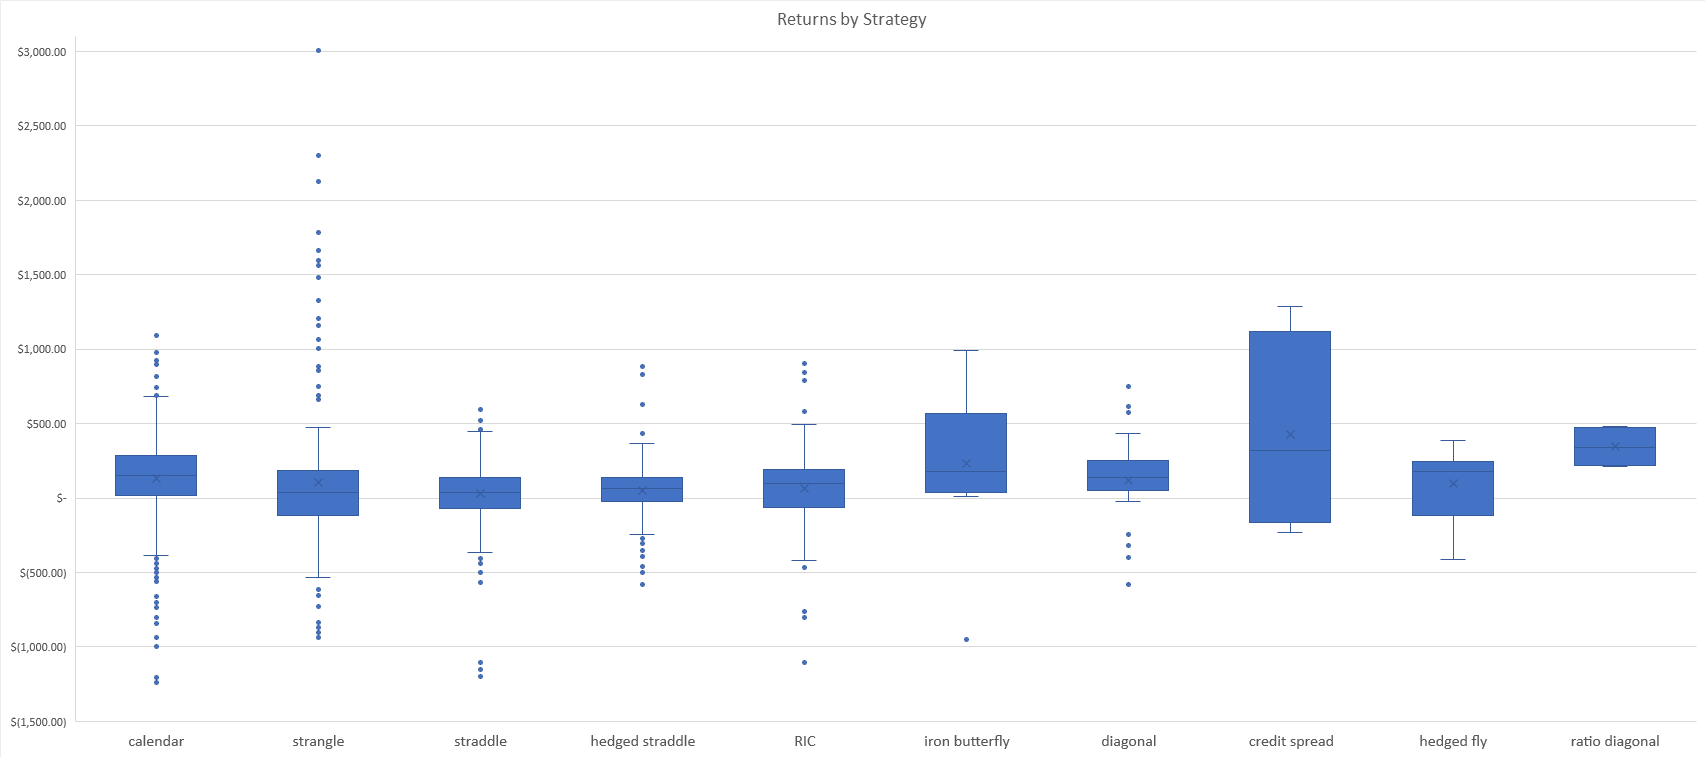
I have put all the SO Trades from the Performance page into a spreadsheet and calculated the following: About half the money made by the model SO trades comes from calendars, and about 80% are a combination of calendars, strangles and straddles. Things are more distributed by tickers, but you can see GOOGL is a favorite money maker Now, how much is it because some strategies are traded more often and when because that strategy is more profitable? Since all trades are sized in proportion to a 10K portfolio, I thought that to truly compare apples to apples we have to look at dollar returns: Calendars are not only traded the most often, but they have a pretty decent average return based on the standard allocation. Straddles are the most traded strategy, it lasts 5 days on average, but the average return is $29. Hedged straddles improve returns at the expense of almost twice the days in trade. More visually: These calendars are truly great!
 2 points
 -
To build on Ringandpinion and Kims points, the other danger that an income plan builds in is psychological: you need to trade to made an income. In practice youll have some good months where you print money (Last years Peloton ratio trades) and other months when there just arent as compelling opportunities. Being forced to take a trade for income reasons forces you to take more risk than you nessesarily want to which makes the p&l hurt more than it should. Being able to not trade for income and take only the trades that you want is a much more psychologically healthy space and one which is much less likely to lead to burn out.1 point


This leaderboard is set to New York/GMT-04:00