Leaderboard


Popular Content
Showing content with the highest reputation on 10/23/14 in all areas
-
You should look at LiveVol. They have the best tool for IV skew.1 point
-
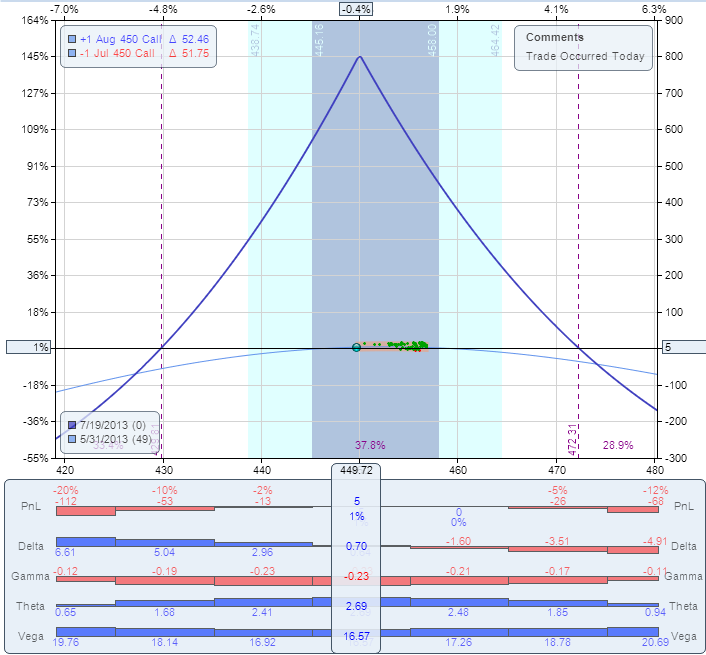
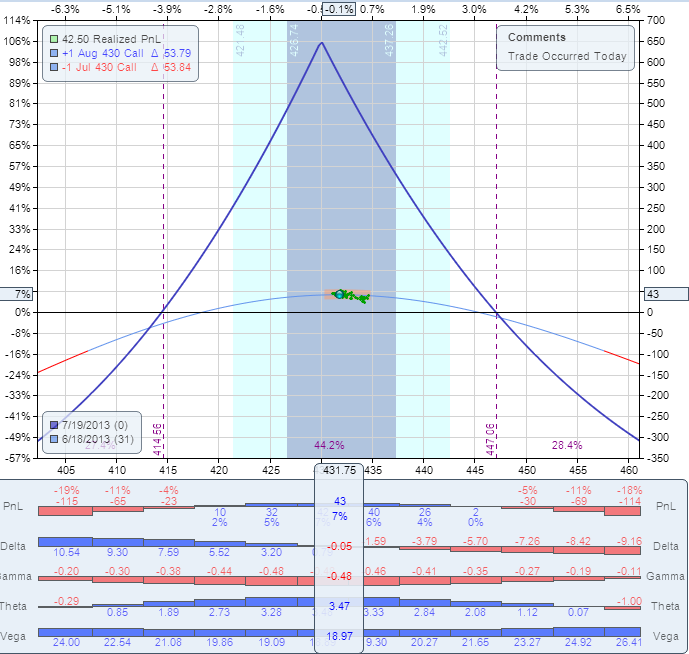
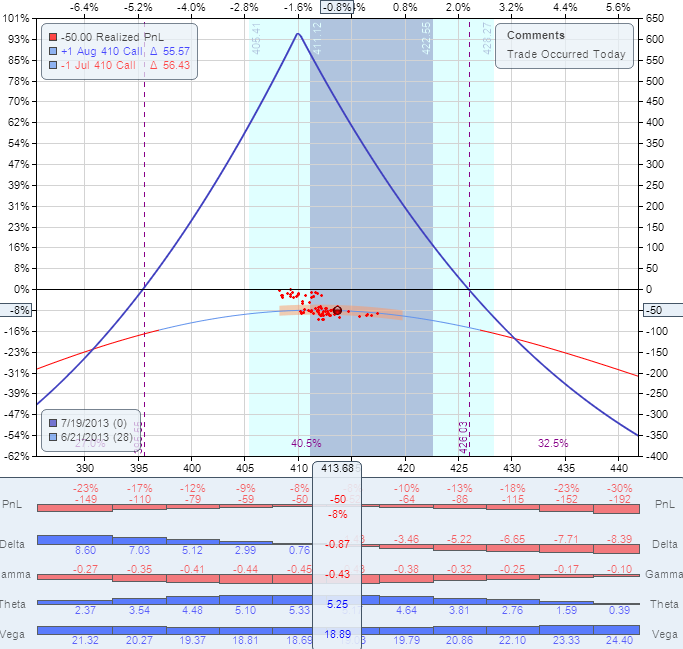
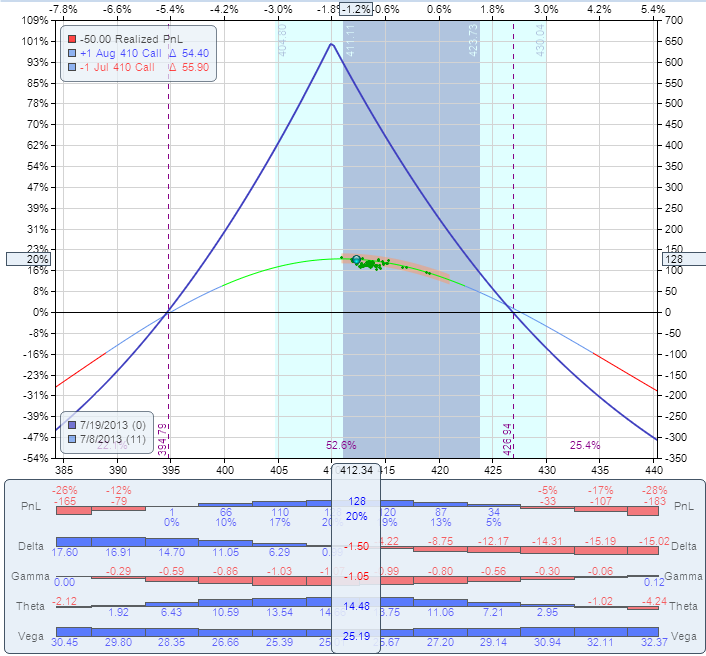
I usually don't do post-mortem on our trades - most of them are short term, we are in the trade just few days, close them and move on. However, this trade is worth to do a post-mortem so we all can learn from it. Background: When we trade a calendar spread, we have two Greeks working for us: the Theta (time decay) and the Vega (IV). We have one Greek working against us: the Gamma (stock movement). The trade makes money if the stock stays in the range and IV does not decline. It can lose if the stock moves, but even if the stock doesn't move, IV decline can kill the trade. The AAPL trade was opened on May 31 and structured in the following way: Buy to open AAPL August 16 2013 450 call Sell to open AAPL July 19 450 call Price: $5.50 debit. The P/L chart looked like this: Since AAPL is scheduled to report earnings on July 23, the long options expire after earnings and they were expected to hold value. The IV of August options was around 27% which is pretty low. It was expected to rise as we get closer to earnings. Fast forward to June 18. The stock is trading slightly below 430. The trade was up ~6% at this point. This is our adjustment point. The correct action was to roll the trade to 430 strike, by selling the 450 calendar and buying the 430 calendar, same expiration. The roll would cost $0.75. The new P/L chart would look like this: Fast forward to June 21. The stock is trading around 413. The trade was down ~8% at this point. This is our second adjustment point. The correct action was to roll the trade to 410 strike, by selling the 430 calendar and buying the 410 calendar, same expiration. The roll would cost $0.30. The new P/L chart would look like this: The stock continued drifting lower, but it did not reach the next adjustment point. After briefly going below $400, it reversed and came back to $412 on July 8 and could be closed for 20% gain: Why didn't we do it and what can be learned here? When the stock reached $425, I estimated that it is oversold and is not going much lower. The IV of August options was still at very low levels. I expected it to start rising as we get closer to earnings. The IV rise would at least partially offset the gamma losses. It did not happen. In fact, today the IV of August options is still around 29% which never happened. The IV of the monthly options before earnings was never below 35%, usually closer to 40%. To add insult to injury, when the stock reached $410, I added a "hedge" by opening a short term 410 calendar. This calendar has lost another $0.60, adding to the overall loss. It also increased the overall investment by almost 40%. This was throwing good money after bad. After the stock recovered to $430, I had a chance to close it for breakeven, but I left it open - again, due to the expectation that IV of the August options just cannot remain that low. The trade was finally closed today for 35% loss. Few things contributed to the big loss: 1. The stock moved more than 50 points at some point which is almost 2 SD (Standard Deviations). 2. The IV of the long options was almost unchanged before earnings which is extremely unusual. 3. The "hedge" added to the loss". 4. The trade was not adjusted in time. Expecting the IV to rise was a reasonable expectation. It did not happen, but there was a high probability that it will. We trade probabilities. There is a big difference between probability and certainty. There was a high probability that IV will not stay that low, based on historical patterns. However, high probability is still not certainty, and IV did not rise as I expected. When something happens few cycles in a row, we have a reasonable expectation that it will happen again. We trade based on those expectations, but we know that patterns not always repeat. In this trade, the main mistake was not expecting the IV rise - the main mistake was not to adjust when the price got to the adjustment point. The trade was actually up 12% after few days, and some members closed it for a gain. My original profit target was 20-25%. I don't think it was a mistake not to take profits at 12%. While there is nothing wrong to set a 10% target on those trades, I like to set higher profit targets, based on my experience with those trades. The bottom line is that despite the unfavorable conditions, with proper management we could still make 15-20% on this trade. The main lesson from this trade: When trading non-directional strategies, never let your opinion affect the trade. Always follow the rules, adjust in time, no matter how oversold or overbought the stock looks.
 1 point
 -
Anchor Trades FAQs What is Anchor Trades? We would suggest starting with this Introductory post describing the strategy. Then read some of the discussions on the Discussion forum. Why was Anchor Trades spun off from Steady Options? After much discussion, Kim and I elected to spin Anchor Trades off of Steady Options because the two strategies are so completely fundamentally different in how they are executed and the purpose behind them. Steady Options largely advocates income producing option strategies around earnings events and other non-directional strategies. Whereas Anchor Trades primary purpose is the preservation of capital through long term hedging, without sacrificing principal. It is a year to year portfolio management style. You will not be making four to ten trades a week, you will not generate steady income, and you will not trade dozens upon dozens of instruments. However, you will have a strategy under your belt that is designed to preserve your capital in all markets -- bull, bear, and neutral. As discussed more in the Anchor Trade Strategy Post, I personally believe, and back testing has proven, if you don't lose money in years when the markets go down, and make money in all other markets, over any extended period of time, your performance should obliterate market returns. Because these two strategies vary so much, and target very different purposes and investment strategies, Anchor Trades was separated. How do I use Anchor Trades? The exact same way you would use Steady Options or the majority of other educational and/or newsletter services. I would highly suggest reading the introductory threads, asking any questions you may have, and then following the trades for a period of a few months until you are comfortable enough with them prior to doing so in your own account. You may also paper trade them for any length of time you desire. How much can I make using the Anchor Trading strategy? Over time (a period of several years), you can expect returns well above the market average. In bull markets, if the strategy performs as anticipated, you should lag slightly behind the S&P 500. In neutral markets, you likewise should be neutral, or slightly outperform the S&P 500. However, in bear markets, you should significantly outperform the S&P 500. For example, in the 2008 bear market, the S&P 500 lost over 38%. However, had you been using the Anchor strategy, you would have returned over 29% -- outperforming the market by almost 60%. How do you calculate your performance? I compare performance against the S&P 500 monthly, annually, and over the life of the strategy. Each month a post will be made comparing the returns of the Anchor Strategy as compared to the S&P 500, as well as an open discussion on the results. Please note that posted results include commissions. What is the minimum account size for this strategy? Our model portfolio is $100,000. The trade alerts will be posted with regular SPY options. To implement the strategy, exactly as presented in the weekly trades, the minimum size account recommended is $50,000 (this is a total account size including all components). How do new members "catch up" so everyone is in the same position? There is a detailed guide on the members forum how to start a new portfolio. Your long calls and puts might be slightly different than the official portfolio, but the short puts should be very similar. Then you just follow the adjustments posted on the forum. Can I use this strategy in an IRA? It depends on your IRA custodian. Most IRA custodians will not allow short selling of stock or options, regardless if they are covered and/or hedged. However, there is no express rule against it so some do. If you want to implement this in an IRA, be sure your custodian permits the selling of puts against long term puts (calendar spreads). What if I want you to handle these trades for me? If you are an accredited investor or qualified client, I would suggests investing in the Anchor Fund, a hedge fund I manage. There are certain advantages to having invested in a large fund that implements this strategy over trading in a private, smaller, account. For one, selling far out of the money covered calls can be utilized to extract one to two extra percentage points of gain per year. You can also own a greater diversification of equities, further isolating individual security risk. If you are a qualified client or accredited investor, and would like to discuss an investment in the Anchor Fund, please feel free to contact me at your convenience. I work full time, can I benefit from this service? YES! This strategy is specifically oriented around low management and time commitment. As there is a long term hedge in place, if the market absolutely tanks one week -- well that's a good thing. There is only one required trade per week (rolling of the short puts). There will be other adjustments made (rolling the longs to lock in gains, adjusting the weekly shorts to extra more premium, etc.), but none of these trades are mandatory, they just help to increase performance. How do commissions impact this trading strategy? As in any trade, the cost of commissions has to be considered. However, the total cost of commissions for running the Anchor strategy for a year should run well less than one percent (1%) of the portfolio value. Most members use either TDAmeritrade's Think or Swim platform ("TOS") or Interactive Brokers (IB), but by all means choose the broker you feel best suits your trading style and needs -- there are dozens out there. There is a specific post on commissions that details how to account for the cost of commissions annually in preparing the strategy for your personal use. How can I contact you? The best way to contact me directly is a PM through this website. You may also post in the relevant forum or email me directly at cwelsh@lorintinecapital.com. Can I share this information with my family and friends? Please note that all of this information is copyrighted and may not be shared, as stated in your membership agreement. That said, if you have a family member or friend that is interested in the Anchor Fund, or the strategy through this site, feel free to invite them to join. If they are more interested in the Anchor Fund itself, just direct me to them, and I will get them all the materials they need.1 point


This leaderboard is set to New York/GMT-04:00