Leaderboard


Popular Content
Showing content with the highest reputation on 08/30/12 in all areas
-
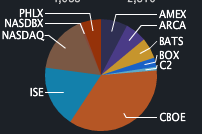
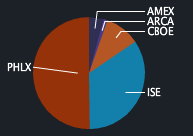
Joining the party late, but thought I'd throw in my thoughts/observations, especially with respect to TOS. TOS is paid for order flow, mostly PHLX. TOS has claimed that they cycle through exchanges, but maybe it's 8 to PHLX, 1 to ISE, 1 to CBOE, then the next 8 to PHLX. I don't know, but it would allow them to make such statements and still be true. TOS doesn't have a "SMART" feature per-se, but by defaults routes orders to the "BEST" exchange. Of course, is that best for TOS's order flow kickbacks, or best for getting my order filled at the best price...I don't know. Here's what I do. I'll try BEST briefly. If that doesn't get filled in a timely fashion, I'll cancel/replace and route to ISE. Many times an order that's been siting for minutes, gets filled instantly when switching the exchange. Sometimes it doesn't, so I'll cancel/replace and route to CBOE. And now sometimes I'll cxl/repl and send to PHLX, as they are getting a LOT more volume these days on RUT. And sometimes, I'll even split my order simultaneously to 2 or 3 exchanges. That is, if I want to trade a 10-lot, I'll send 4 to ISE, 3 to CBOE and 3 to PHLX. Whichever gets filled first, and the others are still unfilled, I'll move them over to the exchange that I did get filled on. Also, certain exchanges seem to have more volume than others, depending on the underlying. Attached are examples of AAPL (high CBOE slice of the pie) vs. RUT (high PHLX) for today's trading so far. AAPL: RUT:
 1 point
 -
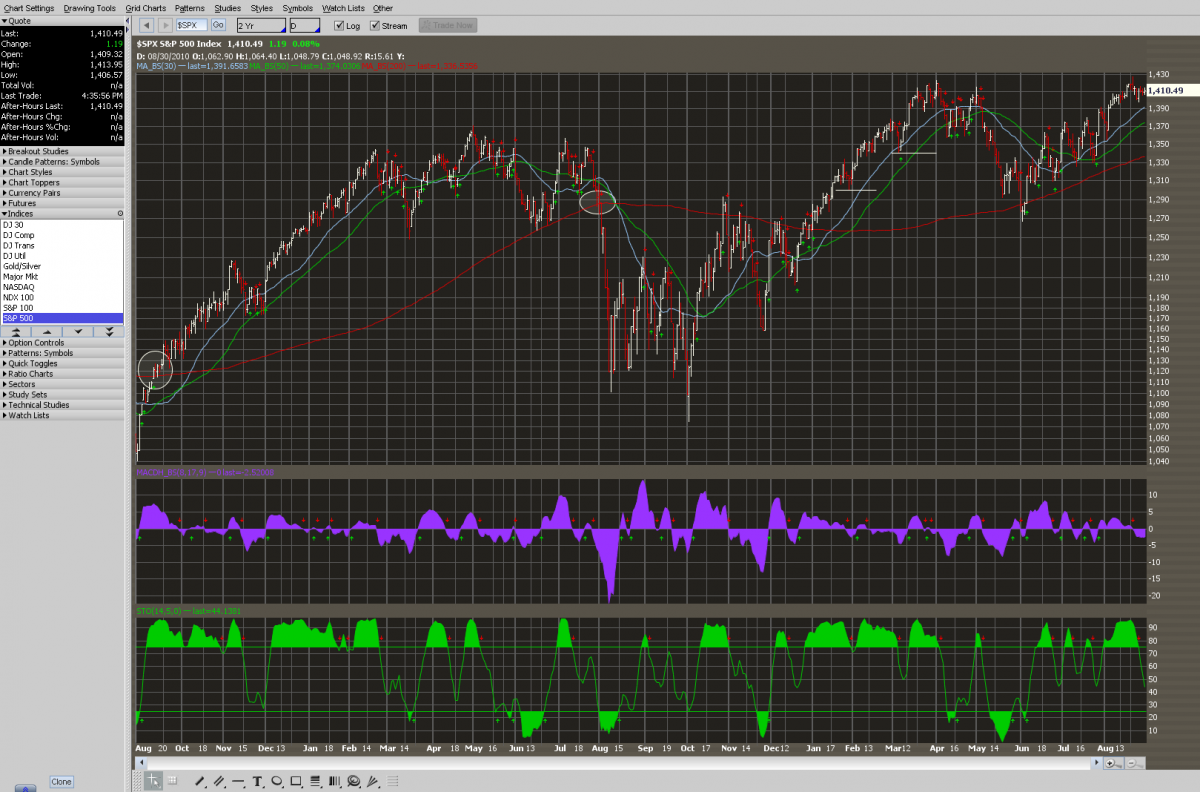
Back to this point, I've attached a 2 year chart of the S&P 500 w/30, 50, and 200 D SMAs (blue, green, red lines). MA_BS(30) == Moving Average with breakout signals (30 days). If you have TOS or some other good charting platform, you can explore how well this works (or doesn't work) further back. If you look at the far left, at ~Sept 2010 and entered when the S&P crossed above 200 D SMA (red line), rode it all the way up and didn't exit until it crossed below at ~August 2011, you'd have lost some of your gains. If you look at some of the points where it crossed the shorter MAs (30 or 50 day) perhaps you could've taken some gains there and saved yourself some of the downside of waiting until the 200 D SMA crossover. The same thing is if you entered at ~December 2011 and got partly out at mid-April 2012, instead of waiting all the way until the cross below at June 2012. Again, this is much easier to see using the TOS app, since you can zoom in/out, move the crosshairs around, change time periods, etc.
 1 point


This leaderboard is set to New York/GMT-04:00