All Activity
- Past hour
-
As I do at the end of each year, I’ve broken down the Steady Options 2025 trade performance by trade type. Numbers were taken directly from the data in the Performance screen (plus some recently closed trades). Here’s are this year’s stats along with some comments from my perspective. Where applicable, I added totals from prior years for comparison. Unfortunately, 2025 was Steady Options worst performing year. I’ll try to present what I believe to be the main reasons for this as they apply to each type of trade. From an overall perspective, here are some key points that I believe factored into the performance: Most SO trades are Vega positive trades leading up to earnings events, so volatility plays a key role in the outcome of our trades. Volatility rising helps trades and volatility declining hurts trades. 2025 saw 4 VIX spikes that occurred rather quickly (not a gradual rise), most spikes were relatively short in duration with declines starting shortly after the spikes. When you look at the year in total, the vast majority of the time we were in time periods where volatility was falling. Trades that were in place prior to the spike performed well, but other trades that did not encompass a spike commonly dealt with falling volatility and RV declines bigger than prior earnings cycles. This meant that trade that would have been small to moderate gains in prior years turned into small to moderate losses this year. Losses above 10% were also more common. There were some things that worked very well this year, although they were in some of the portfolios outside of SO. Steady Yields (SY) and Simple Spreads (SS) performed very well as many of their trades were helped by the same things that hurt the SO trades. Most trades in SY and SS tended to be Vega negative, meaning that they were helped by declining IV – so both time decay and declining IV helped these trades. Pre-Earnings Calendars 24 Trades – 21 win, 3 loss (88% win) – Average Gain +8.77% 2024: 65 trades (81% win) – Average Gain +12.13% 2023: 65 trades (85% win) – Average Gain +9.56% 2022: 11 trades (64% win) – Average Loss -9.55% 2021: 110 trades (79% win) – Average Gain +12.82% 2020: 33 trades (85% win) – Average Gain +21.97% 2019: 54 trades (65% win) – Average Gain +9.27% 2018: 40 trades (78% win) – Average Gain +9.61% 2017: 31 trades (84% win) – Average Gain +13.81% 2016: 44 trades (80% win) - Average Gain +15.07% 2015: 51 trades (80% win) – Average Gain +12.67% 2014: 48 trades (71% win) – Average Gain +13.80% 2013: 24 trades (88% win) – Average Gain +20.60% Comments: Overall winning percentage was at the high end compared to prior years, but average gain per trade was at the lower end. This year lacked some larger gains that we got in prior years (likely due to volatility declines). Number of trades was much lower than most prior years as this year saw the calendars for many stocks having their calendar RV significantly higher than prior cycles, and therefore trades were not opened in these cases. There was a learning here to take forward into next year. For calendar trades entry we look to enter at lower RV levels and/or on stocks that show a pattern of rising calendar RV heading into T-0. Many stocks show a tendency for calendar RV to rise regardless of current levels, but we didn’t open trades on these stocks if the current RV was elevated. While we wouldn’t want to enter if calendar RV was sky high, hindsight showed that opening trades when RV was slightly to moderately elevated wound up being winners. Earnings calendars continue to be a core SO strategy. Straddles/Strangles 42 Trades - 21 win, 20 loss, 1 break-even (51% win) – Average Loss -0.56% Breaking down further by hedged and non-hedged: Non-Hedged – 21 win, 17 loss, 1 break-even (55% win), average gain +0.24% Hedged – 0 win, 3 loss (0% win), average loss -10.97% 2024: 57 trades (73% win) – Average Gain +4.72% 2023: 166 trades (64% win) – Average Gain +1.65% 2022: 148 trades (71% win) – Average Gain +4.89% 2021: 129 trades (68% win) – Average Gain +3.27% 2020: 118 trades (67% win) – Average Gain +2.80% 2019: 106 trades (68% win) – Average Gain +3.58% 2018: 72 trades (83% win) – Average Gain +5.40% 2017: 77 trades (79% win) – Average Gain +5.02% 2016: 18 trades (72% win) – Average Gain +5.19% 2015: 44 trades (68% win) – Average Gain +2.61% 2014: 74 trades (62% win) – Average Gain +2.54% 2013: 104 trades (57% win) – Average Gain +1.35% Comments: Lower number of straddle/strangle trades compared to prior years, due primarily to double diagonal (DD) trades which have similar gain targets to straddles and strangles but can be kept open longer. Overall winning percentage and average gain per trade were at lows. This is primarily due to the decline volatility which saw straddle RV dropping by larger percentage compared to cycles in prior years. When the stock price did moves, gains were often muted when factoring in the larger RV declines. From a downside risk perspective, we saw more losses above 10% compared to prior years with 7 of the 20 losing trades having a loss greater than 10%. 12% of trades hit 10% gain target, which is lower compared to prior years. These trades remain low risk trades as it takes RV dropping much more than their prior cycle tendencies to be significant losers – unfortunately we saw more cases of the outsized RV drops this year. Double Diagonals DD trades have the goal of having performance similar to straddles/strangles – but have the ability for the trades to be open for much longer periods of time (up to 3 weeks prior to earnings) giving the stock more time to move but still have minimal downside risk. 48 Trades - 28 win, 19 loss (60% win) – Average Gain +0.79% 2024: 52 trades (73% win) – Average Gain +4.86% Comments: Winning percentage was down from last year and average gain per trade was only slightly positive. Again, a result of RV declines more than prior years. What were small winners last year because small losers this year. Last year, all losing trades were under 10% losses (majority of losses were under 5%). This year we saw 6 losses above 10%, but all losses were under 20%. The DD trade is a low risk trade type with minimal downside risk, but this year has shown that when RV declines are more than expected then losses in the 10%-15% range can occur if the stock price doesn’t move. 25% of trades hit 10% gain target (compared to 35% last year). This is not a huge difference, it means that when the stock price moves you can hit that 10% gain target regardless of what happens with RV. Pre-earnings Iron Condors In the 4th quarter we introduced the pre-earnings Iron Condor (IC) trade as a way to get a Vega negative trade type into the SO mix of trades. We targeted stocks that have a consistent and large straddle RV decline heading into earnings whose historical straddle performance show mostly losing trades (meaning the stock price doesn’t tend to move a lot prior to earnings). 10 Trades - 7 win, 3 loss (60% win) – Average Gain +0.07% Comments: Large percentage of winning trades, but one of the three losing trades was an oversized loss when stock price made a big move corresponding to a larger market downturn. Will continue with these trades in the future, trying to limit those bigger losing trades by keeping risk vs reward near equal and by selecting stocks whose straddle RV decline is both large/consistent and happens in a relatively short period of time. Other Trades Non-Earnings RICs: 2 win, 1 loss (67% win) – Average Gain +0.00%. These non-earnings trades have higher downside risk if stock price doesn’t move. In this case the 1 loss equaled the 2 wins. Hedged ratios and BWBs: 2 win, 3 loss (40% win) – Average Loss -10.90%. These were hedged directional trades, the losses were larger when the stock price didn’t move in the right direction. S&P500 addition date trade: 1 win, 2 loss (33% win) – Average Loss -14.50%. These trades play for stock price decline (or at least staying flat) after the S&P500 addition. The pattern of prior year additions was broken this year. Several of the additions this year had much less lead time compared to prior years, so this might be a factor. Summary 2025 was a very challenging year for the Steady Options model portfolio. We used the same types of trade setups and analysis that has worked for us year after year. However, the market behavior this year yielded underperforming trade results. Going forward, we will continue to try to optimize trades and limit losses – but one underperforming year does not mean we need to re-think every type of trade as they have performed consistently well in prior years As always, I’d like to highlight and thank the SO community. We continue to have a group of very smart people that seems to grow each year who share their ideas and knowledge – this is what makes SO great. Looking forward to a better 2026.
-
- 1
-

- Last week
-
I found the answer with some help here. the short exp is the friday after earnings and the long exp is the monthly exp after that. I couldn't find how to delete my post so I just leave it for anybody who was wandering. I wish the expirations were editable like with the charts.
- 1083 replies
-
- 1
-
-
- volatilityhq
- volatilityhq.com
- (and 1 more)
-
I've been using your excellent service for several years now. However, the "Dbl Cal. Cur RV" and "Dbl Cal. Med Cur RV" columns in the scanner don't match my own calculations. Could you please explain what I'm doing wrong? My approach is as follows: I take the mid-price of an ATM double calendar (buying the Friday after earnings and selling the Friday before earnings), then divide it by the current stock price. Are you perhaps using different expirations in the scanner? The charts show the exact RV I'm expecting, so my confusion is specifically with the scanner values. Thank you!
-
I see this is an older video and the quality of audio is not so great. It would be nice to have an updated video on this matter and maybe have some explanations with how we can calculate the probability for the trade to be sucessful etc.
-
This breakdown reminds me why I always say performance has to be viewed across cycles, not snapshots. 2024 gave both low-vol and stress moments, and the way downside was contained during volatile periods is what really matters long-term. The DD introduction feels like a smart evolution—same philosophy, better time flexibility. That kind of gradual refinement is how real edges last.
-
Thanks, I was thinking to also test TastyTrade, if you compare this with IB, what would be the pros for using Tasty? Thank you!
-
Hello, You can go to your Portfolio > click on your Open Option Position > click on the Position size > you will now have 4 options: Roll Position, Exercise/Roll, Close Position, View lots
-
Hello, Just curious, do you use IB API to automatically trade options via API? If yes, do you use a specific application for this, or did you built your custom trading bot ? Thanks!
-
 InvestorJourneyX joined the community
 -
 Los Angeles County Inmate changed their profile photo
 -
Los Angeles County Inmate joined the community
- Earlier
-
Those returns are even more remarkable when you consider position sizing. The SV portfolio is $10,000. Full position is around $7k. Which means that we never ever risk more than 70% of the capital. But we typically start with half position which is $3.5k, sometimes add another quarter, and rarely go to full position. This means that the model portfolio produced 20.4% while usually risking only 40-50% of the capital. And it's properly hedged against black swan event. A remarkable achievement, considering how low maintenance and scalable the strategy is.
-
Thank you for the steady hands in the trade management
-
Steady VIX 2025 Strategy Performance vs. SPY The Steady VIX 2025 strategy outperformed SPY in 2025 after closing out today’s trades. Performance Comparison: • SPY returned approximately 17.x% as of its latest level around 683. • Steady VIX 2025 finished with 20.4% total returns after including today’s closed trades. This outperformance is particularly noteworthy given that 2025 featured multiple significant VIX spikes — most notably during the April volatility surge that many market participants will remember for years. Despite these periods of elevated uncertainty, the strategy was often only half-allocated, yet still managed to outperform SPY. Trades like those executed in the Steady VIX 2025 strategy — in addition to a regular long-only portfolio — materially boosted overall returns. Also I wanted to mention, Allocation wise, we didn't over allocate, didn't take risky positions as much as possible. HALF allocation most of the time was highly conservative from our side. If someone had 1-2% better entry price as limit to enter the trade, I think most of the time there was BETTER PRICING for all the trades that we entered. So I won't be surprised folks getting 25% returns on SteadyVIX as well.
-
 Oleg Kr joined the community
 -
.thumb.png.3ff2c635675383f7a757247319c44c50.png) geckotrader changed their profile photo
geckotrader changed their profile photo -
 bigred8900 joined the community
 -
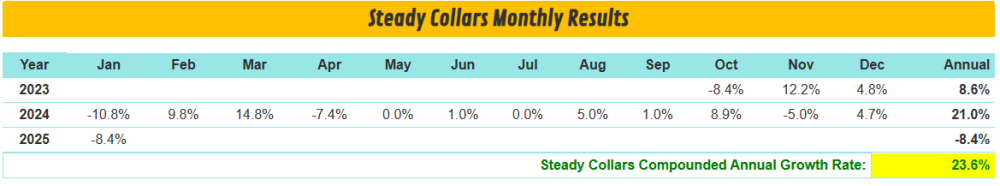
Steady Collars has been discontinued. Here are the monthly returns of the strategy:.
-
 Chas joined the community
 -
 DEOptionsTrader joined the community
 -
 Toomas joined the community
 -
 Jimbob101 joined the community
 -
Thank you, I have used it and I saw the discounted price reflected against my credit card.
-
There is a discount code in the first post of this thread.
-
@Djtux Hi, I am subscribing to Volatilityhq, previous replies had indicated a discount code. May I know if there is an updated one?
-
 raineorshine changed their profile photo
 -
I had to restrain my laughter so I won't wake up my wife!!!!! (punch line:"googled it" !! Sarang
- 1 reply
-
- 2
-
-

-
As all our American friends are recovering from their dinners and drinks, a bit of light humour on this Monday. A friend of mine knew I was an active trader and asked whether I could share my portfolio with him and we could then discuss it. To be fair to him, he was a complete newbie and I restricted myself to sharing my shares portfolio explaining that the options bit is perhaps a bit complicated. The idea was that we would talk about it and how to build a balanced portfolio, again credit to him he took it seriously and researched the companies in my portfolio perhaps further than even I had. He therefore came prepared with his homework for our discussion this weekend and proudly laid out what he found, prefacing it with: "I researched all the companies in your portfolio, there is just one I had an issue with: ALPHABET, I googled it but can't find out which company it is."
- 1 reply
-
- 10
-
-
.thumb.jpg.3669ecc0ff2657a084f79b4900863e7d.jpg) Freeman Injury Law changed their profile photo
Freeman Injury Law changed their profile photo -

Chartaffair.com - RV Charts & Backtesting for Steady Options
Bhavan1986 replied to Christof+'s topic in Promotions and Tools
@Christof+ I am looking detailed data for each company's earnings date, specifically: The market's estimated earnings date prior to confirmation The actual, finalized earnings date The date on which the company officially confirmed its earnings date (Which T-) It will help to filter out straddle matrices where returns were boosted by earnings date confirmation? Does any of the endpoints on the chartaffair provide this data? -
 Hossain Anan changed their profile photo
 -
It turns out that my issue was based on a misunderstanding. I am not permitted to trade TLT for the reasons given above but I am permitted to trade TLT options. Thankfully I can still follow the SteadyYields trades.
-
No Problem, Thanks.
-

SteadyOptions Bundles and Long Term Subscriptions
TrustyJules replied to Kim's topic in Read This First
Hi Dan - I know Kim is traveling - I am sure he will get back to you ASAP as the travel permits but response time may be slightly longer than normal. -
Hi Kim, I just started a trial one-month membership for $100 on Oct 23, 2025. The only 2 subscriptions I’m interested in are Steady Options & Simple Spreads. Since I don't margin it may be all I can trade. So before I sell and gather cash see my question. By the end of my trial I’d like do the 2 Services Bundle for $2000/3yrs with 20% discount. Is this doable without a lot of hassle? Dan Brey
-
I trade using IB (I am in France) and I never met this kind of issue. From my experience, it turned out that they always replied to me when I add a problem, even if it was with a certain delay by mail. You can also directly call them and ask.
-
Hi, I'd like to subscribe to the Steady Options service. Please, add me to the wait list. All the best!
-
Market was in rally mode that day. You should have bought a reverse ATM call calendar Can you backtest and see how it could have performed ?


