

Since its introduction in 1993, the VIX Index has been considered by many to be the world's premier barometer of investor sentiment and market volatility. Several investors expressed interest in trading instruments related to the market's expectation of future volatility, and so VX futures were introduced in 2004, and in 2006 it became possible to trade VIX options.
Options and futures on volatility indexes are available for investors who wish to explore the use of instruments that might have the potential to diversify portfolios in times of market stress.
Much of the information below is taken directly from the CBOE website.
What is VIX Index?
The CBOE Volatility Index® is an up-to-the-minute market estimate of implied (expected) volatility that is calculated by using the midpoint of real-time S&P 500® Index (SPX) option bid/ask quotes. More specifically, the VIX Index is intended to provide an instantaneous measure of how much the market thinks the S&P 500 Index will fluctuate in the 30 days from the time of each tick of the VIX Index.
CBOE calculates the VIX Index using standard SPX options and weekly SPX options that are listed for trading on CBOE. Standard SPX options expire on the third Friday of each month and weekly SPX options expire on all other Fridays. Only SPX options with Friday expirations are used to calculate the VIX Index.*Only SPX options with more than 23 days and less than 37 days to the Friday SPX expiration are used to calculate the VIX Index. These SPX options are then weighted to yield a constant, 30-day measure of the expected volatility of the S&P 500 Index.
How Do I Trade VIX?
VIX cannot be traded directly. However, traders can trade VIX futures, trade VIX options and also some other VIX related products, like VXX.
Expiration
VIX derivatives generally expire on Wednesday mornings. If that Wednesday or the Friday that is 30 days following that Wednesday is a CBOE holiday, the VIX derivative will expire on the business day immediately preceding that Wednesday.
Last Trading Day
The last trading day for VIX options is on the business day (usually a Tuesday) immediately before expiration. If that day is a CBOE holiday, the last trading day for an expiring VIX option will be the day immediately preceding the last regularly scheduled trading day.
Settlement value
The final settlement value for VIX futures and options is determined on the morning of their expiration date (usually a Wednesday) through a Special Opening Quotation ("SOQ") of the VIX Index using the opening prices of a portfolio of SPX options that expire 30 days later.
VIX Options Pricing
Please note that VIX options prices are based on VIX futures not the VIX spot. The VIX options are European exercise. That means you can’t exercise them until the day they expire. There is no effective limit on how low or high the prices can go on the VIX options until the exercise day. VIX trading hours are: 7:30am to 4:15pm Eastern time.
Practical implications:
Since VIX options are based on VIX futures, they bahave very differently from "regular" options. For example, calendar spread can have negative values - this would never happen with regular calendars.
The Relationship of the SPX and the VIX
The chart below shows the daily closing prices for the S&P 500 and VIX during the third quarter of 2012. The blue line and left scale represent the S&P 500 while the red line and right scale represent VIX. This chart is a typical example of how the S&P 500 and VIX move relative to each other on a daily basis.

The table below examines price behavior from January 1, 2000 to September 28, 2012. During this time period the S&P 500 closed higher on 1692 trading days, and of those days, VIX closed lower on just over 82% of the time. Also, during this period, the SPX closed lower on 1514 trading days, and of those days, VIX closed higher over 78% of the time. Altogether, during the period covered in the table, VIX moved in the opposite direction of the S&P 500 about 80% of the time.
|
S&P 500 Up |
VIX Index Down |
Percent Opposite |
|---|---|---|
|
1692 |
1390 |
82.15% |
|
S&P 500 Down |
VIX Index UP |
Percent Opposite |
|
1514 |
1187 |
78.40% |
Source: Bloomberg
The conclusion from those tables is simple: VIX usually goes up when SPX goes down, and vice versa. That’s why many investors have (for better or worse) seen an “investment” in VIX as a kind of hedge against market risk.
If you are not a member yet, you can join our forum discussions for answers to all your options questions.
VIX Futures Curve
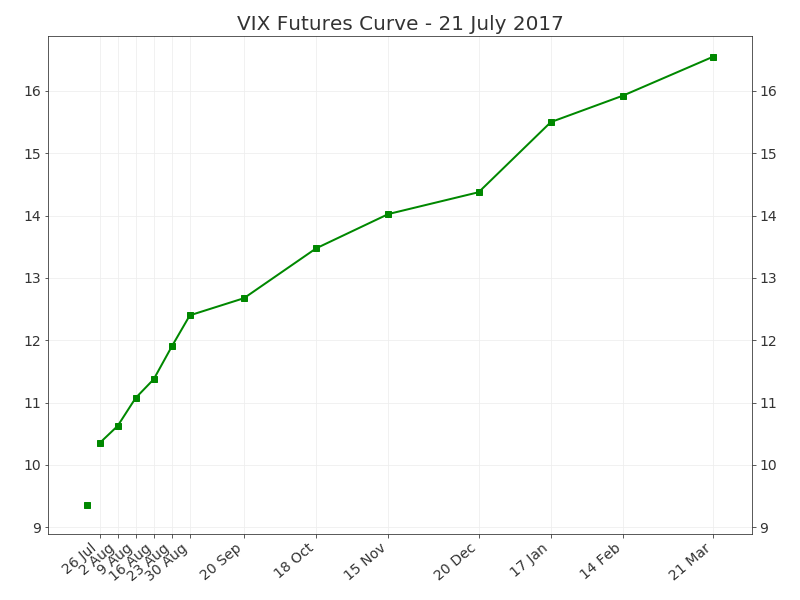
A futures curve is a curve made by connecting prices of futures contracts of the same underlying, but different expiration dates. It is displayed on a chart where the X axis represents expiration date of a futures contract and the Y axis represents prices. The concept of futures curve is similar to that of yield curve, which is used for bonds or the money market and displays interest rates of different maturities.
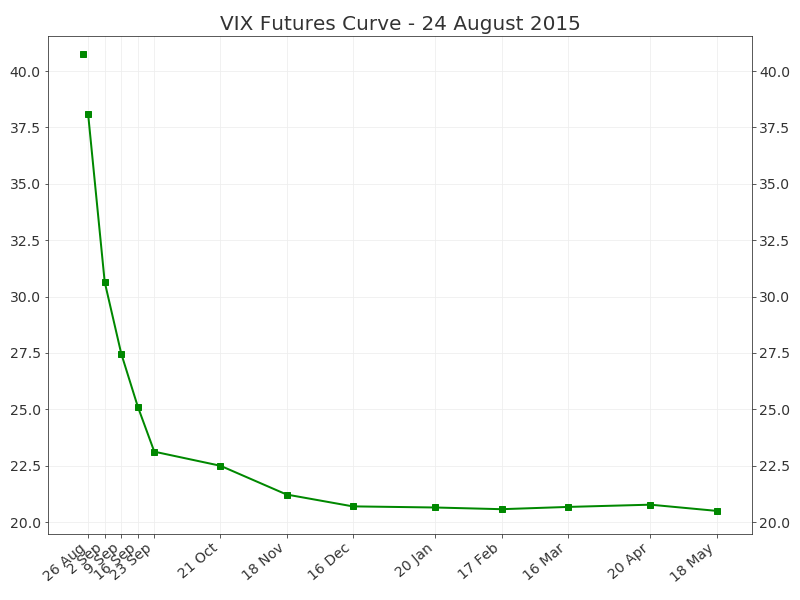
VIX futures curve is made of prices of individual VIX futures contracts. The first point (the left end of each curve) on the chart on this page is the spot VIX Index value; the others are futures prices.
Contango vs. Backwardation
When a futures curve is upward sloping from left to right, it is called contango (we say that a market is in contango). In contango, near term VIX futures are cheaper than longer term VIX futures. Contango is very common in VIX futures, especially when the spot the CBOE Volatility Index® is very low. Contango can be interpreted in the way that the futures market expects the VIX (and volatility in general) to rise in the future.
The opposite situation, when near term futures are more expensive and futures curve is downward sloping, is called backwardation. Backwardation is less frequent than contango in VIX futures, but not uncommon. It typically occurs when the spot the CBOE Volatility Index® spikes up (to levels such as 35-40 or more) and the market expects volatility to calm down somehow in the future.
VIX Term Structure (or VIX Futures Term Structure) is also the name frequently used for VIX futures curve.
Conclusion
VIX is a very complicated product. Please make sure you understand how it works before trading it.
Related articles
- Using VIX Options To Hedge Your Portfolio
- VIX Term Structure
- 10 Things You Should Know About VIX
- VIX - The Fear Index: The Basics
- How Does VIX Work?
- How To Lose $197 Million Trading VIX
- Top 10 Things To Know About VIX Options
Want to join our winning team?






There are no comments to display.
Join the conversation
You can post now and register later. If you have an account, sign in now to post with your account.
Note: Your post will require moderator approval before it will be visible.