
For example, since technology has been the hot sector in recent years, I regularly see portfolios that are now heavily overweight in technology stocks and sectors funds. As students of market history, we only need to look back to the late 90’s to see how concentrated sector exposure like this can potentially lead to enormous drawdowns. Academic research has shown that exposure to certain types of risks provide higher expected returns, while other risks that can be diversified away don’t provide those high returns. We should only take risks that are supported by broadly accepted academic research to have higher expected returns.
My issue with TSM funds is that since they hold the entire market, including small cap stocks, I regularly find that investors believe they’re more diversified than only holding the S&P 500. This is factually true based solely on number of securities as an S&P 500 investor would currently hold 512 stocks while a total stock market investor would currently hold 3,592 (source: Vanguard). So, diversification needs to be defined. Pictures are worth more than a thousand words. Below is a chart from Portfolio Visualizer of Vanguard’s S&P 500 mutual fund VFINX (Portfolio 1) and its TSM mutual fund VTSMX (Portfolio 2) since 05/1992. This is the earliest common inception date we can analyze. Both portfolios assume the reinvestment of all fund distributions and are gross of any applicable transaction costs.
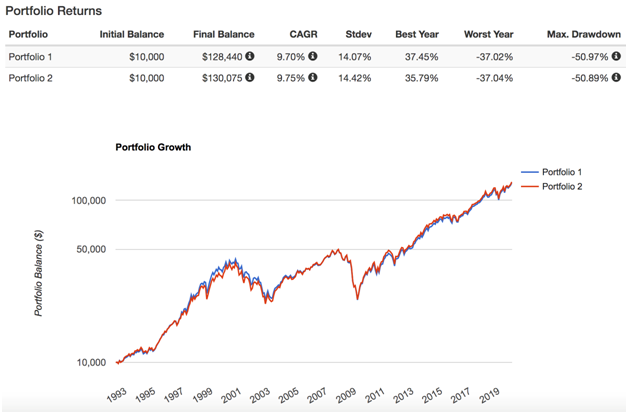
You have to look closely to even be able to tell there are two equity lines plotted on this chart. The two funds are virtually identical. How can this possibly be if the TSM fund holds about 3,000 additional stocks that the S&P 500 fund doesn’t? Because TSM funds are capitalization weighted. This means that the smaller companies have such a small weighting in the fund that they don’t really even matter. Imagine you had a $100,000 account with $95,000 in Apple stock and $5,000 in Microsoft. Clearly, Apple is going to dominate the account performance. In a TSM fund, large cap stocks are like Apple, and small cap stocks are like Microsoft.
In the next chart, I’m replacing the TSM fund as Portfolio 2 with the Dimensional US Micro Cap mutual fund (DFSCX). This fund holds the smallest decline (10%) of companies in the US market. This will actually show us how those smallest companies have performed differently than the largest ones that dominate both S&P 500 and TSM funds.
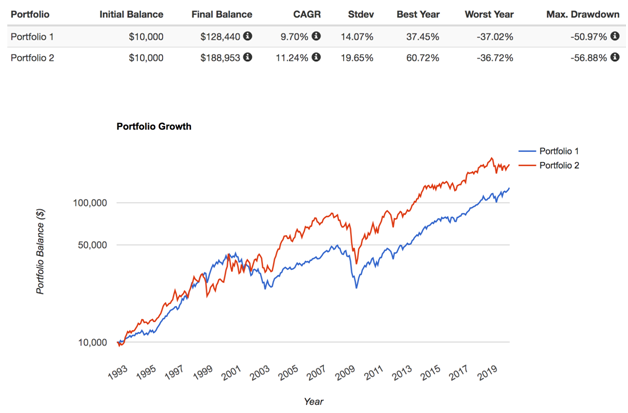
We now see a big difference visually and in the performance measurements. We see higher volatility (Stdev) from the Dimensional fund but also higher returns (CAGR). This is what should be expected based on Nobel prize winning Fama/French asset pricing theory as well as historical evidence across the globe. The “size factor” is a source of higher than market expected returns according to Fama/French research and is explained by the unique risks associated with smaller companies. We also see that the Dimensional fund zigged and zagged differently than the S&P 500 fund. This deviations in performance create diversification opportunities when both funds are combined. Technically, a TSM fund holds these same stocks that are in the Dimensional fund, but now you understand that the minimal weighting of those stocks in a TSM fund means they have no meaningful impact.
So, if smaller companies have higher expected returns and also offer diversification benefits, how much should we increase the allocation to these stocks compared to what we’d get in a TSM fund? The answer to this question depends on your personal objectives and tolerance for “tracking error.”The average investor doesn’t understand diversification very well and views the world through the lens of relative performance to the S&P 500. Viewed properly, diversification means you want different asset classes in your portfolio to perform well at different times and for different reasons.
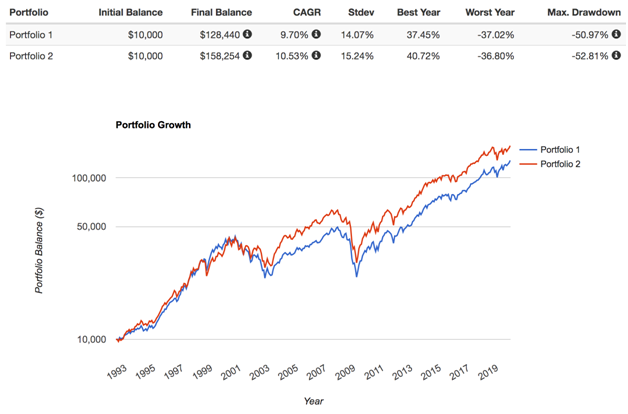
I generally recommend 20-50% in small company funds like those from Dimensional Fund Advisors for the equity portion of a portfolio. I’ll assume 40% for my last example where portfolio 2 is 60% VFINX, 40% DFSCX with annual rebalancing. This gives us enough exposure to the higher expected returns of small companies as well as their diversification benefits to actually make a difference, while also acknowledging the higher volatility of smaller companies relative to large companies so that they both contribute relatively equally to the portfolio. This is the concept known as “risk parity,” when assets are allocated based more on risk than dollars.
Additional sources of risk that Fama/French asset pricing theory and historical evidence suggests leads to higher expected returns (and diversification)is the relative price of companies. For example, if two companies have similar book values and/or expected earnings, yet one is trading at a lower price than another, asset pricing theory would suggest that the company trading at a lower price has higher expected returns. This process of sorting stocks based on relative price is commonly referred to as value (companies trading at a low relative price) and growth (companies trading at a high relative price).
Value stocks have historically produced higher returns than growth stocks in 84% of 10 year rolling periods in the US since 1926, and 95% of periods since 1975 in developed ex-US markets (source: Dimensional Fund Advisors). The average premium of value stocks during these periods was 3.5% in the US and over 5.1% in developed ex-US. Overweighting small and value stocks relative to a TSM fund are intelligent ways to increase expected returns without needing to time the market or pick individual stocks.
Conclusion
Why don’t more investors build their portfolios in line with this academically sourced research? Lack of awareness is the biggest issue…most Lorintine Capital clients do hold portfolios with varying degrees of greater than TSM weights towards small and value funds. But another reason is the term I used earlier… “tracking error” relative to commonly followed benchmarks such as the S&P 500. Small companies outperforming large and value companies outperforming growth over the vast majority of historical 10 year rolling periods is different than saying all 10 year rolling periods, and far different than outperforming over all 1, 3, and 5 year periods. We’ve seen this in recent years when any diversification away from US, large, and growth stocks has hurt performance. Those holding TSM funds have felt minimal pain since I’ve shown how that type of fund is basically the same as the S&P 500.
The average investor that is unaware of the academic research and historical evidence usually thinks 3 to 5 years is long enough to make determinations of success or failure, yet academics tell us this time period is nothing more than random noise that should have absolutely no influence on long-term portfolio decisions. If anything, we see a slight tendency for a reversal effect at this 3-5 year time frame where recently underperforming asset classes become relatively cheap compared to recently outperforming asset classes, oftentimes going on to outperform at the exact time many investors sell and chase recent winners. Over the last 3 years, US large cap (S&P 500) has outperformed US small cap value by nearly 50%.
A smarter approach is to build a portfolio diversified across US, developed ex-US, and emerging market stocks along with “tilts” to well-known sources of return like size and value.The extent to how much you tilt your portfolio should be based on your own personal tolerance for tracking error relative to common benchmarks like the S&P 500. A professional financial advisor that is well educated using academic research and experienced in managing the behavioral elements of investing can provide great value in this process.
Jesse Blom is a licensed investment advisor and Vice President of Lorintine Capital, LP. He provides investment advice to clients all over the United States and around the world. Jesse has been in financial services since 2008 and is a CERTIFIED FINANCIAL PLANNER™ professional. Working with a CFP® professional represents the highest standard of financial planning advice. Jesse has a Bachelor of Science in Finance from Oral Roberts University.


There are no comments to display.
Join the conversation
You can post now and register later. If you have an account, sign in now to post with your account.
Note: Your post will require moderator approval before it will be visible.