SteadyOptions is an options trading forum where you can find solutions from top options traders. Join Us!

We’ve all been there… researching options strategies and unable to find the answers we’re looking for. SteadyOptions has your solution.

The Importance of Time Horizon When Investing


According to Investopedia: Investment horizon is the term used to describe the total length of time that an investor expects to hold a security or a portfolio.The following set of charts are a great visual aid to help investors plan and set expectations for investing in the stock market.


Definitions:

  • DFA Domestic Balanced Strategy Index: This is a diversified blend of Dimensional US equity indices. The index is weighted roughly two-thirds large cap and one-third small cap, along with a tilt towards value. Indices are hypothetical and cannot be invested in directly.
     
  • One-Month US Treasury Bills: This is a commonly used proxy for the risk-free rate of return on cash.


Stocks are highly volatile in the short term, for example a holding period of one year. The following chart plots all rolling 12 month returns since 1950.


image.png
 

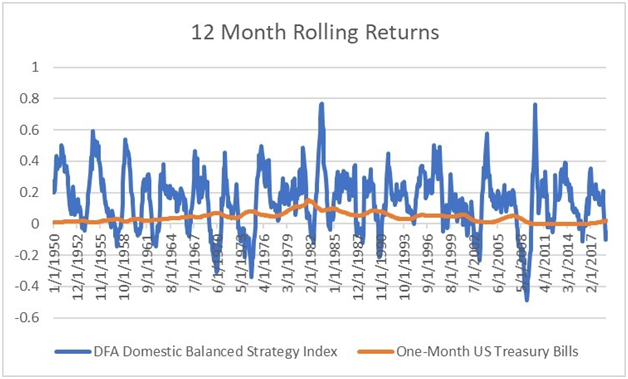
This chart tells almost everything we need to know about investing in stocks for a 12-month period. If that’s your planned holding period, don’t do it! Not only will the investment frequently underperform cash, it will lose money. Sometimes a boatload of money with 12 month returns ranging from approximately -50% to +80%! On a year by year basis, extremes are normal.


If the investment will need to be liquidated for a lump sum of capital within the next 5 years (i.e. a home down payment, car purchase, tuition payment or a readily available emergency fund), it’s probably best to not place the capital in the market as we can see in the next chart.


image.png


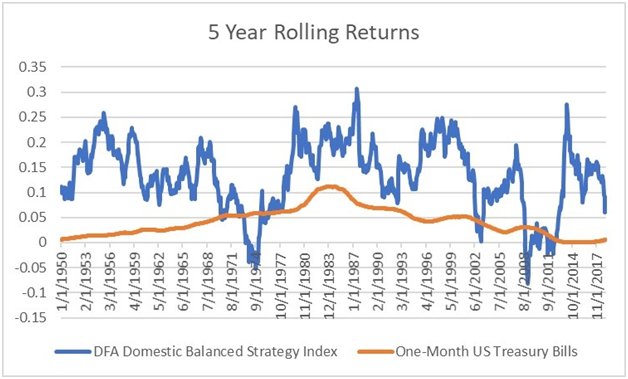
This chart is less noisy, but there are still periods when stocks have lost money over a 5-year period and even more when stocks underperform cash. For this time horizon, it’s reasonable to keep the lump sum capital in cash. Investors with the willingness to accept risk could consider keeping a modest portion in stocks with the awareness the money could be lost.


At 10 years, the advantages of investing in stocks is seen more clearly.However, history shows there is still no guarantee. For example, as recently as the bottom of the 2008-2009 crisis, the DFA index just barely produced a positive return over the prior 10 years and would have underperformed cash. Note that an S&P 500 only investor would have done far worse, losing about 30% of their capital during this period highlighting the benefits of the size and value diversification in our DFA index.


image.png


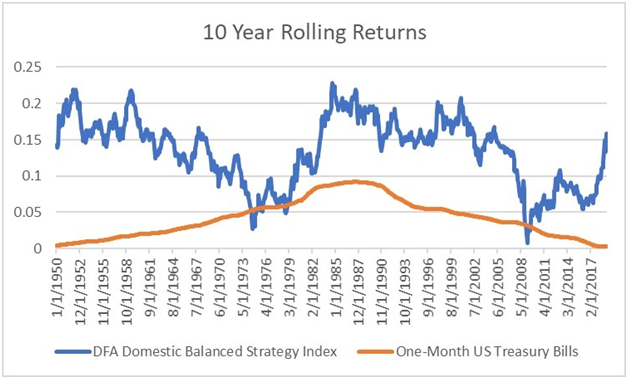
Experience teaches that many investors tend to think 3 years is a long time, 5 years is a really long time, and 10 years is an eternity. Yet history shows us that at even the 10-year time horizon, expected return relationships (such as stocks to outperform cash) don’t always materialize. This must be true, otherwise there would be no risk.Investors with a 10-year time horizon before needing to liquidate funds (a frequent example of this is a child’s 529 college fund), should invest a portion of the capital in bonds and cash with plans to increase the amount invested each year. Of course, all of this depends on each individual’s willingness and need to take risk, which is why financial planning is a personalized case-by-case process. It gives advisers the opportunities to help investors achieve their goals wisely and with the least amount of fear and stress in the process.


 The next chart shows the 20 year rolling returns. Many investors in their 50’s and 60’s don’t think this time horizon applies to them because they envision retiring at age 65. What many forget is that the time horizon for retirement planning is different than oneforpaying for a child’s college education. When a child goes to college, the expected depletion of the account is typically within 4 years. A couple entering retirement usually needs to make the capital last for up to 30 years by taking a series of smaller annualized withdrawals.A child entering the first year of college should typically have very little in stocks while a couple entering their first year in retirement will typically want to have the majority in stocks.


978860680_240MonthsVsT-bills.jpg.8274ed21871f8ae8ee2f06ba643fe309.jpg


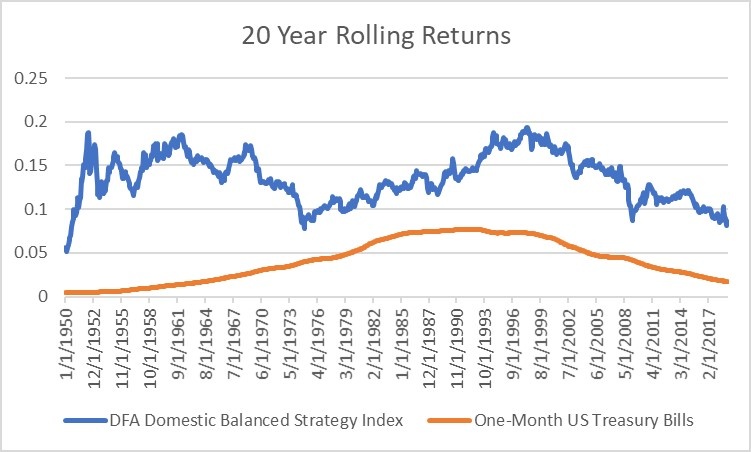
We see that there are no 20-year periods where stocks underperform cash for the DFA index since 1950. If a retirement investor follows the conventional approach of a 4% safe withdrawal rate, 96% of the portfolio remains invested each year for growth. Annualized stock market returns are much more stable historically once to and beyond this timeframe with the gap between the best and worst periods ranging from approximately +5% to +19%.


Last, study a 30-year periods;the contrast between this chart and the 12-month chart is significant.


image.png


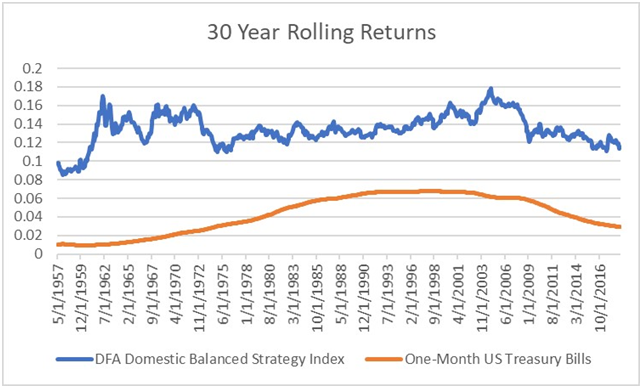
At the one-year time horizon, it’s hard to justify investing in stocks. At the 30-year time horizon, it’s hard to justify not investing in stocks. Risk for short term capital is volatility of principal, while risk for long term capital is erosion of purchasing power due to inflation. Good financial planning considers the time horizon for each objective and invests the need capital accordingly. 


Jesse Blom is a licensed investment advisor and Vice President of Lorintine Capital, LP. He provides investment advice to clients all over the United States and around the world. Jesse has been in financial services since 2008 and is a CERTIFIED FINANCIAL PLANNER™ professional. Working with a CFP® professional represents the highest standard of financial planning advice. Jesse has a Bachelor of Science in Finance from Oral Roberts University. Jesse manages the Steady Momentum service, and regularly incorporates options into client portfolios.


What Is SteadyOptions?

Full Trading Plan

Complete Portfolio Approach

Real-time trade sharing: entry, exit, and adjustments

Diversified Options Strategies

Exclusive Community Forum

Steady And Consistent Gains

High Quality Education

Risk Management, Portfolio Size

Performance based on real fills

Subscribe to SteadyOptions now and experience the full power of options trading!
Subscribe

Non-directional Options Strategies

10-15 trade Ideas Per Month

Targets 5-7% Monthly Net Return

Visit our Education Center

Recent Articles

Articles

  • SPX Options vs. SPY Options: Which Should I Trade?

    Trading options on the S&P 500 is a popular way to make money on the index. There are several ways traders use this index, but two of the most popular are to trade options on SPX or SPY. One key difference between the two is that SPX options are based on the index, while SPY options are based on an exchange-traded fund (ETF) that tracks the index.

    By Mark Wolfinger,

    • 0 comments
    • 443 views
  • Yes, We Are Playing Not to Lose!

    There are many trading quotes from different traders/investors, but this one is one of my favorites: “In trading/investing it's not about how much you make, but how much you don't lose" - Bernard Baruch. At SteadyOptions, this has been one of our major goals in the last 12 years.

    By Kim,

    • 0 comments
    • 890 views
  • The Impact of Implied Volatility (IV) on Popular Options Trades

    You’ll often read that a given option trade is either vega positive (meaning that IV rising will help it and IV falling will hurt it) or vega negative (meaning IV falling will help and IV rising will hurt).   However, in fact many popular options spreads can be either vega positive or vega negative depending where where the stock price is relative to the spread strikes.  

    By Yowster,

    • 0 comments
    • 795 views
  • Please Follow Me Inside The Insiders

    The greatest joy in investing in options is when you are right on direction. It’s really hard to beat any return that is based on a correct options bet on the direction of a stock, which is why we spend much of our time poring over charts, historical analysis, Elliot waves, RSI and what not.

    By TrustyJules,

    • 0 comments
    • 476 views
  • Trading Earnings With Ratio Spread

    A 1x2 ratio spread with call options is created by selling one lower-strike call and buying two higher-strike calls. This strategy can be established for either a net credit or for a net debit, depending on the time to expiration, the percentage distance between the strike prices and the level of volatility.

    By TrustyJules,

    • 0 comments
    • 1,483 views
  • SteadyOptions 2023 - Year In Review

    2023 marks our 12th year as a public trading service. We closed 192 winners out of 282 trades (68.1% winning ratio). Our model portfolio produced 112.2% compounded gain on the whole account based on 10% allocation per trade. We had only one losing month and one essentially breakeven in 2023. 

    By Kim,

    • 0 comments
    • 5,896 views
  • Call And Put Backspreads Options Strategies

    A backspread is very bullish or very bearish strategy used to trade direction; ie a trader is betting that a stock will move quickly in one direction. Call Backspreads are used for trading up moves; put backspreads for down moves.

    By Chris Young,

    • 0 comments
    • 9,492 views
  • Long Put Option Strategy

    A long put option strategy is the purchase of a put option in the expectation of the underlying stock falling. It is Delta negative, Vega positive and Theta negative strategy. A long put is a single-leg, risk-defined, bearish options strategy. Buying a put option is a levered alternative to selling shares of stock short.

    By Chris Young,

    • 0 comments
    • 11,143 views
  • Long Call Option Strategy

    A long call option strategy is the purchase of a call option in the expectation of the underlying stock rising. It is Delta positive, Vega positive and Theta negative strategy. A long call is a single-leg, risk-defined, bullish options strategy. Buying a call option is a levered alternative to buying shares of stock.

    By Chris Young,

    • 0 comments
    • 11,525 views
  • What Is Delta Hedging?

    Delta hedging is an investing strategy that combines the purchase or sale of an option as well as an offsetting transaction in the underlying asset to reduce the risk of a directional move in the price of the option. When a position is delta-neutral, it will not rise or fall in value when the value of the underlying asset stays within certain bounds. 

    By Kim,

    • 0 comments
    • 9,668 views

  Report Article

We want to hear from you!


There are no comments to display.


Create an account or sign in to comment

You need to be a member in order to leave a comment

Create an account

Sign up for a new account. It's easy and free!


Register a new account

Sign in

Already have an account? Sign in here.


Sign In Now

Options Trading Blogs